
 Login Sign Up


| |||||
 |  | ||||

| 12Stocks.com Market Intelligence |
Best SmallCap Stocks
|
| In a hurry? Small Cap Stock Lists: Performance Trends Table, Stock Charts
Sort Small Cap stocks: Daily, Weekly, Year-to-Date, Market Cap & Trends. Filter Small Cap stocks list by sector: Show all, Tech, Finance, Energy, Staples, Retail, Industrial, Materials, Utilities and HealthCare Filter Small Cap stocks list by size: All Large Medium Small and MicroCap |
| 12Stocks.com Small Cap Stocks Performances & Trends Daily | |||||||||
|
|  The overall Smart Investing & Trading Score is 58 (0-bearish to 100-bullish) which puts Small Cap index in short term neutral trend. The Smart Investing & Trading Score from previous trading session is 63 and hence a deterioration of trend.
| ||||||||
Here are the Smart Investing & Trading Scores of the most requested small cap stocks at 12Stocks.com (click stock name for detailed review):
|


| 12Stocks.com: Investing in Smallcap Index with Stocks | |
|
The following table helps investors and traders sort through current performance and trends (as measured by Smart Investing & Trading Score) of various
stocks in the Smallcap Index. Quick View: Move mouse or cursor over stock symbol (ticker) to view short-term technical chart and over stock name to view long term chart. Click on  to add stock symbol to your watchlist and to add stock symbol to your watchlist and  to view watchlist. Click on any ticker or stock name for detailed market intelligence report for that stock. to view watchlist. Click on any ticker or stock name for detailed market intelligence report for that stock. |
12Stocks.com Performance of Stocks in Smallcap Index
| Ticker | Stock Name | Watchlist | Category | Recent Price | Smart Investing & Trading Score | Change % | Weekly Change% |
| GCBC | Greene County |   | Financials | 28.65 | 100 | -2.08% | 0.17% |
| DOOR | Masonite | | Industrials | 131.60 | 75 | 0.24% | 0.16% |
| PANL | Pangaea Logistics | | Transports | 6.86 | 50 | -1.44% | 0.15% |
| VMEO | Vimeo | | Technology | 3.54 | 22 | 0.43% | 0.14% |
| YOU | Clear Secure | | Technology | 17.81 | 25 | -0.25% | 0.14% |
| TNK | Teekay Tankers | | Transports | 56.60 | 18 | 0.23% | 0.12% |
| BE | Bloom Energy | | Utilities | 9.64 | 28 | -1.93% | 0.10% |
| MODN | Model N | | Technology | 29.65 | 71 | 0.00% | 0.10% |
| EOLS | Evolus | | Health Care | 11.50 | 18 | -1.71% | 0.09% |
| AMSF | Amerisafe | | Financials | 50.92 | 81 | 0.04% | 0.08% |
| CFFI | C&F Financial | | Financials | 37.00 | 42 | -4.39% | 0.08% |
| LAND | Gladstone Land | | Financials | 12.70 | 52 | -0.94% | 0.08% |
| UHG | United Homes | | Services & Goods | 6.36 | 35 | 0.55% | 0.08% |
| ALCO | Alico | | Consumer Staples | 28.02 | 47 | -0.92% | 0.07% |
| LUNG | Pulmonx | | Health Care | 7.53 | 35 | 0.33% | 0.07% |
| ARTNA | Artesian Resources | | Utilities | 34.89 | 45 | -0.20% | 0.06% |
| LICY | Li-Cycle | | Industrials | 0.67 | 46 | -6.24% | 0.06% |
| PNM | PNM Resources | | Utilities | 36.63 | 45 | 0.94% | 0.05% |
| FSBC | Five Star | | Financials | 21.95 | 50 | -0.09% | 0.05% |
| SNPO | Snap One | | Technology | 10.57 | 69 | -0.05% | 0.05% |
| VZIO | VIZIO Holding | | Technology | 10.79 | 61 | 0.33% | 0.05% |
| GLNG | Golar LNG | | Transports | 25.18 | 55 | -1.41% | 0.04% |
| THS | TreeHouse Foods | | Consumer Staples | 36.75 | 35 | 0.16% | 0.03% |
| GABC | German American | | Financials | 33.17 | 17 | -0.15% | 0.03% |
| EVBG | Everbridge | | Technology | 34.89 | 75 | -0.03% | 0.03% |


| Too many stocks? View smallcap stocks filtered by marketcap & sector |
| Marketcap: All SmallCap Stocks (default-no microcap), Large, Mid-Range, Small |
| Smallcap Sector: Tech, Finance, Energy, Staples, Retail, Industrial, Materials, & Medical |
|
Get the most comprehensive stock market coverage daily at 12Stocks.com ➞ Best Stocks Today ➞ Best Stocks Weekly ➞ Best Stocks Year-to-Date ➞ Best Stocks Trends ➞  Best Stocks Today 12Stocks.com Best Nasdaq Stocks ➞ Best S&P 500 Stocks ➞ Best Tech Stocks ➞ Best Biotech Stocks ➞ |
| Detailed Overview of SmallCap Stocks |
| SmallCap Technical Overview, Leaders & Laggards, Top SmallCap ETF Funds & Detailed SmallCap Stocks List, Charts, Trends & More |
| Smallcap: Technical Analysis, Trends & YTD Performance | |
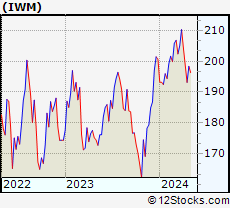
| SmallCap segment as represented by
IWM, an exchange-traded fund [ETF], holds basket of thousands of smallcap stocks from across all major sectors of the US stock market. The smallcap index (contains stocks like Riverbed & Sotheby's) is down by -1.51% and is currently underperforming the overall market by -7.17% year-to-date. Below is a quick view of technical charts and trends: | |
 IWM Weekly Chart |
|
| Long Term Trend: Good | |
| Medium Term Trend: Not Good | |
 IWM Daily Chart |
|
| Short Term Trend: Very Good | |
| Overall Trend Score: 58 | |
| YTD Performance: -1.51% | |
| **Trend Scores & Views Are Only For Educational Purposes And Not For Investing | |
| 12Stocks.com: Top Performing Small Cap Index Stocks | ||||||||||||||||||||||||||||||||||||||||||||||||
 The top performing Small Cap Index stocks year to date are
Now, more recently, over last week, the top performing Small Cap Index stocks on the move are


|
||||||||||||||||||||||||||||||||||||||||||||||||
| 12Stocks.com: Investing in Smallcap Index using Exchange Traded Funds | |
|
The following table shows list of key exchange traded funds (ETF) that
help investors track Smallcap index. The following list also includes leveraged ETF funds that track twice or thrice the daily returns of Smallcap indices. Short or inverse ETF funds move in the opposite direction to the index they track and are useful during market pullbacks or during bear markets. Quick View: Move mouse or cursor over ETF symbol (ticker) to view short-term technical chart and over ETF name to view long term chart. Click on ticker or stock name for detailed view. Click on to add stock symbol to your watchlist and to view watchlist. |
12Stocks.com List of ETFs that track Smallcap Index
| Ticker | ETF Name | Watchlist | Recent Price | Smart Investing & Trading Score | Change % | Week % | Year-to-date % |
| IWM | iShares Russell 2000 | | 197.68 | 58 | -0.45 | 2.35 | -1.51% |
| IJR | iShares Core S&P Small-Cap | | 105.71 | 85 | -0.24 | 2.41 | -2.35% |
| VTWO | Vanguard Russell 2000 ETF | | 79.93 | 48 | -0.45 | 2.37 | -1.44% |
| IWN | iShares Russell 2000 Value | | 151.28 | 75 | -0.30 | 2.37 | -2.61% |
| IWO | iShares Russell 2000 Growth | | 251.27 | 58 | -0.44 | 2.44 | -0.38% |
| IJS | iShares S&P Small-Cap 600 Value | | 97.71 | 45 | -0.43 | 2.2 | -5.2% |
| IJT | iShares S&P Small-Cap 600 Growth | | 125.37 | 48 | -0.28 | 2.59 | 0.18% |
| XSLV | PowerShares S&P SmallCap Low Volatil ETF | | 42.94 | 48 | -0.26 | 1.8 | -2.74% |
| SBB | ProShares Short SmallCap600 | | 16.37 | 33 | -0.02 | -2.79 | 2.76% |
| SMLV | SPDR SSGA US Small Cap Low Volatil ETF | | 108.43 | 73 | -0.31 | 2.21 | -3.63% |
| SAA | ProShares Ultra SmallCap600 | | 23.01 | 58 | -0.60 | 5.55 | -7.78% |
| SDD | ProShares UltraShort SmallCap600 | | 19.49 | 42 | 1.35 | -4.18 | 5.77% |
| 12Stocks.com: Charts, Trends, Fundamental Data and Performances of SmallCap Stocks | |
|
We now take in-depth look at all SmallCap stocks including charts, multi-period performances and overall trends (as measured by Smart Investing & Trading Score). One can sort SmallCap stocks (click link to choose) by Daily, Weekly and by Year-to-Date performances. Also, one can sort by size of the company or by market capitalization. |
| Select Your Default Chart Type: | |||||
| |||||
| Click on stock symbol or name for detailed view. Click on to add stock symbol to your watchlist and to view watchlist. Quick View: Move mouse or cursor over "Daily" to quickly view daily technical stock chart and over "Weekly" to view weekly technical stock chart. | |||||

 | GCBC Greene County Bancorp, Inc. |
| Sector: Financials | |
| SubSector: Savings & Loans | |
| MarketCap: 314.83 Millions | |
| Recent Price: 28.65 Smart Investing & Trading Score: 100 | |
| Day Percent Change: -2.08% Day Change: -0.61 | |
| Week Change: 0.17% Year-to-date Change: 1.6% | |
| GCBC Links: Profile News Message Board | |
| Charts:- Daily , Weekly | |
| Add GCBC to Watchlist: View: Get Complete GCBC Trend Analysis ➞ | |
 | DOOR Masonite International Corporation |
| Sector: Industrials | |
| SubSector: General Building Materials | |
| MarketCap: 1220.53 Millions | |
| Recent Price: 131.60 Smart Investing & Trading Score: 75 | |
| Day Percent Change: 0.24% Day Change: 0.32 | |
| Week Change: 0.16% Year-to-date Change: 55.5% | |
| DOOR Links: Profile News Message Board | |
| Charts:- Daily , Weekly | |
| Add DOOR to Watchlist: View: Get Complete DOOR Trend Analysis ➞ | |
 | PANL Pangaea Logistics Solutions, Ltd. |
| Sector: Transports | |
| SubSector: Shipping | |
| MarketCap: 80 Millions | |
| Recent Price: 6.86 Smart Investing & Trading Score: 50 | |
| Day Percent Change: -1.44% Day Change: -0.10 | |
| Week Change: 0.15% Year-to-date Change: -16.8% | |
| PANL Links: Profile News Message Board | |
| Charts:- Daily , Weekly | |
| Add PANL to Watchlist: View: Get Complete PANL Trend Analysis ➞ | |
 | VMEO Vimeo, Inc. |
| Sector: Technology | |
| SubSector: Software - Application | |
| MarketCap: 678 Millions | |
| Recent Price: 3.54 Smart Investing & Trading Score: 22 | |
| Day Percent Change: 0.43% Day Change: 0.02 | |
| Week Change: 0.14% Year-to-date Change: -9.9% | |
| VMEO Links: Profile News Message Board | |
| Charts:- Daily , Weekly | |
| Add VMEO to Watchlist: View: Get Complete VMEO Trend Analysis ➞ | |
 | YOU Clear Secure, Inc. |
| Sector: Technology | |
| SubSector: Software - Application | |
| MarketCap: 3510 Millions | |
| Recent Price: 17.81 Smart Investing & Trading Score: 25 | |
| Day Percent Change: -0.25% Day Change: -0.05 | |
| Week Change: 0.14% Year-to-date Change: -14.1% | |
| YOU Links: Profile News Message Board | |
| Charts:- Daily , Weekly | |
| Add YOU to Watchlist: View: Get Complete YOU Trend Analysis ➞ | |
 | TNK Teekay Tankers Ltd. |
| Sector: Transports | |
| SubSector: Shipping | |
| MarketCap: 584.714 Millions | |
| Recent Price: 56.60 Smart Investing & Trading Score: 18 | |
| Day Percent Change: 0.23% Day Change: 0.13 | |
| Week Change: 0.12% Year-to-date Change: 13.3% | |
| TNK Links: Profile News Message Board | |
| Charts:- Daily , Weekly | |
| Add TNK to Watchlist: View: Get Complete TNK Trend Analysis ➞ | |
 | BE Bloom Energy Corporation |
| Sector: Utilities | |
| SubSector: Electric Utilities | |
| MarketCap: 567.514 Millions | |
| Recent Price: 9.64 Smart Investing & Trading Score: 28 | |
| Day Percent Change: -1.93% Day Change: -0.19 | |
| Week Change: 0.1% Year-to-date Change: -34.9% | |
| BE Links: Profile News Message Board | |
| Charts:- Daily , Weekly | |
| Add BE to Watchlist: View: Get Complete BE Trend Analysis ➞ | |
 | MODN Model N, Inc. |
| Sector: Technology | |
| SubSector: Application Software | |
| MarketCap: 670.162 Millions | |
| Recent Price: 29.65 Smart Investing & Trading Score: 71 | |
| Day Percent Change: 0.00% Day Change: 0.00 | |
| Week Change: 0.1% Year-to-date Change: 10.1% | |
| MODN Links: Profile News Message Board | |
| Charts:- Daily , Weekly | |
| Add MODN to Watchlist: View: Get Complete MODN Trend Analysis ➞ | |
 | EOLS Evolus, Inc. |
| Sector: Health Care | |
| SubSector: Drugs - Generic | |
| MarketCap: 145.885 Millions | |
| Recent Price: 11.50 Smart Investing & Trading Score: 18 | |
| Day Percent Change: -1.71% Day Change: -0.20 | |
| Week Change: 0.09% Year-to-date Change: 9.2% | |
| EOLS Links: Profile News Message Board | |
| Charts:- Daily , Weekly | |
| Add EOLS to Watchlist: View: Get Complete EOLS Trend Analysis ➞ | |
 | AMSF Amerisafe, Inc. |
| Sector: Financials | |
| SubSector: Property & Casualty Insurance | |
| MarketCap: 1159.32 Millions | |
| Recent Price: 50.92 Smart Investing & Trading Score: 81 | |
| Day Percent Change: 0.04% Day Change: 0.02 | |
| Week Change: 0.08% Year-to-date Change: 8.9% | |
| AMSF Links: Profile News Message Board | |
| Charts:- Daily , Weekly | |
| Add AMSF to Watchlist: View: Get Complete AMSF Trend Analysis ➞ | |
 | CFFI C&F Financial Corporation |
| Sector: Financials | |
| SubSector: Regional - Mid-Atlantic Banks | |
| MarketCap: 145.559 Millions | |
| Recent Price: 37.00 Smart Investing & Trading Score: 42 | |
| Day Percent Change: -4.39% Day Change: -1.70 | |
| Week Change: 0.08% Year-to-date Change: -45.7% | |
| CFFI Links: Profile News Message Board | |
| Charts:- Daily , Weekly | |
| Add CFFI to Watchlist: View: Get Complete CFFI Trend Analysis ➞ | |
 | LAND Gladstone Land Corporation |
| Sector: Financials | |
| SubSector: REIT - Diversified | |
| MarketCap: 252.653 Millions | |
| Recent Price: 12.70 Smart Investing & Trading Score: 52 | |
| Day Percent Change: -0.94% Day Change: -0.12 | |
| Week Change: 0.08% Year-to-date Change: -12.1% | |
| LAND Links: Profile News Message Board | |
| Charts:- Daily , Weekly | |
| Add LAND to Watchlist: View: Get Complete LAND Trend Analysis ➞ | |
 | UHG United Homes Group, Inc. |
| Sector: Services & Goods | |
| SubSector: Residential Construction | |
| MarketCap: 566 Millions | |
| Recent Price: 6.36 Smart Investing & Trading Score: 35 | |
| Day Percent Change: 0.55% Day Change: 0.04 | |
| Week Change: 0.08% Year-to-date Change: -24.3% | |
| UHG Links: Profile News Message Board | |
| Charts:- Daily , Weekly | |
| Add UHG to Watchlist: View: Get Complete UHG Trend Analysis ➞ | |
 | ALCO Alico, Inc. |
| Sector: Consumer Staples | |
| SubSector: Farm Products | |
| MarketCap: 221.187 Millions | |
| Recent Price: 28.02 Smart Investing & Trading Score: 47 | |
| Day Percent Change: -0.92% Day Change: -0.26 | |
| Week Change: 0.07% Year-to-date Change: -3.7% | |
| ALCO Links: Profile News Message Board | |
| Charts:- Daily , Weekly | |
| Add ALCO to Watchlist: View: Get Complete ALCO Trend Analysis ➞ | |
 | LUNG Pulmonx Corporation |
| Sector: Health Care | |
| SubSector: Medical Devices | |
| MarketCap: 18187 Millions | |
| Recent Price: 7.53 Smart Investing & Trading Score: 35 | |
| Day Percent Change: 0.33% Day Change: 0.03 | |
| Week Change: 0.07% Year-to-date Change: -41.0% | |
| LUNG Links: Profile News Message Board | |
| Charts:- Daily , Weekly | |
| Add LUNG to Watchlist: View: Get Complete LUNG Trend Analysis ➞ | |
 | ARTNA Artesian Resources Corporation |
| Sector: Utilities | |
| SubSector: Water Utilities | |
| MarketCap: 299.402 Millions | |
| Recent Price: 34.89 Smart Investing & Trading Score: 45 | |
| Day Percent Change: -0.20% Day Change: -0.07 | |
| Week Change: 0.06% Year-to-date Change: -15.8% | |
| ARTNA Links: Profile News Message Board | |
| Charts:- Daily , Weekly | |
| Add ARTNA to Watchlist: View: Get Complete ARTNA Trend Analysis ➞ | |
 | LICY Li-Cycle Holdings Corp. |
| Sector: Industrials | |
| SubSector: Waste Management | |
| MarketCap: 959 Millions | |
| Recent Price: 0.67 Smart Investing & Trading Score: 46 | |
| Day Percent Change: -6.24% Day Change: -0.04 | |
| Week Change: 0.06% Year-to-date Change: 7.3% | |
| LICY Links: Profile News Message Board | |
| Charts:- Daily , Weekly | |
| Add LICY to Watchlist: View: Get Complete LICY Trend Analysis ➞ | |
 | PNM PNM Resources, Inc. |
| Sector: Utilities | |
| SubSector: Diversified Utilities | |
| MarketCap: 2755.3 Millions | |
| Recent Price: 36.63 Smart Investing & Trading Score: 45 | |
| Day Percent Change: 0.94% Day Change: 0.34 | |
| Week Change: 0.05% Year-to-date Change: -12.0% | |
| PNM Links: Profile News Message Board | |
| Charts:- Daily , Weekly | |
| Add PNM to Watchlist: View: Get Complete PNM Trend Analysis ➞ | |
 | FSBC Five Star Bancorp |
| Sector: Financials | |
| SubSector: Banks - Regional | |
| MarketCap: 377 Millions | |
| Recent Price: 21.95 Smart Investing & Trading Score: 50 | |
| Day Percent Change: -0.09% Day Change: -0.02 | |
| Week Change: 0.05% Year-to-date Change: -16.2% | |
| FSBC Links: Profile News Message Board | |
| Charts:- Daily , Weekly | |
| Add FSBC to Watchlist: View: Get Complete FSBC Trend Analysis ➞ | |
 | SNPO Snap One Holdings Corp. |
| Sector: Technology | |
| SubSector: Electronics & Computer Distribution | |
| MarketCap: 807 Millions | |
| Recent Price: 10.57 Smart Investing & Trading Score: 69 | |
| Day Percent Change: -0.05% Day Change: -0.01 | |
| Week Change: 0.05% Year-to-date Change: 13.7% | |
| SNPO Links: Profile News Message Board | |
| Charts:- Daily , Weekly | |
| Add SNPO to Watchlist: View: Get Complete SNPO Trend Analysis ➞ | |
 | VZIO VIZIO Holding Corp. |
| Sector: Technology | |
| SubSector: Consumer Electronics | |
| MarketCap: 1300 Millions | |
| Recent Price: 10.79 Smart Investing & Trading Score: 61 | |
| Day Percent Change: 0.33% Day Change: 0.04 | |
| Week Change: 0.05% Year-to-date Change: 39.9% | |
| VZIO Links: Profile News Message Board | |
| Charts:- Daily , Weekly | |
| Add VZIO to Watchlist: View: Get Complete VZIO Trend Analysis ➞ | |
 | GLNG Golar LNG Limited |
| Sector: Transports | |
| SubSector: Shipping | |
| MarketCap: 854.414 Millions | |
| Recent Price: 25.18 Smart Investing & Trading Score: 55 | |
| Day Percent Change: -1.41% Day Change: -0.36 | |
| Week Change: 0.04% Year-to-date Change: 9.5% | |
| GLNG Links: Profile News Message Board | |
| Charts:- Daily , Weekly | |
| Add GLNG to Watchlist: View: Get Complete GLNG Trend Analysis ➞ | |
 | THS TreeHouse Foods, Inc. |
| Sector: Consumer Staples | |
| SubSector: Processed & Packaged Goods | |
| MarketCap: 2392.08 Millions | |
| Recent Price: 36.75 Smart Investing & Trading Score: 35 | |
| Day Percent Change: 0.16% Day Change: 0.06 | |
| Week Change: 0.03% Year-to-date Change: -11.3% | |
| THS Links: Profile News Message Board | |
| Charts:- Daily , Weekly | |
| Add THS to Watchlist: View: Get Complete THS Trend Analysis ➞ | |
 | GABC German American Bancorp, Inc. |
| Sector: Financials | |
| SubSector: Regional - Midwest Banks | |
| MarketCap: 731.47 Millions | |
| Recent Price: 33.17 Smart Investing & Trading Score: 17 | |
| Day Percent Change: -0.15% Day Change: -0.05 | |
| Week Change: 0.03% Year-to-date Change: 2.3% | |
| GABC Links: Profile News Message Board | |
| Charts:- Daily , Weekly | |
| Add GABC to Watchlist: View: Get Complete GABC Trend Analysis ➞ | |
 | EVBG Everbridge, Inc. |
| Sector: Technology | |
| SubSector: Application Software | |
| MarketCap: 3697.92 Millions | |
| Recent Price: 34.89 Smart Investing & Trading Score: 75 | |
| Day Percent Change: -0.03% Day Change: -0.01 | |
| Week Change: 0.03% Year-to-date Change: 43.5% | |
| EVBG Links: Profile News Message Board | |
| Charts:- Daily , Weekly | |
| Add EVBG to Watchlist: View: Get Complete EVBG Trend Analysis ➞ | |
| Too many stocks? View smallcap stocks filtered by marketcap & sector |
| Marketcap: All SmallCap Stocks (default-no microcap), Large, Mid-Range, Small & MicroCap |
| Sector: Tech, Finance, Energy, Staples, Retail, Industrial, Materials, Utilities & Medical |
|
Best Stocks Today 12Stocks.com |
© 2024 12Stocks.com Terms & Conditions Privacy Contact Us
All Information Provided Only For Education And Not To Be Used For Investing or Trading. See Terms & Conditions


One More Thing ... Get Best Stocks Delivered Daily!
Never Ever Miss A Move With Our Top Ten Stocks Lists
Find Best Stocks In Any Market - Bull or Bear Market
Take A Peek At Our Top Ten Stocks Lists: Daily, Weekly, Year-to-Date & Top Trends
Find Best Stocks In Any Market - Bull or Bear Market
Take A Peek At Our Top Ten Stocks Lists: Daily, Weekly, Year-to-Date & Top Trends
Smallcap Stocks With Best Up Trends [0-bearish to 100-bullish]: B. Riley[100], Ribbon [100], Group 1[100], Trustmark [100], MBIA [100], Integer [100], EchoStar [100], Comstock Resources[100], Vishay Inter[100], Jamf Holding[100], SunOpta [100]
Best Smallcap Stocks Year-to-Date:
CareMax [574.23%], Janux [352.07%], Viking [249.65%], Alpine Immune[239.13%], Longboard [223.4%], Avidity Biosciences[177.71%], Arcutis Bio[170.9%], Super Micro[165.5%], Vera [149.61%], Hippo [130.79%], Y-mAbs [124.19%] Best Smallcap Stocks This Week:
Matterport [166.09%], B. Riley[48.82%], Seres [30.29%], Riot Blockchain[30.12%], CareMax [27.24%], Ribbon [25.97%], ProKidney [23.28%], SoundHound AI[22.54%], Cipher Mining[22.14%], Hibbett Sports[21.61%], Cullinan Oncology[20.69%] Best Smallcap Stocks Daily:
B. Riley[36.97%], Ribbon [26.46%], Babcock & Wilcox Enterprises[15.57%], Cullinan Oncology[13.55%], Amneal [12.04%], Comtech Tele[10.76%], Innodata [10.28%], Gritstone Oncology[10.06%], Navitas Semiconductor[8.83%], Eyenovia [8.68%], K12 [8.64%]