
 Login Sign Up


| |||||
 |  | ||||

| 12Stocks.com Market Intelligence |
Best SmallCap Stocks
|
| In a hurry? Small Cap Stock Lists: Performance Trends Table, Stock Charts
Sort Small Cap stocks: Daily, Weekly, Year-to-Date, Market Cap & Trends. Filter Small Cap stocks list by sector: Show all, Tech, Finance, Energy, Staples, Retail, Industrial, Materials, Utilities and HealthCare Filter Small Cap stocks list by size: All Large Medium Small and MicroCap |
| 12Stocks.com Small Cap Stocks Performances & Trends Daily | |||||||||
|
|  The overall Smart Investing & Trading Score is 13 (0-bearish to 100-bullish) which puts Small Cap index in short term bearish trend. The Smart Investing & Trading Score from previous trading session is 26 and hence a deterioration of trend.
| ||||||||
Here are the Smart Investing & Trading Scores of the most requested small cap stocks at 12Stocks.com (click stock name for detailed review):
|


| 12Stocks.com: Investing in Smallcap Index with Stocks | |
|
The following table helps investors and traders sort through current performance and trends (as measured by Smart Investing & Trading Score) of various
stocks in the Smallcap Index. Quick View: Move mouse or cursor over stock symbol (ticker) to view short-term technical chart and over stock name to view long term chart. Click on  to add stock symbol to your watchlist and to add stock symbol to your watchlist and  to view watchlist. Click on any ticker or stock name for detailed market intelligence report for that stock. to view watchlist. Click on any ticker or stock name for detailed market intelligence report for that stock. |
12Stocks.com Performance of Stocks in Smallcap Index
| Ticker | Stock Name | Watchlist | Category | Recent Price | Smart Investing & Trading Score | Change % | Weekly Change% |
| VTYX | Ventyx Biosciences |   | Health Care | 4.38 | 46 | -7.98% | -4.78% |
| RMBS | Rambus | | Technology | 57.25 | 0 | -2.50% | -4.81% |
| BCBP | BCB Bancorp | | Financials | 9.31 | 10 | -2.62% | -4.81% |
| HRTX | Heron | | Health Care | 2.77 | 38 | -5.46% | -4.81% |
| AMWD | American Woodmark | | Consumer Staples | 91.39 | 13 | -1.20% | -4.82% |
| CLPT | ClearPoint Neuro | | Health Care | 5.53 | 20 | -0.90% | -4.82% |
| DK | Delek US | | Energy | 30.10 | 36 | -1.31% | -4.84% |
| HASI | Hannon Armstrong | | Financials | 24.40 | 43 | 1.16% | -4.84% |
| SQSP | Squarespace | | Technology | 34.82 | 31 | -1.36% | -4.84% |
| IRON | Disc Medicine | | Health Care | 30.29 | 10 | 1.20% | -4.84% |
| BOOM | DMC Global | | Industrials | 16.68 | 7 | 0.12% | -4.85% |
| IIIN | Insteel Industries | | Materials | 32.75 | 0 | -1.24% | -4.85% |
| MTW | Manitowoc | | Industrials | 12.91 | 0 | -0.84% | -4.86% |
| B | Barnes Group | | Industrials | 33.39 | 36 | -1.59% | -4.87% |
| SUM | Summit Materials | | Industrials | 39.03 | 26 | -1.19% | -4.87% |
| AOSL | Alpha and | | Technology | 20.66 | 10 | -3.23% | -4.88% |
| COHU | Cohu | | Technology | 29.74 | 10 | -2.40% | -4.89% |
| OSUR | OraSure | | Health Care | 5.25 | 0 | 0.57% | -4.89% |
| NTGR | NETGEAR | | Technology | 13.96 | 5 | -0.64% | -4.90% |
| OBIO | Orchestra BioMed | | Health Care | 4.65 | 10 | -0.21% | -4.91% |
| CVI | CVR Energy | | Energy | 33.41 | 0 | -1.53% | -4.92% |
| XHR | Xenia Hotels | | Financials | 14.12 | 31 | -1.53% | -4.92% |
| FORR | Forrester Research | | Services & Goods | 18.53 | 10 | -0.64% | -4.93% |
| OUT | Outfront Media | | Services & Goods | 14.86 | 43 | -1.78% | -4.93% |
| ARR | ARMOUR Residential | | Financials | 17.51 | 7 | 0.86% | -4.94% |


| Too many stocks? View smallcap stocks filtered by marketcap & sector |
| Marketcap: All SmallCap Stocks (default-no microcap), Large, Mid-Range, Small |
| Smallcap Sector: Tech, Finance, Energy, Staples, Retail, Industrial, Materials, & Medical |
|
Get the most comprehensive stock market coverage daily at 12Stocks.com ➞ Best Stocks Today ➞ Best Stocks Weekly ➞ Best Stocks Year-to-Date ➞ Best Stocks Trends ➞  Best Stocks Today 12Stocks.com Best Nasdaq Stocks ➞ Best S&P 500 Stocks ➞ Best Tech Stocks ➞ Best Biotech Stocks ➞ |
| Detailed Overview of SmallCap Stocks |
| SmallCap Technical Overview, Leaders & Laggards, Top SmallCap ETF Funds & Detailed SmallCap Stocks List, Charts, Trends & More |
| Smallcap: Technical Analysis, Trends & YTD Performance | |
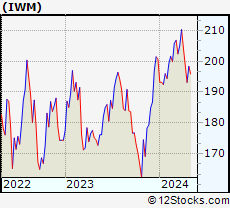
| SmallCap segment as represented by
IWM, an exchange-traded fund [ETF], holds basket of thousands of smallcap stocks from across all major sectors of the US stock market. The smallcap index (contains stocks like Riverbed & Sotheby's) is down by -3.84% and is currently underperforming the overall market by -8.25% year-to-date. Below is a quick view of technical charts and trends: | |
 IWM Weekly Chart |
|
| Long Term Trend: Good | |
| Medium Term Trend: Not Good | |
 IWM Daily Chart |
|
| Short Term Trend: Not Good | |
| Overall Trend Score: 13 | |
| YTD Performance: -3.84% | |
| **Trend Scores & Views Are Only For Educational Purposes And Not For Investing | |
| 12Stocks.com: Top Performing Small Cap Index Stocks | ||||||||||||||||||||||||||||||||||||||||||||||||
 The top performing Small Cap Index stocks year to date are
Now, more recently, over last week, the top performing Small Cap Index stocks on the move are


|
||||||||||||||||||||||||||||||||||||||||||||||||
| 12Stocks.com: Investing in Smallcap Index using Exchange Traded Funds | |
|
The following table shows list of key exchange traded funds (ETF) that
help investors track Smallcap index. The following list also includes leveraged ETF funds that track twice or thrice the daily returns of Smallcap indices. Short or inverse ETF funds move in the opposite direction to the index they track and are useful during market pullbacks or during bear markets. Quick View: Move mouse or cursor over ETF symbol (ticker) to view short-term technical chart and over ETF name to view long term chart. Click on ticker or stock name for detailed view. Click on to add stock symbol to your watchlist and to view watchlist. |
12Stocks.com List of ETFs that track Smallcap Index
| Ticker | ETF Name | Watchlist | Recent Price | Smart Investing & Trading Score | Change % | Week % | Year-to-date % |
| IWM | iShares Russell 2000 | | 193.00 | 13 | -1.06 | -2.86 | -3.84% |
| IJR | iShares Core S&P Small-Cap | | 102.13 | 17 | -0.58 | -2.28 | -5.65% |
| VTWO | Vanguard Russell 2000 ETF | | 78.05 | 36 | -1.04 | -2.83 | -3.76% |
| IWN | iShares Russell 2000 Value | | 146.03 | 23 | -0.77 | -2.89 | -5.99% |
| IWO | iShares Russell 2000 Growth | | 248.02 | 36 | -0.90 | -2.87 | -1.67% |
| IJS | iShares S&P Small-Cap 600 Value | | 94.12 | 17 | -0.57 | -2.13 | -8.68% |
| IJT | iShares S&P Small-Cap 600 Growth | | 121.84 | 41 | -1.02 | -2.36 | -2.64% |
| XSLV | PowerShares S&P SmallCap Low Volatil ETF | | 41.42 | 10 | -0.38 | -1.59 | -6.18% |
| SAA | ProShares Ultra SmallCap600 | | 21.66 | 0 | -1.19 | -3.99 | -13.19% |
| SMLV | SPDR SSGA US Small Cap Low Volatil ETF | | 103.66 | 10 | -0.17 | -1.29 | -7.87% |
| SBB | ProShares Short SmallCap600 | | 16.85 | 93 | 0.42 | 1.83 | 5.78% |
| SDD | ProShares UltraShort SmallCap600 | | 20.60 | 93 | 1.23 | 3.88 | 11.8% |
| 12Stocks.com: Charts, Trends, Fundamental Data and Performances of SmallCap Stocks | |
|
We now take in-depth look at all SmallCap stocks including charts, multi-period performances and overall trends (as measured by Smart Investing & Trading Score). One can sort SmallCap stocks (click link to choose) by Daily, Weekly and by Year-to-Date performances. Also, one can sort by size of the company or by market capitalization. |
| Select Your Default Chart Type: | |||||
| |||||
| Click on stock symbol or name for detailed view. Click on to add stock symbol to your watchlist and to view watchlist. Quick View: Move mouse or cursor over "Daily" to quickly view daily technical stock chart and over "Weekly" to view weekly technical stock chart. | |||||

 | VTYX Ventyx Biosciences, Inc. |
| Sector: Health Care | |
| SubSector: Biotechnology | |
| MarketCap: 1950 Millions | |
| Recent Price: 4.38 Smart Investing & Trading Score: 46 | |
| Day Percent Change: -7.98% Day Change: -0.38 | |
| Week Change: -4.78% Year-to-date Change: 77.0% | |
| VTYX Links: Profile News Message Board | |
| Charts:- Daily , Weekly | |
| Add VTYX to Watchlist: View: Get Complete VTYX Trend Analysis ➞ | |
 | RMBS Rambus Inc. |
| Sector: Technology | |
| SubSector: Semiconductor- Memory Chips | |
| MarketCap: 1296 Millions | |
| Recent Price: 57.25 Smart Investing & Trading Score: 0 | |
| Day Percent Change: -2.50% Day Change: -1.47 | |
| Week Change: -4.81% Year-to-date Change: -16.1% | |
| RMBS Links: Profile News Message Board | |
| Charts:- Daily , Weekly | |
| Add RMBS to Watchlist: View: Get Complete RMBS Trend Analysis ➞ | |
 | BCBP BCB Bancorp, Inc. |
| Sector: Financials | |
| SubSector: Regional - Northeast Banks | |
| MarketCap: 196.799 Millions | |
| Recent Price: 9.31 Smart Investing & Trading Score: 10 | |
| Day Percent Change: -2.62% Day Change: -0.25 | |
| Week Change: -4.81% Year-to-date Change: -27.6% | |
| BCBP Links: Profile News Message Board | |
| Charts:- Daily , Weekly | |
| Add BCBP to Watchlist: View: Get Complete BCBP Trend Analysis ➞ | |
 | HRTX Heron Therapeutics, Inc. |
| Sector: Health Care | |
| SubSector: Biotechnology | |
| MarketCap: 1172.75 Millions | |
| Recent Price: 2.77 Smart Investing & Trading Score: 38 | |
| Day Percent Change: -5.46% Day Change: -0.16 | |
| Week Change: -4.81% Year-to-date Change: 62.9% | |
| HRTX Links: Profile News Message Board | |
| Charts:- Daily , Weekly | |
| Add HRTX to Watchlist: View: Get Complete HRTX Trend Analysis ➞ | |
 | AMWD American Woodmark Corporation |
| Sector: Consumer Staples | |
| SubSector: Home Furnishings & Fixtures | |
| MarketCap: 958.435 Millions | |
| Recent Price: 91.39 Smart Investing & Trading Score: 13 | |
| Day Percent Change: -1.20% Day Change: -1.11 | |
| Week Change: -4.82% Year-to-date Change: -1.6% | |
| AMWD Links: Profile News Message Board | |
| Charts:- Daily , Weekly | |
| Add AMWD to Watchlist: View: Get Complete AMWD Trend Analysis ➞ | |
 | CLPT ClearPoint Neuro, Inc. |
| Sector: Health Care | |
| SubSector: Medical Appliances & Equipment | |
| MarketCap: 55.108 Millions | |
| Recent Price: 5.53 Smart Investing & Trading Score: 20 | |
| Day Percent Change: -0.90% Day Change: -0.05 | |
| Week Change: -4.82% Year-to-date Change: -18.9% | |
| CLPT Links: Profile News Message Board | |
| Charts:- Daily , Weekly | |
| Add CLPT to Watchlist: View: Get Complete CLPT Trend Analysis ➞ | |
 | DK Delek US Holdings, Inc. |
| Sector: Energy | |
| SubSector: Oil & Gas Refining & Marketing | |
| MarketCap: 1328.54 Millions | |
| Recent Price: 30.10 Smart Investing & Trading Score: 36 | |
| Day Percent Change: -1.31% Day Change: -0.40 | |
| Week Change: -4.84% Year-to-date Change: 16.7% | |
| DK Links: Profile News Message Board | |
| Charts:- Daily , Weekly | |
| Add DK to Watchlist: View: Get Complete DK Trend Analysis ➞ | |
 | HASI Hannon Armstrong Sustainable Infrastructure Capital, Inc. |
| Sector: Financials | |
| SubSector: REIT - Diversified | |
| MarketCap: 1405.93 Millions | |
| Recent Price: 24.40 Smart Investing & Trading Score: 43 | |
| Day Percent Change: 1.16% Day Change: 0.28 | |
| Week Change: -4.84% Year-to-date Change: -11.5% | |
| HASI Links: Profile News Message Board | |
| Charts:- Daily , Weekly | |
| Add HASI to Watchlist: View: Get Complete HASI Trend Analysis ➞ | |
 | SQSP Squarespace, Inc. |
| Sector: Technology | |
| SubSector: Software - Infrastructure | |
| MarketCap: 4150 Millions | |
| Recent Price: 34.82 Smart Investing & Trading Score: 31 | |
| Day Percent Change: -1.36% Day Change: -0.48 | |
| Week Change: -4.84% Year-to-date Change: 4.9% | |
| SQSP Links: Profile News Message Board | |
| Charts:- Daily , Weekly | |
| Add SQSP to Watchlist: View: Get Complete SQSP Trend Analysis ➞ | |
 | IRON Disc Medicine Opco Inc |
| Sector: Health Care | |
| SubSector: Biotechnology | |
| MarketCap: 1100 Millions | |
| Recent Price: 30.29 Smart Investing & Trading Score: 10 | |
| Day Percent Change: 1.20% Day Change: 0.36 | |
| Week Change: -4.84% Year-to-date Change: -47.8% | |
| IRON Links: Profile News Message Board | |
| Charts:- Daily , Weekly | |
| Add IRON to Watchlist: View: Get Complete IRON Trend Analysis ➞ | |
 | BOOM DMC Global Inc. |
| Sector: Industrials | |
| SubSector: Metal Fabrication | |
| MarketCap: 359.15 Millions | |
| Recent Price: 16.68 Smart Investing & Trading Score: 7 | |
| Day Percent Change: 0.12% Day Change: 0.02 | |
| Week Change: -4.85% Year-to-date Change: -11.4% | |
| BOOM Links: Profile News Message Board | |
| Charts:- Daily , Weekly | |
| Add BOOM to Watchlist: View: Get Complete BOOM Trend Analysis ➞ | |
 | IIIN Insteel Industries, Inc. |
| Sector: Materials | |
| SubSector: Steel & Iron | |
| MarketCap: 269.488 Millions | |
| Recent Price: 32.75 Smart Investing & Trading Score: 0 | |
| Day Percent Change: -1.24% Day Change: -0.41 | |
| Week Change: -4.85% Year-to-date Change: -14.5% | |
| IIIN Links: Profile News Message Board | |
| Charts:- Daily , Weekly | |
| Add IIIN to Watchlist: View: Get Complete IIIN Trend Analysis ➞ | |
 | MTW The Manitowoc Company, Inc. |
| Sector: Industrials | |
| SubSector: Farm & Construction Machinery | |
| MarketCap: 373.707 Millions | |
| Recent Price: 12.91 Smart Investing & Trading Score: 0 | |
| Day Percent Change: -0.84% Day Change: -0.11 | |
| Week Change: -4.86% Year-to-date Change: -22.7% | |
| MTW Links: Profile News Message Board | |
| Charts:- Daily , Weekly | |
| Add MTW to Watchlist: View: Get Complete MTW Trend Analysis ➞ | |
 | B Barnes Group Inc. |
| Sector: Industrials | |
| SubSector: Industrial Equipment & Components | |
| MarketCap: 2189.79 Millions | |
| Recent Price: 33.39 Smart Investing & Trading Score: 36 | |
| Day Percent Change: -1.59% Day Change: -0.54 | |
| Week Change: -4.87% Year-to-date Change: 2.3% | |
| B Links: Profile News Message Board | |
| Charts:- Daily , Weekly | |
| Add B to Watchlist: View: Get Complete B Trend Analysis ➞ | |
 | SUM Summit Materials, Inc. |
| Sector: Industrials | |
| SubSector: General Building Materials | |
| MarketCap: 1138.23 Millions | |
| Recent Price: 39.03 Smart Investing & Trading Score: 26 | |
| Day Percent Change: -1.19% Day Change: -0.47 | |
| Week Change: -4.87% Year-to-date Change: 1.5% | |
| SUM Links: Profile News Message Board | |
| Charts:- Daily , Weekly | |
| Add SUM to Watchlist: View: Get Complete SUM Trend Analysis ➞ | |
 | AOSL Alpha and Omega Semiconductor Limited |
| Sector: Technology | |
| SubSector: Semiconductor - Specialized | |
| MarketCap: 158.66 Millions | |
| Recent Price: 20.66 Smart Investing & Trading Score: 10 | |
| Day Percent Change: -3.23% Day Change: -0.69 | |
| Week Change: -4.88% Year-to-date Change: -20.7% | |
| AOSL Links: Profile News Message Board | |
| Charts:- Daily , Weekly | |
| Add AOSL to Watchlist: View: Get Complete AOSL Trend Analysis ➞ | |
 | COHU Cohu, Inc. |
| Sector: Technology | |
| SubSector: Semiconductor Equipment & Materials | |
| MarketCap: 519.518 Millions | |
| Recent Price: 29.74 Smart Investing & Trading Score: 10 | |
| Day Percent Change: -2.40% Day Change: -0.73 | |
| Week Change: -4.89% Year-to-date Change: -16.0% | |
| COHU Links: Profile News Message Board | |
| Charts:- Daily , Weekly | |
| Add COHU to Watchlist: View: Get Complete COHU Trend Analysis ➞ | |
 | OSUR OraSure Technologies, Inc. |
| Sector: Health Care | |
| SubSector: Medical Instruments & Supplies | |
| MarketCap: 468.26 Millions | |
| Recent Price: 5.25 Smart Investing & Trading Score: 0 | |
| Day Percent Change: 0.57% Day Change: 0.03 | |
| Week Change: -4.89% Year-to-date Change: -36.0% | |
| OSUR Links: Profile News Message Board | |
| Charts:- Daily , Weekly | |
| Add OSUR to Watchlist: View: Get Complete OSUR Trend Analysis ➞ | |
 | NTGR NETGEAR, Inc. |
| Sector: Technology | |
| SubSector: Communication Equipment | |
| MarketCap: 558.839 Millions | |
| Recent Price: 13.96 Smart Investing & Trading Score: 5 | |
| Day Percent Change: -0.64% Day Change: -0.09 | |
| Week Change: -4.9% Year-to-date Change: -4.3% | |
| NTGR Links: Profile News Message Board | |
| Charts:- Daily , Weekly | |
| Add NTGR to Watchlist: View: Get Complete NTGR Trend Analysis ➞ | |
 | OBIO Orchestra BioMed Holdings, Inc. |
| Sector: Health Care | |
| SubSector: Biotechnology | |
| MarketCap: 271 Millions | |
| Recent Price: 4.65 Smart Investing & Trading Score: 10 | |
| Day Percent Change: -0.21% Day Change: -0.01 | |
| Week Change: -4.91% Year-to-date Change: -49.0% | |
| OBIO Links: Profile News Message Board | |
| Charts:- Daily , Weekly | |
| Add OBIO to Watchlist: View: Get Complete OBIO Trend Analysis ➞ | |
 | CVI CVR Energy, Inc. |
| Sector: Energy | |
| SubSector: Oil & Gas Refining & Marketing | |
| MarketCap: 2482.14 Millions | |
| Recent Price: 33.41 Smart Investing & Trading Score: 0 | |
| Day Percent Change: -1.53% Day Change: -0.52 | |
| Week Change: -4.92% Year-to-date Change: 10.3% | |
| CVI Links: Profile News Message Board | |
| Charts:- Daily , Weekly | |
| Add CVI to Watchlist: View: Get Complete CVI Trend Analysis ➞ | |
 | XHR Xenia Hotels & Resorts, Inc. |
| Sector: Financials | |
| SubSector: REIT - Hotel/Motel | |
| MarketCap: 1058.24 Millions | |
| Recent Price: 14.12 Smart Investing & Trading Score: 31 | |
| Day Percent Change: -1.53% Day Change: -0.22 | |
| Week Change: -4.92% Year-to-date Change: 3.7% | |
| XHR Links: Profile News Message Board | |
| Charts:- Daily , Weekly | |
| Add XHR to Watchlist: View: Get Complete XHR Trend Analysis ➞ | |
 | FORR Forrester Research, Inc. |
| Sector: Services & Goods | |
| SubSector: Research Services | |
| MarketCap: 473.394 Millions | |
| Recent Price: 18.53 Smart Investing & Trading Score: 10 | |
| Day Percent Change: -0.64% Day Change: -0.12 | |
| Week Change: -4.93% Year-to-date Change: -30.9% | |
| FORR Links: Profile News Message Board | |
| Charts:- Daily , Weekly | |
| Add FORR to Watchlist: View: Get Complete FORR Trend Analysis ➞ | |
 | OUT Outfront Media Inc. |
| Sector: Services & Goods | |
| SubSector: Marketing Services | |
| MarketCap: 1388.15 Millions | |
| Recent Price: 14.86 Smart Investing & Trading Score: 43 | |
| Day Percent Change: -1.78% Day Change: -0.27 | |
| Week Change: -4.93% Year-to-date Change: 6.5% | |
| OUT Links: Profile News Message Board | |
| Charts:- Daily , Weekly | |
| Add OUT to Watchlist: View: Get Complete OUT Trend Analysis ➞ | |
 | ARR ARMOUR Residential REIT, Inc. |
| Sector: Financials | |
| SubSector: Mortgage Investment | |
| MarketCap: 578.739 Millions | |
| Recent Price: 17.51 Smart Investing & Trading Score: 7 | |
| Day Percent Change: 0.86% Day Change: 0.15 | |
| Week Change: -4.94% Year-to-date Change: -9.4% | |
| ARR Links: Profile News Message Board | |
| Charts:- Daily , Weekly | |
| Add ARR to Watchlist: View: Get Complete ARR Trend Analysis ➞ | |
| Too many stocks? View smallcap stocks filtered by marketcap & sector |
| Marketcap: All SmallCap Stocks (default-no microcap), Large, Mid-Range, Small & MicroCap |
| Sector: Tech, Finance, Energy, Staples, Retail, Industrial, Materials, Utilities & Medical |
|
Best Stocks Today 12Stocks.com |
© 2024 12Stocks.com Terms & Conditions Privacy Contact Us
All Information Provided Only For Education And Not To Be Used For Investing or Trading. See Terms & Conditions


One More Thing ... Get Best Stocks Delivered Daily!
Never Ever Miss A Move With Our Top Ten Stocks Lists
Find Best Stocks In Any Market - Bull or Bear Market
Take A Peek At Our Top Ten Stocks Lists: Daily, Weekly, Year-to-Date & Top Trends
Find Best Stocks In Any Market - Bull or Bear Market
Take A Peek At Our Top Ten Stocks Lists: Daily, Weekly, Year-to-Date & Top Trends
Smallcap Stocks With Best Up Trends [0-bearish to 100-bullish]: Vanda [100], Zuora [100], ALX Oncology[100], ProKidney [100], IMAX [100], Envestnet [100], Intra-Cellular Therapies[100], Dorian LPG[95], Victory Capital[95], Oscar Health[95], Reneo [93]
Best Smallcap Stocks Year-to-Date:
Agenus [552.25%], CareMax [416.49%], Janux [346.07%], Viking [257.17%], Alpine Immune[238.55%], Super Micro[237.75%], Arcutis Bio[217.34%], Longboard [177.91%], Avidity Biosciences[160.56%], Vera [158.46%], Stoke [122.81%] Best Smallcap Stocks This Week:
ProKidney [61.71%], Macatawa Bank[42.75%], Snap One[29.85%], Vanda [27.18%], ALX Oncology[23.41%], Intra-Cellular Therapies[16.41%], Escalade [13.71%], Karyopharm [13.11%], Encore Wire[10.06%], Zuora [10%], Direxion Daily[8.81%] Best Smallcap Stocks Daily:
Vanda [29.38%], Karyopharm [25.45%], Cutera [18.41%], Children s[16.46%], WW [14.10%], Lineage Cell[12.17%], Zuora [11.69%], ALX Oncology[10.97%], Marinus [10.77%], Acrivon [9.19%], Cue Biopharma[9.03%]