
 Login Sign Up


| |||||
 |  | ||||

| 12Stocks.com Market Intelligence |
Best SmallCap Stocks
|
| In a hurry? Small Cap Stock Lists: Performance Trends Table, Stock Charts
Sort Small Cap stocks: Daily, Weekly, Year-to-Date, Market Cap & Trends. Filter Small Cap stocks list by sector: Show all, Tech, Finance, Energy, Staples, Retail, Industrial, Materials, Utilities and HealthCare Filter Small Cap stocks list by size: All Large Medium Small and MicroCap |
| 12Stocks.com Small Cap Stocks Performances & Trends Daily | |||||||||
|
|  The overall Smart Investing & Trading Score is 44 (0-bearish to 100-bullish) which puts Small Cap index in short term neutral trend. The Smart Investing & Trading Score from previous trading session is 58 and hence a deterioration of trend.
| ||||||||
Here are the Smart Investing & Trading Scores of the most requested small cap stocks at 12Stocks.com (click stock name for detailed review):
|


| 12Stocks.com: Investing in Smallcap Index with Stocks | |
|
The following table helps investors and traders sort through current performance and trends (as measured by Smart Investing & Trading Score) of various
stocks in the Smallcap Index. Quick View: Move mouse or cursor over stock symbol (ticker) to view short-term technical chart and over stock name to view long term chart. Click on  to add stock symbol to your watchlist and to add stock symbol to your watchlist and  to view watchlist. Click on any ticker or stock name for detailed market intelligence report for that stock. to view watchlist. Click on any ticker or stock name for detailed market intelligence report for that stock. |
12Stocks.com Performance of Stocks in Smallcap Index
| Ticker | Stock Name | Watchlist | Category | Recent Price | Smart Investing & Trading Score | Change % | Weekly Change% |
| GRC | Gorman-Rupp |   | Industrials | 33.38 | 56 | 6.14% | -7.33% |
| ARCB | ArcBest | | Transports | 127.67 | 39 | -7.54% | -7.51% |
| UUUU | Energy Fuels | | Materials | 5.40 | 17 | 0.75% | -7.53% |
| VERV | Verve | | Health Care | 6.14 | 25 | -1.29% | -7.53% |
| ONEW | OneWater Marine | | Services & Goods | 21.97 | 28 | 3.41% | -7.83% |
| SKWD | Skyward Specialty | | Financials | 33.39 | 56 | -7.15% | -7.86% |
| ISPR | Ispire | | Consumer Staples | 5.10 | 17 | 0.20% | -7.94% |
| FDMT | 4D Molecular | | Health Care | 23.23 | 36 | -1.30% | -8.02% |
| SNCY | Sun Country | | Industrials | 13.66 | 51 | -3.46% | -8.14% |
| SVRA | Savara | | Health Care | 4.42 | 0 | 4.25% | -8.21% |
| ALGT | Allegiant Travel | | Transports | 57.12 | 0 | -1.50% | -8.33% |
| CELC | Celcuity | | Health Care | 15.73 | 46 | -3.02% | -8.65% |
| CFFN | Capitol Federal | | Financials | 4.82 | 10 | -2.82% | -8.71% |
| CATO | Cato | | Services & Goods | 4.60 | 22 | -3.56% | -8.73% |
| SHEN | Shenandoah Tele | | Technology | 13.39 | 27 | -4.01% | -8.85% |
| HELE | Helen of Troy | | Consumer Staples | 91.14 | 0 | 0.32% | -8.86% |
| NKTX | Nkarta | | Health Care | 6.83 | 10 | 2.71% | -8.93% |
| MDGL | Madrigal | | Health Care | 193.31 | 23 | -0.55% | -8.96% |
| KPTI | Karyopharm | | Health Care | 1.06 | 46 | 0.47% | -8.97% |
| HCSG | Healthcare Services | | Services & Goods | 10.86 | 36 | -1.27% | -9.05% |
| TCI | Transcontinental Realty | | Financials | 28.96 | 10 | -0.82% | -9.10% |
| OCUL | Ocular Therapeutix | | Health Care | 4.74 | 10 | 12.86% | -9.20% |
| ETNB | 89bio | | Health Care | 8.24 | 10 | -0.18% | -9.25% |
| AVXL | Anavex Life | | Health Care | 3.43 | 0 | 1.18% | -9.26% |
| CDNA | CareDx | | Services & Goods | 7.54 | 15 | -0.26% | -9.27% |


| Too many stocks? View smallcap stocks filtered by marketcap & sector |
| Marketcap: All SmallCap Stocks (default-no microcap), Large, Mid-Range, Small |
| Smallcap Sector: Tech, Finance, Energy, Staples, Retail, Industrial, Materials, & Medical |
|
Get the most comprehensive stock market coverage daily at 12Stocks.com ➞ Best Stocks Today ➞ Best Stocks Weekly ➞ Best Stocks Year-to-Date ➞ Best Stocks Trends ➞  Best Stocks Today 12Stocks.com Best Nasdaq Stocks ➞ Best S&P 500 Stocks ➞ Best Tech Stocks ➞ Best Biotech Stocks ➞ |
| Detailed Overview of SmallCap Stocks |
| SmallCap Technical Overview, Leaders & Laggards, Top SmallCap ETF Funds & Detailed SmallCap Stocks List, Charts, Trends & More |
| Smallcap: Technical Analysis, Trends & YTD Performance | |
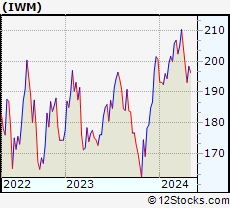
| SmallCap segment as represented by
IWM, an exchange-traded fund [ETF], holds basket of thousands of smallcap stocks from across all major sectors of the US stock market. The smallcap index (contains stocks like Riverbed & Sotheby's) is down by -1.16% and is currently underperforming the overall market by -7.3% year-to-date. Below is a quick view of technical charts and trends: | |
 IWM Weekly Chart |
|
| Long Term Trend: Good | |
| Medium Term Trend: Not Good | |
 IWM Daily Chart |
|
| Short Term Trend: Very Good | |
| Overall Trend Score: 44 | |
| YTD Performance: -1.16% | |
| **Trend Scores & Views Are Only For Educational Purposes And Not For Investing | |
| 12Stocks.com: Top Performing Small Cap Index Stocks | ||||||||||||||||||||||||||||||||||||||||||||||||
 The top performing Small Cap Index stocks year to date are
Now, more recently, over last week, the top performing Small Cap Index stocks on the move are


|
||||||||||||||||||||||||||||||||||||||||||||||||
| 12Stocks.com: Investing in Smallcap Index using Exchange Traded Funds | |
|
The following table shows list of key exchange traded funds (ETF) that
help investors track Smallcap index. The following list also includes leveraged ETF funds that track twice or thrice the daily returns of Smallcap indices. Short or inverse ETF funds move in the opposite direction to the index they track and are useful during market pullbacks or during bear markets. Quick View: Move mouse or cursor over ETF symbol (ticker) to view short-term technical chart and over ETF name to view long term chart. Click on ticker or stock name for detailed view. Click on to add stock symbol to your watchlist and to view watchlist. |
12Stocks.com List of ETFs that track Smallcap Index
| Ticker | ETF Name | Watchlist | Recent Price | Smart Investing & Trading Score | Change % | Week % | Year-to-date % |
| IWM | iShares Russell 2000 | | 198.39 | 44 | 0.97 | 2.72 | -1.16% |
| IJR | iShares Core S&P Small-Cap | | 105.65 | 78 | 0.75 | 2.35 | -2.4% |
| VTWO | Vanguard Russell 2000 ETF | | 80.28 | 63 | 1.04 | 2.82 | -1.01% |
| IWN | iShares Russell 2000 Value | | 151.14 | 68 | 0.64 | 2.27 | -2.7% |
| IWO | iShares Russell 2000 Growth | | 253.09 | 51 | 1.29 | 3.18 | 0.34% |
| IJS | iShares S&P Small-Cap 600 Value | | 97.19 | 60 | 0.52 | 1.65 | -5.7% |
| IJT | iShares S&P Small-Cap 600 Growth | | 126.16 | 63 | 0.88 | 3.23 | 0.82% |
| XSLV | PowerShares S&P SmallCap Low Volatil ETF | | 42.72 | 73 | 0.42 | 1.28 | -3.24% |
| SAA | ProShares Ultra SmallCap600 | | 23.04 | 58 | 1.65 | 5.67 | -7.68% |
| SBB | ProShares Short SmallCap600 | | 16.39 | 40 | -0.70 | -2.7 | 2.86% |
| SDD | ProShares UltraShort SmallCap600 | | 19.35 | 42 | -1.17 | -4.87 | 5.01% |
| SMLV | SPDR SSGA US Small Cap Low Volatil ETF | | 107.52 | 73 | 0.18 | 1.35 | -4.44% |
| 12Stocks.com: Charts, Trends, Fundamental Data and Performances of SmallCap Stocks | |
|
We now take in-depth look at all SmallCap stocks including charts, multi-period performances and overall trends (as measured by Smart Investing & Trading Score). One can sort SmallCap stocks (click link to choose) by Daily, Weekly and by Year-to-Date performances. Also, one can sort by size of the company or by market capitalization. |
| Select Your Default Chart Type: | |||||
| |||||
| Click on stock symbol or name for detailed view. Click on to add stock symbol to your watchlist and to view watchlist. Quick View: Move mouse or cursor over "Daily" to quickly view daily technical stock chart and over "Weekly" to view weekly technical stock chart. | |||||

 | GRC The Gorman-Rupp Company |
| Sector: Industrials | |
| SubSector: Diversified Machinery | |
| MarketCap: 729.616 Millions | |
| Recent Price: 33.38 Smart Investing & Trading Score: 56 | |
| Day Percent Change: 6.14% Day Change: 1.93 | |
| Week Change: -7.33% Year-to-date Change: -6.1% | |
| GRC Links: Profile News Message Board | |
| Charts:- Daily , Weekly | |
| Add GRC to Watchlist: View: Get Complete GRC Trend Analysis ➞ | |
 | ARCB ArcBest Corporation |
| Sector: Transports | |
| SubSector: Trucking | |
| MarketCap: 515.415 Millions | |
| Recent Price: 127.67 Smart Investing & Trading Score: 39 | |
| Day Percent Change: -7.54% Day Change: -10.41 | |
| Week Change: -7.51% Year-to-date Change: 6.2% | |
| ARCB Links: Profile News Message Board | |
| Charts:- Daily , Weekly | |
| Add ARCB to Watchlist: View: Get Complete ARCB Trend Analysis ➞ | |
 | UUUU Energy Fuels Inc. |
| Sector: Materials | |
| SubSector: Industrial Metals & Minerals | |
| MarketCap: 107.61 Millions | |
| Recent Price: 5.40 Smart Investing & Trading Score: 17 | |
| Day Percent Change: 0.75% Day Change: 0.04 | |
| Week Change: -7.53% Year-to-date Change: -24.9% | |
| UUUU Links: Profile News Message Board | |
| Charts:- Daily , Weekly | |
| Add UUUU to Watchlist: View: Get Complete UUUU Trend Analysis ➞ | |
 | VERV Verve Therapeutics, Inc. |
| Sector: Health Care | |
| SubSector: Biotechnology | |
| MarketCap: 1200 Millions | |
| Recent Price: 6.14 Smart Investing & Trading Score: 25 | |
| Day Percent Change: -1.29% Day Change: -0.08 | |
| Week Change: -7.53% Year-to-date Change: -56.0% | |
| VERV Links: Profile News Message Board | |
| Charts:- Daily , Weekly | |
| Add VERV to Watchlist: View: Get Complete VERV Trend Analysis ➞ | |
 | ONEW OneWater Marine Inc. |
| Sector: Services & Goods | |
| SubSector: Recreational Vehicles | |
| MarketCap: 42027 Millions | |
| Recent Price: 21.97 Smart Investing & Trading Score: 28 | |
| Day Percent Change: 3.41% Day Change: 0.73 | |
| Week Change: -7.83% Year-to-date Change: -35.0% | |
| ONEW Links: Profile News Message Board | |
| Charts:- Daily , Weekly | |
| Add ONEW to Watchlist: View: Get Complete ONEW Trend Analysis ➞ | |
 | SKWD Skyward Specialty Insurance Group, Inc. |
| Sector: Financials | |
| SubSector: Insurance - Property & Casualty | |
| MarketCap: 936 Millions | |
| Recent Price: 33.39 Smart Investing & Trading Score: 56 | |
| Day Percent Change: -7.15% Day Change: -2.57 | |
| Week Change: -7.86% Year-to-date Change: -1.7% | |
| SKWD Links: Profile News Message Board | |
| Charts:- Daily , Weekly | |
| Add SKWD to Watchlist: View: Get Complete SKWD Trend Analysis ➞ | |
 | ISPR Ispire Technology Inc. |
| Sector: Consumer Staples | |
| SubSector: Tobacco | |
| MarketCap: 447 Millions | |
| Recent Price: 5.10 Smart Investing & Trading Score: 17 | |
| Day Percent Change: 0.20% Day Change: 0.01 | |
| Week Change: -7.94% Year-to-date Change: -58.2% | |
| ISPR Links: Profile News Message Board | |
| Charts:- Daily , Weekly | |
| Add ISPR to Watchlist: View: Get Complete ISPR Trend Analysis ➞ | |
 | FDMT 4D Molecular Therapeutics, Inc. |
| Sector: Health Care | |
| SubSector: Biotechnology | |
| MarketCap: 772 Millions | |
| Recent Price: 23.23 Smart Investing & Trading Score: 36 | |
| Day Percent Change: -1.30% Day Change: -0.30 | |
| Week Change: -8.02% Year-to-date Change: 12.2% | |
| FDMT Links: Profile News Message Board | |
| Charts:- Daily , Weekly | |
| Add FDMT to Watchlist: View: Get Complete FDMT Trend Analysis ➞ | |
 | SNCY Sun Country Airlines Holdings, Inc. |
| Sector: Industrials | |
| SubSector: Airlines | |
| MarketCap: 1230 Millions | |
| Recent Price: 13.66 Smart Investing & Trading Score: 51 | |
| Day Percent Change: -3.46% Day Change: -0.49 | |
| Week Change: -8.14% Year-to-date Change: -13.6% | |
| SNCY Links: Profile News Message Board | |
| Charts:- Daily , Weekly | |
| Add SNCY to Watchlist: View: Get Complete SNCY Trend Analysis ➞ | |
 | SVRA Savara Inc. |
| Sector: Health Care | |
| SubSector: Biotechnology | |
| MarketCap: 80.3785 Millions | |
| Recent Price: 4.42 Smart Investing & Trading Score: 0 | |
| Day Percent Change: 4.25% Day Change: 0.18 | |
| Week Change: -8.21% Year-to-date Change: -6.1% | |
| SVRA Links: Profile News Message Board | |
| Charts:- Daily , Weekly | |
| Add SVRA to Watchlist: View: Get Complete SVRA Trend Analysis ➞ | |
 | ALGT Allegiant Travel Company |
| Sector: Transports | |
| SubSector: Regional Airlines | |
| MarketCap: 1317.7 Millions | |
| Recent Price: 57.12 Smart Investing & Trading Score: 0 | |
| Day Percent Change: -1.50% Day Change: -0.87 | |
| Week Change: -8.33% Year-to-date Change: -30.9% | |
| ALGT Links: Profile News Message Board | |
| Charts:- Daily , Weekly | |
| Add ALGT to Watchlist: View: Get Complete ALGT Trend Analysis ➞ | |
 | CELC Celcuity Inc. |
| Sector: Health Care | |
| SubSector: Medical Laboratories & Research | |
| MarketCap: 70.53 Millions | |
| Recent Price: 15.73 Smart Investing & Trading Score: 46 | |
| Day Percent Change: -3.02% Day Change: -0.49 | |
| Week Change: -8.65% Year-to-date Change: 7.3% | |
| CELC Links: Profile News Message Board | |
| Charts:- Daily , Weekly | |
| Add CELC to Watchlist: View: Get Complete CELC Trend Analysis ➞ | |
 | CFFN Capitol Federal Financial, Inc. |
| Sector: Financials | |
| SubSector: Savings & Loans | |
| MarketCap: 1639.1 Millions | |
| Recent Price: 4.82 Smart Investing & Trading Score: 10 | |
| Day Percent Change: -2.82% Day Change: -0.14 | |
| Week Change: -8.71% Year-to-date Change: -25.3% | |
| CFFN Links: Profile News Message Board | |
| Charts:- Daily , Weekly | |
| Add CFFN to Watchlist: View: Get Complete CFFN Trend Analysis ➞ | |
 | CATO The Cato Corporation |
| Sector: Services & Goods | |
| SubSector: Apparel Stores | |
| MarketCap: 305.208 Millions | |
| Recent Price: 4.60 Smart Investing & Trading Score: 22 | |
| Day Percent Change: -3.56% Day Change: -0.17 | |
| Week Change: -8.73% Year-to-date Change: -35.6% | |
| CATO Links: Profile News Message Board | |
| Charts:- Daily , Weekly | |
| Add CATO to Watchlist: View: Get Complete CATO Trend Analysis ➞ | |
 | SHEN Shenandoah Telecommunications Company |
| Sector: Technology | |
| SubSector: Telecom Services - Domestic | |
| MarketCap: 2329.67 Millions | |
| Recent Price: 13.39 Smart Investing & Trading Score: 27 | |
| Day Percent Change: -4.01% Day Change: -0.56 | |
| Week Change: -8.85% Year-to-date Change: -38.1% | |
| SHEN Links: Profile News Message Board | |
| Charts:- Daily , Weekly | |
| Add SHEN to Watchlist: View: Get Complete SHEN Trend Analysis ➞ | |
 | HELE Helen of Troy Limited |
| Sector: Consumer Staples | |
| SubSector: Housewares & Accessories | |
| MarketCap: 3199.53 Millions | |
| Recent Price: 91.14 Smart Investing & Trading Score: 0 | |
| Day Percent Change: 0.32% Day Change: 0.29 | |
| Week Change: -8.86% Year-to-date Change: -24.6% | |
| HELE Links: Profile News Message Board | |
| Charts:- Daily , Weekly | |
| Add HELE to Watchlist: View: Get Complete HELE Trend Analysis ➞ | |
 | NKTX Nkarta, Inc. |
| Sector: Health Care | |
| SubSector: Biotechnology | |
| MarketCap: 23487 Millions | |
| Recent Price: 6.83 Smart Investing & Trading Score: 10 | |
| Day Percent Change: 2.71% Day Change: 0.18 | |
| Week Change: -8.93% Year-to-date Change: 3.6% | |
| NKTX Links: Profile News Message Board | |
| Charts:- Daily , Weekly | |
| Add NKTX to Watchlist: View: Get Complete NKTX Trend Analysis ➞ | |
 | MDGL Madrigal Pharmaceuticals, Inc. |
| Sector: Health Care | |
| SubSector: Biotechnology | |
| MarketCap: 1104.35 Millions | |
| Recent Price: 193.31 Smart Investing & Trading Score: 23 | |
| Day Percent Change: -0.55% Day Change: -1.07 | |
| Week Change: -8.96% Year-to-date Change: -16.5% | |
| MDGL Links: Profile News Message Board | |
| Charts:- Daily , Weekly | |
| Add MDGL to Watchlist: View: Get Complete MDGL Trend Analysis ➞ | |
 | KPTI Karyopharm Therapeutics Inc. |
| Sector: Health Care | |
| SubSector: Biotechnology | |
| MarketCap: 1471.85 Millions | |
| Recent Price: 1.06 Smart Investing & Trading Score: 46 | |
| Day Percent Change: 0.47% Day Change: 0.00 | |
| Week Change: -8.97% Year-to-date Change: 23.1% | |
| KPTI Links: Profile News Message Board | |
| Charts:- Daily , Weekly | |
| Add KPTI to Watchlist: View: Get Complete KPTI Trend Analysis ➞ | |
 | HCSG Healthcare Services Group, Inc. |
| Sector: Services & Goods | |
| SubSector: Business Services | |
| MarketCap: 1758.32 Millions | |
| Recent Price: 10.86 Smart Investing & Trading Score: 36 | |
| Day Percent Change: -1.27% Day Change: -0.14 | |
| Week Change: -9.05% Year-to-date Change: 4.7% | |
| HCSG Links: Profile News Message Board | |
| Charts:- Daily , Weekly | |
| Add HCSG to Watchlist: View: Get Complete HCSG Trend Analysis ➞ | |
 | TCI Transcontinental Realty Investors, Inc. |
| Sector: Financials | |
| SubSector: REIT - Diversified | |
| MarketCap: 158.653 Millions | |
| Recent Price: 28.96 Smart Investing & Trading Score: 10 | |
| Day Percent Change: -0.82% Day Change: -0.24 | |
| Week Change: -9.1% Year-to-date Change: -16.2% | |
| TCI Links: Profile News Message Board | |
| Charts:- Daily , Weekly | |
| Add TCI to Watchlist: View: Get Complete TCI Trend Analysis ➞ | |
 | OCUL Ocular Therapeutix, Inc. |
| Sector: Health Care | |
| SubSector: Biotechnology | |
| MarketCap: 249.985 Millions | |
| Recent Price: 4.74 Smart Investing & Trading Score: 10 | |
| Day Percent Change: 12.86% Day Change: 0.54 | |
| Week Change: -9.2% Year-to-date Change: 6.3% | |
| OCUL Links: Profile News Message Board | |
| Charts:- Daily , Weekly | |
| Add OCUL to Watchlist: View: Get Complete OCUL Trend Analysis ➞ | |
 | ETNB 89bio, Inc. |
| Sector: Health Care | |
| SubSector: Biotechnology | |
| MarketCap: 517.485 Millions | |
| Recent Price: 8.24 Smart Investing & Trading Score: 10 | |
| Day Percent Change: -0.18% Day Change: -0.02 | |
| Week Change: -9.25% Year-to-date Change: -26.2% | |
| ETNB Links: Profile News Message Board | |
| Charts:- Daily , Weekly | |
| Add ETNB to Watchlist: View: Get Complete ETNB Trend Analysis ➞ | |
 | AVXL Anavex Life Sciences Corp. |
| Sector: Health Care | |
| SubSector: Biotechnology | |
| MarketCap: 175.985 Millions | |
| Recent Price: 3.43 Smart Investing & Trading Score: 0 | |
| Day Percent Change: 1.18% Day Change: 0.04 | |
| Week Change: -9.26% Year-to-date Change: -63.2% | |
| AVXL Links: Profile News Message Board | |
| Charts:- Daily , Weekly | |
| Add AVXL to Watchlist: View: Get Complete AVXL Trend Analysis ➞ | |
 | CDNA CareDx, Inc |
| Sector: Services & Goods | |
| SubSector: Research Services | |
| MarketCap: 828.194 Millions | |
| Recent Price: 7.54 Smart Investing & Trading Score: 15 | |
| Day Percent Change: -0.26% Day Change: -0.02 | |
| Week Change: -9.27% Year-to-date Change: -37.2% | |
| CDNA Links: Profile News Message Board | |
| Charts:- Daily , Weekly | |
| Add CDNA to Watchlist: View: Get Complete CDNA Trend Analysis ➞ | |
| Too many stocks? View smallcap stocks filtered by marketcap & sector |
| Marketcap: All SmallCap Stocks (default-no microcap), Large, Mid-Range, Small & MicroCap |
| Sector: Tech, Finance, Energy, Staples, Retail, Industrial, Materials, Utilities & Medical |
|
Best Stocks Today 12Stocks.com |
© 2024 12Stocks.com Terms & Conditions Privacy Contact Us
All Information Provided Only For Education And Not To Be Used For Investing or Trading. See Terms & Conditions


One More Thing ... Get Best Stocks Delivered Daily!
Never Ever Miss A Move With Our Top Ten Stocks Lists
Find Best Stocks In Any Market - Bull or Bear Market
Take A Peek At Our Top Ten Stocks Lists: Daily, Weekly, Year-to-Date & Top Trends
Find Best Stocks In Any Market - Bull or Bear Market
Take A Peek At Our Top Ten Stocks Lists: Daily, Weekly, Year-to-Date & Top Trends
Smallcap Stocks With Best Up Trends [0-bearish to 100-bullish]: NextNav [100], MBIA [100], B. Riley[100], Haemonetics [100], Carpenter [100], Vishay Inter[100], Diodes [100], Excelerate Energy[100], LTC Properties[100], LCNB [100], Trustmark [100]
Best Smallcap Stocks Year-to-Date:
CareMax [568.04%], Janux [341.65%], Viking [299.3%], Alpine Immune[239.21%], Longboard [222.09%], Super Micro[201.81%], Avidity Biosciences[166.81%], Arcutis Bio[161.92%], Vera [156.27%], Cullinan Oncology[147.08%], Hippo [141.6%] Best Smallcap Stocks This Week:
Matterport [170.98%], B. Riley[83.84%], Cullinan Oncology[60.86%], Seres [48.22%], Zura Bio[38.67%], Universal Logistics[36.27%], Tutor Perini[33.89%], IGM Biosciences[30.83%], Riot Blockchain[30.61%], Impinj [29.79%], Sonic Automotive[28.14%] Best Smallcap Stocks Daily:
Universal Logistics[38.80%], Zura Bio[31.90%], Cullinan Oncology[30.86%], Tutor Perini[28.01%], IGM Biosciences[23.62%], U.S. Silica[21.67%], Maxeon Solar[20.17%], Exponent [19.40%], TPI Composites[16.32%], OptimizeRx [14.84%], Solaris Oilfield[13.95%]