
 Login Sign Up


| |||||
 |  | ||||

| 12Stocks.com Market Intelligence |
Best SmallCap Stocks
|
| In a hurry? Small Cap Stock Lists: Performance Trends Table, Stock Charts
Sort Small Cap stocks: Daily, Weekly, Year-to-Date, Market Cap & Trends. Filter Small Cap stocks list by sector: Show all, Tech, Finance, Energy, Staples, Retail, Industrial, Materials, Utilities and HealthCare Filter Small Cap stocks list by size: All Large Medium Small and MicroCap |
| 12Stocks.com Small Cap Stocks Performances & Trends Daily | |||||||||
|
|  The overall Smart Investing & Trading Score is 44 (0-bearish to 100-bullish) which puts Small Cap index in short term neutral trend. The Smart Investing & Trading Score from previous trading session is 58 and hence a deterioration of trend.
| ||||||||
Here are the Smart Investing & Trading Scores of the most requested small cap stocks at 12Stocks.com (click stock name for detailed review):
|


| 12Stocks.com: Investing in Smallcap Index with Stocks | |
|
The following table helps investors and traders sort through current performance and trends (as measured by Smart Investing & Trading Score) of various
stocks in the Smallcap Index. Quick View: Move mouse or cursor over stock symbol (ticker) to view short-term technical chart and over stock name to view long term chart. Click on  to add stock symbol to your watchlist and to add stock symbol to your watchlist and  to view watchlist. Click on any ticker or stock name for detailed market intelligence report for that stock. to view watchlist. Click on any ticker or stock name for detailed market intelligence report for that stock. |
12Stocks.com Performance of Stocks in Smallcap Index
| Ticker | Stock Name | Watchlist | Category | Recent Price | Smart Investing & Trading Score | Change % | Weekly Change% |
| ALEX | Alexander & Baldwin |   | Financials | 15.83 | 42 | -1.06% | -1.62% |
| APPS | Digital Turbine | | Technology | 1.82 | 52 | -5.21% | -1.62% |
| HBCP | Home Bancorp | | Financials | 35.50 | 40 | -2.69% | -1.63% |
| SOI | Solaris Oilfield | | Energy | 8.46 | 46 | -0.47% | -1.63% |
| CRNX | Crinetics | | Health Care | 42.28 | 56 | -2.40% | -1.63% |
| SGMO | Sangamo | | Health Care | 0.50 | 44 | 2.03% | -1.66% |
| UFCS | United Fire | | Financials | 22.42 | 81 | -1.28% | -1.67% |
| SRI | Stoneridge | | Consumer Staples | 15.35 | 10 | 0.66% | -1.67% |
| LPSN | LivePerson | | Technology | 0.50 | 25 | -1.01% | -1.67% |
| OLMA | Olema | | Health Care | 9.70 | 35 | -4.48% | -1.67% |
| COUR | Coursera | | Consumer Staples | 11.75 | 28 | -2.33% | -1.67% |
| PRLB | Proto Labs | | Industrials | 31.42 | 20 | -1.66% | -1.69% |
| CSTM | Constellium SE | | Materials | 20.37 | 41 | 1.90% | -1.69% |
| CRBU | Caribou Biosciences | | Health Care | 3.79 | 10 | -1.94% | -1.69% |
| CRMD | CorMedix | | Health Care | 5.19 | 71 | -2.63% | -1.70% |
| WOW | WideOpenWest | | Technology | 3.46 | 15 | -0.86% | -1.70% |
| RMNI | Rimini Street | | Technology | 2.81 | 17 | 0.18% | -1.75% |
| GENC | Gencor Industries | | Industrials | 16.76 | 54 | -0.71% | -1.76% |
| RAPT | RAPT | | Health Care | 7.82 | 10 | -1.01% | -1.76% |
| WTBA | West Ban | | Financials | 16.61 | 45 | -1.37% | -1.77% |
| DRQ | Dril-Quip | | Energy | 19.31 | 10 | 1.10% | -1.78% |
| IOSP | Innospec | | Materials | 120.10 | 26 | -1.59% | -1.78% |
| SBSI | Southside Bancshares | | Financials | 27.67 | 52 | -2.50% | -1.81% |
| ULH | Universal Logistics | | Transports | 32.89 | 68 | -2.14% | -1.82% |
| KRYS | Krystal Biotech | | Health Care | 155.74 | 41 | -2.08% | -1.83% |


| Too many stocks? View smallcap stocks filtered by marketcap & sector |
| Marketcap: All SmallCap Stocks (default-no microcap), Large, Mid-Range, Small |
| Smallcap Sector: Tech, Finance, Energy, Staples, Retail, Industrial, Materials, & Medical |
|
Get the most comprehensive stock market coverage daily at 12Stocks.com ➞ Best Stocks Today ➞ Best Stocks Weekly ➞ Best Stocks Year-to-Date ➞ Best Stocks Trends ➞  Best Stocks Today 12Stocks.com Best Nasdaq Stocks ➞ Best S&P 500 Stocks ➞ Best Tech Stocks ➞ Best Biotech Stocks ➞ |
| Detailed Overview of SmallCap Stocks |
| SmallCap Technical Overview, Leaders & Laggards, Top SmallCap ETF Funds & Detailed SmallCap Stocks List, Charts, Trends & More |
| Smallcap: Technical Analysis, Trends & YTD Performance | |
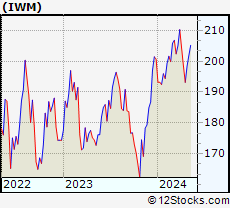
| SmallCap segment as represented by
IWM, an exchange-traded fund [ETF], holds basket of thousands of smallcap stocks from across all major sectors of the US stock market. The smallcap index (contains stocks like Riverbed & Sotheby's) is down by -2.11% and is currently underperforming the overall market by -7.27% year-to-date. Below is a quick view of technical charts and trends: | |
 IWM Weekly Chart |
|
| Long Term Trend: Good | |
| Medium Term Trend: Not Good | |
 IWM Daily Chart |
|
| Short Term Trend: Very Good | |
| Overall Trend Score: 44 | |
| YTD Performance: -2.11% | |
| **Trend Scores & Views Are Only For Educational Purposes And Not For Investing | |
| 12Stocks.com: Top Performing Small Cap Index Stocks | ||||||||||||||||||||||||||||||||||||||||||||||||
 The top performing Small Cap Index stocks year to date are
Now, more recently, over last week, the top performing Small Cap Index stocks on the move are


|
||||||||||||||||||||||||||||||||||||||||||||||||
| 12Stocks.com: Investing in Smallcap Index using Exchange Traded Funds | |
|
The following table shows list of key exchange traded funds (ETF) that
help investors track Smallcap index. The following list also includes leveraged ETF funds that track twice or thrice the daily returns of Smallcap indices. Short or inverse ETF funds move in the opposite direction to the index they track and are useful during market pullbacks or during bear markets. Quick View: Move mouse or cursor over ETF symbol (ticker) to view short-term technical chart and over ETF name to view long term chart. Click on ticker or stock name for detailed view. Click on to add stock symbol to your watchlist and to view watchlist. |
12Stocks.com List of ETFs that track Smallcap Index
| Ticker | ETF Name | Watchlist | Recent Price | Smart Investing & Trading Score | Change % | Week % | Year-to-date % |
| IWM | iShares Russell 2000 | | 196.48 | 44 | -0.61 | 1.73 | -2.11% |
| IJR | iShares Core S&P Small-Cap | | 104.86 | 78 | -0.80 | 1.59 | -3.13% |
| VTWO | Vanguard Russell 2000 ETF | | 79.45 | 63 | -0.60 | 1.75 | -2.03% |
| IWN | iShares Russell 2000 Value | | 150.18 | 68 | -0.73 | 1.62 | -3.32% |
| IWO | iShares Russell 2000 Growth | | 249.86 | 51 | -0.56 | 1.86 | -0.94% |
| IJS | iShares S&P Small-Cap 600 Value | | 96.69 | 60 | -1.04 | 1.13 | -6.19% |
| IJT | iShares S&P Small-Cap 600 Growth | | 125.06 | 63 | -0.25 | 2.33 | -0.06% |
| XSLV | PowerShares S&P SmallCap Low Volatil ETF | | 42.54 | 73 | -0.93 | 0.85 | -3.65% |
| SDD | ProShares UltraShort SmallCap600 | | 19.58 | 42 | 0.46 | -3.74 | 6.26% |
| SBB | ProShares Short SmallCap600 | | 16.50 | 40 | 0.79 | -2.02 | 3.58% |
| SMLV | SPDR SSGA US Small Cap Low Volatil ETF | | 107.33 | 73 | -1.01 | 1.17 | -4.61% |
| SAA | ProShares Ultra SmallCap600 | | 22.66 | 58 | -1.52 | 3.94 | -9.18% |
| 12Stocks.com: Charts, Trends, Fundamental Data and Performances of SmallCap Stocks | |
|
We now take in-depth look at all SmallCap stocks including charts, multi-period performances and overall trends (as measured by Smart Investing & Trading Score). One can sort SmallCap stocks (click link to choose) by Daily, Weekly and by Year-to-Date performances. Also, one can sort by size of the company or by market capitalization. |
| Select Your Default Chart Type: | |||||
| |||||
| Click on stock symbol or name for detailed view. Click on to add stock symbol to your watchlist and to view watchlist. Quick View: Move mouse or cursor over "Daily" to quickly view daily technical stock chart and over "Weekly" to view weekly technical stock chart. | |||||

 | ALEX Alexander & Baldwin, Inc. |
| Sector: Financials | |
| SubSector: Real Estate Development | |
| MarketCap: 751.419 Millions | |
| Recent Price: 15.83 Smart Investing & Trading Score: 42 | |
| Day Percent Change: -1.06% Day Change: -0.17 | |
| Week Change: -1.62% Year-to-date Change: -16.8% | |
| ALEX Links: Profile News Message Board | |
| Charts:- Daily , Weekly | |
| Add ALEX to Watchlist: View: Get Complete ALEX Trend Analysis ➞ | |
 | APPS Digital Turbine, Inc. |
| Sector: Technology | |
| SubSector: Application Software | |
| MarketCap: 437.262 Millions | |
| Recent Price: 1.82 Smart Investing & Trading Score: 52 | |
| Day Percent Change: -5.21% Day Change: -0.10 | |
| Week Change: -1.62% Year-to-date Change: -73.5% | |
| APPS Links: Profile News Message Board | |
| Charts:- Daily , Weekly | |
| Add APPS to Watchlist: View: Get Complete APPS Trend Analysis ➞ | |
 | HBCP Home Bancorp, Inc. |
| Sector: Financials | |
| SubSector: Savings & Loans | |
| MarketCap: 206.83 Millions | |
| Recent Price: 35.50 Smart Investing & Trading Score: 40 | |
| Day Percent Change: -2.69% Day Change: -0.98 | |
| Week Change: -1.63% Year-to-date Change: -15.5% | |
| HBCP Links: Profile News Message Board | |
| Charts:- Daily , Weekly | |
| Add HBCP to Watchlist: View: Get Complete HBCP Trend Analysis ➞ | |
 | SOI Solaris Oilfield Infrastructure, Inc. |
| Sector: Energy | |
| SubSector: Oil & Gas Equipment & Services | |
| MarketCap: 267.361 Millions | |
| Recent Price: 8.46 Smart Investing & Trading Score: 46 | |
| Day Percent Change: -0.47% Day Change: -0.04 | |
| Week Change: -1.63% Year-to-date Change: 6.3% | |
| SOI Links: Profile News Message Board | |
| Charts:- Daily , Weekly | |
| Add SOI to Watchlist: View: Get Complete SOI Trend Analysis ➞ | |
 | CRNX Crinetics Pharmaceuticals, Inc. |
| Sector: Health Care | |
| SubSector: Biotechnology | |
| MarketCap: 381.085 Millions | |
| Recent Price: 42.28 Smart Investing & Trading Score: 56 | |
| Day Percent Change: -2.40% Day Change: -1.04 | |
| Week Change: -1.63% Year-to-date Change: 18.8% | |
| CRNX Links: Profile News Message Board | |
| Charts:- Daily , Weekly | |
| Add CRNX to Watchlist: View: Get Complete CRNX Trend Analysis ➞ | |
 | SGMO Sangamo Therapeutics, Inc. |
| Sector: Health Care | |
| SubSector: Biotechnology | |
| MarketCap: 779.285 Millions | |
| Recent Price: 0.50 Smart Investing & Trading Score: 44 | |
| Day Percent Change: 2.03% Day Change: 0.01 | |
| Week Change: -1.66% Year-to-date Change: -7.4% | |
| SGMO Links: Profile News Message Board | |
| Charts:- Daily , Weekly | |
| Add SGMO to Watchlist: View: Get Complete SGMO Trend Analysis ➞ | |
 | UFCS United Fire Group, Inc. |
| Sector: Financials | |
| SubSector: Property & Casualty Insurance | |
| MarketCap: 862.812 Millions | |
| Recent Price: 22.42 Smart Investing & Trading Score: 81 | |
| Day Percent Change: -1.28% Day Change: -0.29 | |
| Week Change: -1.67% Year-to-date Change: 11.4% | |
| UFCS Links: Profile News Message Board | |
| Charts:- Daily , Weekly | |
| Add UFCS to Watchlist: View: Get Complete UFCS Trend Analysis ➞ | |
 | SRI Stoneridge, Inc. |
| Sector: Consumer Staples | |
| SubSector: Auto Parts | |
| MarketCap: 451.839 Millions | |
| Recent Price: 15.35 Smart Investing & Trading Score: 10 | |
| Day Percent Change: 0.66% Day Change: 0.10 | |
| Week Change: -1.67% Year-to-date Change: -21.6% | |
| SRI Links: Profile News Message Board | |
| Charts:- Daily , Weekly | |
| Add SRI to Watchlist: View: Get Complete SRI Trend Analysis ➞ | |
 | LPSN LivePerson, Inc. |
| Sector: Technology | |
| SubSector: Business Software & Services | |
| MarketCap: 1070.58 Millions | |
| Recent Price: 0.50 Smart Investing & Trading Score: 25 | |
| Day Percent Change: -1.01% Day Change: -0.01 | |
| Week Change: -1.67% Year-to-date Change: -86.8% | |
| LPSN Links: Profile News Message Board | |
| Charts:- Daily , Weekly | |
| Add LPSN to Watchlist: View: Get Complete LPSN Trend Analysis ➞ | |
 | OLMA Olema Pharmaceuticals, Inc. |
| Sector: Health Care | |
| SubSector: Biotechnology | |
| MarketCap: 17687 Millions | |
| Recent Price: 9.70 Smart Investing & Trading Score: 35 | |
| Day Percent Change: -4.48% Day Change: -0.46 | |
| Week Change: -1.67% Year-to-date Change: -31.1% | |
| OLMA Links: Profile News Message Board | |
| Charts:- Daily , Weekly | |
| Add OLMA to Watchlist: View: Get Complete OLMA Trend Analysis ➞ | |
 | COUR Coursera, Inc. |
| Sector: Consumer Staples | |
| SubSector: Education & Training Services | |
| MarketCap: 1990 Millions | |
| Recent Price: 11.75 Smart Investing & Trading Score: 28 | |
| Day Percent Change: -2.33% Day Change: -0.28 | |
| Week Change: -1.67% Year-to-date Change: -40.3% | |
| COUR Links: Profile News Message Board | |
| Charts:- Daily , Weekly | |
| Add COUR to Watchlist: View: Get Complete COUR Trend Analysis ➞ | |
 | PRLB Proto Labs, Inc. |
| Sector: Industrials | |
| SubSector: Machine Tools & Accessories | |
| MarketCap: 1944.78 Millions | |
| Recent Price: 31.42 Smart Investing & Trading Score: 20 | |
| Day Percent Change: -1.66% Day Change: -0.53 | |
| Week Change: -1.69% Year-to-date Change: -19.4% | |
| PRLB Links: Profile News Message Board | |
| Charts:- Daily , Weekly | |
| Add PRLB to Watchlist: View: Get Complete PRLB Trend Analysis ➞ | |
 | CSTM Constellium SE |
| Sector: Materials | |
| SubSector: Aluminum | |
| MarketCap: 646.608 Millions | |
| Recent Price: 20.37 Smart Investing & Trading Score: 41 | |
| Day Percent Change: 1.90% Day Change: 0.38 | |
| Week Change: -1.69% Year-to-date Change: 2.1% | |
| CSTM Links: Profile News Message Board | |
| Charts:- Daily , Weekly | |
| Add CSTM to Watchlist: View: Get Complete CSTM Trend Analysis ➞ | |
 | CRBU Caribou Biosciences, Inc. |
| Sector: Health Care | |
| SubSector: Biotechnology | |
| MarketCap: 258 Millions | |
| Recent Price: 3.79 Smart Investing & Trading Score: 10 | |
| Day Percent Change: -1.94% Day Change: -0.07 | |
| Week Change: -1.69% Year-to-date Change: -33.7% | |
| CRBU Links: Profile News Message Board | |
| Charts:- Daily , Weekly | |
| Add CRBU to Watchlist: View: Get Complete CRBU Trend Analysis ➞ | |
 | CRMD CorMedix, Inc. |
| Sector: Health Care | |
| SubSector: Biotechnology | |
| MarketCap: 90.7785 Millions | |
| Recent Price: 5.19 Smart Investing & Trading Score: 71 | |
| Day Percent Change: -2.63% Day Change: -0.14 | |
| Week Change: -1.7% Year-to-date Change: 38.0% | |
| CRMD Links: Profile News Message Board | |
| Charts:- Daily , Weekly | |
| Add CRMD to Watchlist: View: Get Complete CRMD Trend Analysis ➞ | |
 | WOW WideOpenWest, Inc. |
| Sector: Technology | |
| SubSector: CATV Systems | |
| MarketCap: 328.932 Millions | |
| Recent Price: 3.46 Smart Investing & Trading Score: 15 | |
| Day Percent Change: -0.86% Day Change: -0.03 | |
| Week Change: -1.7% Year-to-date Change: -14.6% | |
| WOW Links: Profile News Message Board | |
| Charts:- Daily , Weekly | |
| Add WOW to Watchlist: View: Get Complete WOW Trend Analysis ➞ | |
 | RMNI Rimini Street, Inc. |
| Sector: Technology | |
| SubSector: Application Software | |
| MarketCap: 288.762 Millions | |
| Recent Price: 2.81 Smart Investing & Trading Score: 17 | |
| Day Percent Change: 0.18% Day Change: 0.01 | |
| Week Change: -1.75% Year-to-date Change: -14.2% | |
| RMNI Links: Profile News Message Board | |
| Charts:- Daily , Weekly | |
| Add RMNI to Watchlist: View: Get Complete RMNI Trend Analysis ➞ | |
 | GENC Gencor Industries, Inc. |
| Sector: Industrials | |
| SubSector: Farm & Construction Machinery | |
| MarketCap: 147.607 Millions | |
| Recent Price: 16.76 Smart Investing & Trading Score: 54 | |
| Day Percent Change: -0.71% Day Change: -0.12 | |
| Week Change: -1.76% Year-to-date Change: 3.8% | |
| GENC Links: Profile News Message Board | |
| Charts:- Daily , Weekly | |
| Add GENC to Watchlist: View: Get Complete GENC Trend Analysis ➞ | |
 | RAPT RAPT Therapeutics, Inc. |
| Sector: Health Care | |
| SubSector: Biotechnology | |
| MarketCap: 368.785 Millions | |
| Recent Price: 7.82 Smart Investing & Trading Score: 10 | |
| Day Percent Change: -1.01% Day Change: -0.08 | |
| Week Change: -1.76% Year-to-date Change: -68.5% | |
| RAPT Links: Profile News Message Board | |
| Charts:- Daily , Weekly | |
| Add RAPT to Watchlist: View: Get Complete RAPT Trend Analysis ➞ | |
 | WTBA West Bancorporation, Inc. |
| Sector: Financials | |
| SubSector: Regional - Southwest Banks | |
| MarketCap: 272.965 Millions | |
| Recent Price: 16.61 Smart Investing & Trading Score: 45 | |
| Day Percent Change: -1.37% Day Change: -0.23 | |
| Week Change: -1.77% Year-to-date Change: -21.7% | |
| WTBA Links: Profile News Message Board | |
| Charts:- Daily , Weekly | |
| Add WTBA to Watchlist: View: Get Complete WTBA Trend Analysis ➞ | |
 | DRQ Dril-Quip, Inc. |
| Sector: Energy | |
| SubSector: Oil & Gas Equipment & Services | |
| MarketCap: 1211.61 Millions | |
| Recent Price: 19.31 Smart Investing & Trading Score: 10 | |
| Day Percent Change: 1.10% Day Change: 0.21 | |
| Week Change: -1.78% Year-to-date Change: -17.0% | |
| DRQ Links: Profile News Message Board | |
| Charts:- Daily , Weekly | |
| Add DRQ to Watchlist: View: Get Complete DRQ Trend Analysis ➞ | |
 | IOSP Innospec Inc. |
| Sector: Materials | |
| SubSector: Specialty Chemicals | |
| MarketCap: 1665.57 Millions | |
| Recent Price: 120.10 Smart Investing & Trading Score: 26 | |
| Day Percent Change: -1.59% Day Change: -1.94 | |
| Week Change: -1.78% Year-to-date Change: -2.6% | |
| IOSP Links: Profile News Message Board | |
| Charts:- Daily , Weekly | |
| Add IOSP to Watchlist: View: Get Complete IOSP Trend Analysis ➞ | |
 | SBSI Southside Bancshares, Inc. |
| Sector: Financials | |
| SubSector: Regional - Mid-Atlantic Banks | |
| MarketCap: 971.259 Millions | |
| Recent Price: 27.67 Smart Investing & Trading Score: 52 | |
| Day Percent Change: -2.50% Day Change: -0.71 | |
| Week Change: -1.81% Year-to-date Change: -11.7% | |
| SBSI Links: Profile News Message Board | |
| Charts:- Daily , Weekly | |
| Add SBSI to Watchlist: View: Get Complete SBSI Trend Analysis ➞ | |
 | ULH Universal Logistics Holdings, Inc. |
| Sector: Transports | |
| SubSector: Trucking | |
| MarketCap: 354.915 Millions | |
| Recent Price: 32.89 Smart Investing & Trading Score: 68 | |
| Day Percent Change: -2.14% Day Change: -0.72 | |
| Week Change: -1.82% Year-to-date Change: 17.4% | |
| ULH Links: Profile News Message Board | |
| Charts:- Daily , Weekly | |
| Add ULH to Watchlist: View: Get Complete ULH Trend Analysis ➞ | |
 | KRYS Krystal Biotech, Inc. |
| Sector: Health Care | |
| SubSector: Biotechnology | |
| MarketCap: 874.085 Millions | |
| Recent Price: 155.74 Smart Investing & Trading Score: 41 | |
| Day Percent Change: -2.08% Day Change: -3.31 | |
| Week Change: -1.83% Year-to-date Change: 25.5% | |
| KRYS Links: Profile News Message Board | |
| Charts:- Daily , Weekly | |
| Add KRYS to Watchlist: View: Get Complete KRYS Trend Analysis ➞ | |
| Too many stocks? View smallcap stocks filtered by marketcap & sector |
| Marketcap: All SmallCap Stocks (default-no microcap), Large, Mid-Range, Small & MicroCap |
| Sector: Tech, Finance, Energy, Staples, Retail, Industrial, Materials, Utilities & Medical |
|
Best Stocks Today 12Stocks.com |
© 2024 12Stocks.com Terms & Conditions Privacy Contact Us
All Information Provided Only For Education And Not To Be Used For Investing or Trading. See Terms & Conditions


One More Thing ... Get Best Stocks Delivered Daily!
Never Ever Miss A Move With Our Top Ten Stocks Lists
Find Best Stocks In Any Market - Bull or Bear Market
Take A Peek At Our Top Ten Stocks Lists: Daily, Weekly, Year-to-Date & Top Trends
Find Best Stocks In Any Market - Bull or Bear Market
Take A Peek At Our Top Ten Stocks Lists: Daily, Weekly, Year-to-Date & Top Trends
Smallcap Stocks With Best Up Trends [0-bearish to 100-bullish]: B. Riley[100], Central Pacific[100], California Water[100], Cricut [100], Carpenter [100], Haemonetics [100], Sanmina [100], Trustmark [100], Comstock Resources[100], EchoStar [100], Mueller Industries[100]
Best Smallcap Stocks Year-to-Date:
CareMax [490.72%], Janux [338.34%], Viking [270.02%], Alpine Immune[239.52%], Longboard [218%], Super Micro[177%], Arcutis Bio[166.56%], Avidity Biosciences[159.79%], Vera [149.94%], Hippo [128.87%], Stoke [122.15%] Best Smallcap Stocks This Week:
Matterport [168.97%], B. Riley[73.54%], Impinj [33.73%], ProKidney [32.84%], Seres [32.65%], Riot Blockchain[32.64%], Ribbon [25.58%], Cullinan Oncology[22.92%], P.A.M. Transportation[22.85%], NuScale Power[21.44%], Hibbett Sports[21.03%] Best Smallcap Stocks Daily:
Impinj [28.65%], P.A.M. Transportation[17.95%], B. Riley[16.61%], Strategic Education[16.28%], OptiNose [14.56%], JELD-WEN Holding[11.54%], Sonic Automotive[10.86%], Intevac [10.54%], SiTime [8.84%], Noodles & [8.08%], ProKidney [7.75%]