
 Login Sign Up


| |||||
 |  | ||||

| 12Stocks.com Market Intelligence |
Best SmallCap Stocks
|
| In a hurry? Small Cap Stock Lists: Performance Trends Table, Stock Charts
Sort Small Cap stocks: Daily, Weekly, Year-to-Date, Market Cap & Trends. Filter Small Cap stocks list by sector: Show all, Tech, Finance, Energy, Staples, Retail, Industrial, Materials, Utilities and HealthCare Filter Small Cap stocks list by size: All Large Medium Small and MicroCap |
| 12Stocks.com Small Cap Stocks Performances & Trends Daily | |||||||||
|
|  The overall Smart Investing & Trading Score is 56 (0-bearish to 100-bullish) which puts Small Cap index in short term neutral trend. The Smart Investing & Trading Score from previous trading session is 44 and hence an improvement of trend.
| ||||||||
Here are the Smart Investing & Trading Scores of the most requested small cap stocks at 12Stocks.com (click stock name for detailed review):
|


| 12Stocks.com: Investing in Smallcap Index with Stocks | |
|
The following table helps investors and traders sort through current performance and trends (as measured by Smart Investing & Trading Score) of various
stocks in the Smallcap Index. Quick View: Move mouse or cursor over stock symbol (ticker) to view short-term technical chart and over stock name to view long term chart. Click on  to add stock symbol to your watchlist and to add stock symbol to your watchlist and  to view watchlist. Click on any ticker or stock name for detailed market intelligence report for that stock. to view watchlist. Click on any ticker or stock name for detailed market intelligence report for that stock. |
12Stocks.com Performance of Stocks in Smallcap Index
| Ticker | Stock Name | Watchlist | Category | Recent Price | Smart Investing & Trading Score | Change % | Weekly Change% |
| MTRN | Materion |   | Materials | 119.40 | 43 | 0.65% | -0.07% |
| LAND | Gladstone Land | | Financials | 12.68 | 59 | 0.32% | -0.08% |
| VGR | Vector Group | | Consumer Staples | 10.27 | 80 | -0.58% | -0.10% |
| FSBW | FS Bancorp | | Financials | 31.47 | 25 | 0.10% | -0.10% |
| FOXF | Fox Factory | | Consumer Staples | 40.45 | 37 | 2.74% | -0.10% |
| CSTM | Constellium SE | | Materials | 20.70 | 48 | 1.62% | -0.10% |
| TAST | Carrols Restaurant | | Services & Goods | 9.51 | 55 | 0.00% | -0.11% |
| ALIT | Alight | | Technology | 9.11 | 56 | 0.00% | -0.11% |
| SMP | Standard Motor | | Consumer Staples | 32.46 | 42 | 0.56% | -0.12% |
| NWPX | Northwest Pipe | | Materials | 31.81 | 61 | 1.02% | -0.13% |
| ATRC | AtriCure | | Health Care | 23.17 | 35 | 2.48% | -0.13% |
| PRGS | Progress | | Technology | 50.34 | 57 | -0.71% | -0.14% |
| KWR | Quaker Chemical | | Materials | 190.23 | 25 | 1.49% | -0.14% |
| DNOW | NOW | | Energy | 14.63 | 75 | -0.34% | -0.14% |
| IRTC | iRhythm | | Health Care | 111.91 | 67 | 0.58% | -0.16% |
| BYND | Beyond Meat | | Consumer Staples | 6.40 | 22 | 0.87% | -0.16% |
| FBIZ | First Business | | Financials | 34.24 | 7 | 1.03% | -0.17% |
| SVV | Savers Value | | Services & Goods | 17.13 | 24 | 0.29% | -0.17% |
| HALO | Halozyme | | Health Care | 38.57 | 75 | 0.29% | -0.18% |
| ANIP | ANI | | Health Care | 65.36 | 51 | 0.63% | -0.18% |
| MGEE | MGE Energy | | Utilities | 77.60 | 95 | -1.42% | -0.19% |
| ACTG | Acacia Research | | Services & Goods | 4.87 | 68 | -0.41% | -0.20% |
| OFLX | Omega Flex | | Industrials | 66.85 | 42 | -1.09% | -0.22% |
| BANF | BancFirst | | Financials | 89.08 | 93 | -0.27% | -0.22% |
| MLR | Miller Industries | | Consumer Staples | 49.08 | 61 | 0.16% | -0.22% |


| Too many stocks? View smallcap stocks filtered by marketcap & sector |
| Marketcap: All SmallCap Stocks (default-no microcap), Large, Mid-Range, Small |
| Smallcap Sector: Tech, Finance, Energy, Staples, Retail, Industrial, Materials, & Medical |
|
Get the most comprehensive stock market coverage daily at 12Stocks.com ➞ Best Stocks Today ➞ Best Stocks Weekly ➞ Best Stocks Year-to-Date ➞ Best Stocks Trends ➞  Best Stocks Today 12Stocks.com Best Nasdaq Stocks ➞ Best S&P 500 Stocks ➞ Best Tech Stocks ➞ Best Biotech Stocks ➞ |
| Detailed Overview of SmallCap Stocks |
| SmallCap Technical Overview, Leaders & Laggards, Top SmallCap ETF Funds & Detailed SmallCap Stocks List, Charts, Trends & More |
| Smallcap: Technical Analysis, Trends & YTD Performance | |
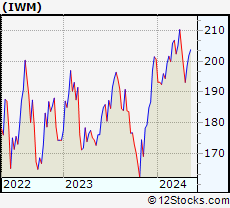
| SmallCap segment as represented by
IWM, an exchange-traded fund [ETF], holds basket of thousands of smallcap stocks from across all major sectors of the US stock market. The smallcap index (contains stocks like Riverbed & Sotheby's) is down by -1.16% and is currently underperforming the overall market by -7.3% year-to-date. Below is a quick view of technical charts and trends: | |
 IWM Weekly Chart |
|
| Long Term Trend: Good | |
| Medium Term Trend: Not Good | |
 IWM Daily Chart |
|
| Short Term Trend: Very Good | |
| Overall Trend Score: 56 | |
| YTD Performance: -1.16% | |
| **Trend Scores & Views Are Only For Educational Purposes And Not For Investing | |
| 12Stocks.com: Top Performing Small Cap Index Stocks | ||||||||||||||||||||||||||||||||||||||||||||||||
 The top performing Small Cap Index stocks year to date are
Now, more recently, over last week, the top performing Small Cap Index stocks on the move are


|
||||||||||||||||||||||||||||||||||||||||||||||||
| 12Stocks.com: Investing in Smallcap Index using Exchange Traded Funds | |
|
The following table shows list of key exchange traded funds (ETF) that
help investors track Smallcap index. The following list also includes leveraged ETF funds that track twice or thrice the daily returns of Smallcap indices. Short or inverse ETF funds move in the opposite direction to the index they track and are useful during market pullbacks or during bear markets. Quick View: Move mouse or cursor over ETF symbol (ticker) to view short-term technical chart and over ETF name to view long term chart. Click on ticker or stock name for detailed view. Click on to add stock symbol to your watchlist and to view watchlist. |
12Stocks.com List of ETFs that track Smallcap Index
| Ticker | ETF Name | Watchlist | Recent Price | Smart Investing & Trading Score | Change % | Week % | Year-to-date % |
| IWM | iShares Russell 2000 | | 198.39 | 56 | 0.97 | 2.72 | -1.16% |
| IJR | iShares Core S&P Small-Cap | | 105.65 | 85 | 0.75 | 2.35 | -2.4% |
| VTWO | Vanguard Russell 2000 ETF | | 80.22 | 70 | 0.97 | 2.74 | -1.09% |
| IWN | iShares Russell 2000 Value | | 151.14 | 75 | 0.64 | 2.27 | -2.7% |
| IWO | iShares Russell 2000 Growth | | 253.09 | 58 | 1.29 | 3.18 | 0.34% |
| IJS | iShares S&P Small-Cap 600 Value | | 97.19 | 67 | 0.52 | 1.65 | -5.7% |
| IJT | iShares S&P Small-Cap 600 Growth | | 126.09 | 70 | 0.82 | 3.17 | 0.76% |
| XSLV | PowerShares S&P SmallCap Low Volatil ETF | | 42.72 | 80 | 0.42 | 1.28 | -3.24% |
| SAA | ProShares Ultra SmallCap600 | | 23.04 | 65 | 1.68 | 5.69 | -7.66% |
| SBB | ProShares Short SmallCap600 | | 16.39 | 33 | -0.70 | -2.7 | 2.86% |
| SDD | ProShares UltraShort SmallCap600 | | 19.35 | 35 | -1.17 | -4.87 | 5.01% |
| SMLV | SPDR SSGA US Small Cap Low Volatil ETF | | 107.52 | 80 | 0.18 | 1.35 | -4.44% |
| 12Stocks.com: Charts, Trends, Fundamental Data and Performances of SmallCap Stocks | |
|
We now take in-depth look at all SmallCap stocks including charts, multi-period performances and overall trends (as measured by Smart Investing & Trading Score). One can sort SmallCap stocks (click link to choose) by Daily, Weekly and by Year-to-Date performances. Also, one can sort by size of the company or by market capitalization. |
| Select Your Default Chart Type: | |||||
| |||||
| Click on stock symbol or name for detailed view. Click on to add stock symbol to your watchlist and to view watchlist. Quick View: Move mouse or cursor over "Daily" to quickly view daily technical stock chart and over "Weekly" to view weekly technical stock chart. | |||||

 | MTRN Materion Corporation |
| Sector: Materials | |
| SubSector: Industrial Metals & Minerals | |
| MarketCap: 703.71 Millions | |
| Recent Price: 119.40 Smart Investing & Trading Score: 43 | |
| Day Percent Change: 0.65% Day Change: 0.77 | |
| Week Change: -0.07% Year-to-date Change: -8.3% | |
| MTRN Links: Profile News Message Board | |
| Charts:- Daily , Weekly | |
| Add MTRN to Watchlist: View: Get Complete MTRN Trend Analysis ➞ | |
 | LAND Gladstone Land Corporation |
| Sector: Financials | |
| SubSector: REIT - Diversified | |
| MarketCap: 252.653 Millions | |
| Recent Price: 12.68 Smart Investing & Trading Score: 59 | |
| Day Percent Change: 0.32% Day Change: 0.04 | |
| Week Change: -0.08% Year-to-date Change: -12.3% | |
| LAND Links: Profile News Message Board | |
| Charts:- Daily , Weekly | |
| Add LAND to Watchlist: View: Get Complete LAND Trend Analysis ➞ | |
 | VGR Vector Group Ltd. |
| Sector: Consumer Staples | |
| SubSector: Cigarettes | |
| MarketCap: 1676.53 Millions | |
| Recent Price: 10.27 Smart Investing & Trading Score: 80 | |
| Day Percent Change: -0.58% Day Change: -0.06 | |
| Week Change: -0.1% Year-to-date Change: -9.0% | |
| VGR Links: Profile News Message Board | |
| Charts:- Daily , Weekly | |
| Add VGR to Watchlist: View: Get Complete VGR Trend Analysis ➞ | |
 | FSBW FS Bancorp, Inc. |
| Sector: Financials | |
| SubSector: Regional - Pacific Banks | |
| MarketCap: 140.429 Millions | |
| Recent Price: 31.47 Smart Investing & Trading Score: 25 | |
| Day Percent Change: 0.10% Day Change: 0.03 | |
| Week Change: -0.1% Year-to-date Change: -14.9% | |
| FSBW Links: Profile News Message Board | |
| Charts:- Daily , Weekly | |
| Add FSBW to Watchlist: View: Get Complete FSBW Trend Analysis ➞ | |
 | FOXF Fox Factory Holding Corp. |
| Sector: Consumer Staples | |
| SubSector: Recreational Vehicles | |
| MarketCap: 2093.29 Millions | |
| Recent Price: 40.45 Smart Investing & Trading Score: 37 | |
| Day Percent Change: 2.74% Day Change: 1.08 | |
| Week Change: -0.1% Year-to-date Change: -40.1% | |
| FOXF Links: Profile News Message Board | |
| Charts:- Daily , Weekly | |
| Add FOXF to Watchlist: View: Get Complete FOXF Trend Analysis ➞ | |
 | CSTM Constellium SE |
| Sector: Materials | |
| SubSector: Aluminum | |
| MarketCap: 646.608 Millions | |
| Recent Price: 20.70 Smart Investing & Trading Score: 48 | |
| Day Percent Change: 1.62% Day Change: 0.33 | |
| Week Change: -0.1% Year-to-date Change: 3.7% | |
| CSTM Links: Profile News Message Board | |
| Charts:- Daily , Weekly | |
| Add CSTM to Watchlist: View: Get Complete CSTM Trend Analysis ➞ | |
 | TAST Carrols Restaurant Group, Inc. |
| Sector: Services & Goods | |
| SubSector: Restaurants | |
| MarketCap: 75.657 Millions | |
| Recent Price: 9.51 Smart Investing & Trading Score: 55 | |
| Day Percent Change: 0.00% Day Change: 0.00 | |
| Week Change: -0.11% Year-to-date Change: 20.7% | |
| TAST Links: Profile News Message Board | |
| Charts:- Daily , Weekly | |
| Add TAST to Watchlist: View: Get Complete TAST Trend Analysis ➞ | |
 | ALIT Alight, Inc. |
| Sector: Technology | |
| SubSector: Software - Application | |
| MarketCap: 5130 Millions | |
| Recent Price: 9.11 Smart Investing & Trading Score: 56 | |
| Day Percent Change: 0.00% Day Change: 0.00 | |
| Week Change: -0.11% Year-to-date Change: 7.1% | |
| ALIT Links: Profile News Message Board | |
| Charts:- Daily , Weekly | |
| Add ALIT to Watchlist: View: Get Complete ALIT Trend Analysis ➞ | |
 | SMP Standard Motor Products, Inc. |
| Sector: Consumer Staples | |
| SubSector: Auto Parts | |
| MarketCap: 909.939 Millions | |
| Recent Price: 32.46 Smart Investing & Trading Score: 42 | |
| Day Percent Change: 0.56% Day Change: 0.18 | |
| Week Change: -0.12% Year-to-date Change: -18.5% | |
| SMP Links: Profile News Message Board | |
| Charts:- Daily , Weekly | |
| Add SMP to Watchlist: View: Get Complete SMP Trend Analysis ➞ | |
 | NWPX Northwest Pipe Company |
| Sector: Materials | |
| SubSector: Steel & Iron | |
| MarketCap: 245.788 Millions | |
| Recent Price: 31.81 Smart Investing & Trading Score: 61 | |
| Day Percent Change: 1.02% Day Change: 0.32 | |
| Week Change: -0.13% Year-to-date Change: 5.1% | |
| NWPX Links: Profile News Message Board | |
| Charts:- Daily , Weekly | |
| Add NWPX to Watchlist: View: Get Complete NWPX Trend Analysis ➞ | |
 | ATRC AtriCure, Inc. |
| Sector: Health Care | |
| SubSector: Medical Instruments & Supplies | |
| MarketCap: 1158.7 Millions | |
| Recent Price: 23.17 Smart Investing & Trading Score: 35 | |
| Day Percent Change: 2.48% Day Change: 0.56 | |
| Week Change: -0.13% Year-to-date Change: -35.1% | |
| ATRC Links: Profile News Message Board | |
| Charts:- Daily , Weekly | |
| Add ATRC to Watchlist: View: Get Complete ATRC Trend Analysis ➞ | |
 | PRGS Progress Software Corporation |
| Sector: Technology | |
| SubSector: Application Software | |
| MarketCap: 1407.22 Millions | |
| Recent Price: 50.34 Smart Investing & Trading Score: 57 | |
| Day Percent Change: -0.71% Day Change: -0.36 | |
| Week Change: -0.14% Year-to-date Change: -7.3% | |
| PRGS Links: Profile News Message Board | |
| Charts:- Daily , Weekly | |
| Add PRGS to Watchlist: View: Get Complete PRGS Trend Analysis ➞ | |
 | KWR Quaker Chemical Corporation |
| Sector: Materials | |
| SubSector: Specialty Chemicals | |
| MarketCap: 2411.67 Millions | |
| Recent Price: 190.23 Smart Investing & Trading Score: 25 | |
| Day Percent Change: 1.49% Day Change: 2.80 | |
| Week Change: -0.14% Year-to-date Change: -10.9% | |
| KWR Links: Profile News Message Board | |
| Charts:- Daily , Weekly | |
| Add KWR to Watchlist: View: Get Complete KWR Trend Analysis ➞ | |
 | DNOW NOW Inc. |
| Sector: Energy | |
| SubSector: Oil & Gas Equipment & Services | |
| MarketCap: 679.661 Millions | |
| Recent Price: 14.63 Smart Investing & Trading Score: 75 | |
| Day Percent Change: -0.34% Day Change: -0.05 | |
| Week Change: -0.14% Year-to-date Change: 29.2% | |
| DNOW Links: Profile News Message Board | |
| Charts:- Daily , Weekly | |
| Add DNOW to Watchlist: View: Get Complete DNOW Trend Analysis ➞ | |
 | IRTC iRhythm Technologies, Inc. |
| Sector: Health Care | |
| SubSector: Medical Instruments & Supplies | |
| MarketCap: 2167.9 Millions | |
| Recent Price: 111.91 Smart Investing & Trading Score: 67 | |
| Day Percent Change: 0.58% Day Change: 0.64 | |
| Week Change: -0.16% Year-to-date Change: 4.6% | |
| IRTC Links: Profile News Message Board | |
| Charts:- Daily , Weekly | |
| Add IRTC to Watchlist: View: Get Complete IRTC Trend Analysis ➞ | |
 | BYND Beyond Meat, Inc. |
| Sector: Consumer Staples | |
| SubSector: Processed & Packaged Goods | |
| MarketCap: 3987.98 Millions | |
| Recent Price: 6.40 Smart Investing & Trading Score: 22 | |
| Day Percent Change: 0.87% Day Change: 0.06 | |
| Week Change: -0.16% Year-to-date Change: -28.1% | |
| BYND Links: Profile News Message Board | |
| Charts:- Daily , Weekly | |
| Add BYND to Watchlist: View: Get Complete BYND Trend Analysis ➞ | |
 | FBIZ First Business Financial Services, Inc. |
| Sector: Financials | |
| SubSector: Regional - Midwest Banks | |
| MarketCap: 144.97 Millions | |
| Recent Price: 34.24 Smart Investing & Trading Score: 7 | |
| Day Percent Change: 1.03% Day Change: 0.35 | |
| Week Change: -0.17% Year-to-date Change: -14.6% | |
| FBIZ Links: Profile News Message Board | |
| Charts:- Daily , Weekly | |
| Add FBIZ to Watchlist: View: Get Complete FBIZ Trend Analysis ➞ | |
 | SVV Savers Value Village, Inc. |
| Sector: Services & Goods | |
| SubSector: Specialty Retail | |
| MarketCap: 3800 Millions | |
| Recent Price: 17.13 Smart Investing & Trading Score: 24 | |
| Day Percent Change: 0.29% Day Change: 0.05 | |
| Week Change: -0.17% Year-to-date Change: -3.5% | |
| SVV Links: Profile News Message Board | |
| Charts:- Daily , Weekly | |
| Add SVV to Watchlist: View: Get Complete SVV Trend Analysis ➞ | |
 | HALO Halozyme Therapeutics, Inc. |
| Sector: Health Care | |
| SubSector: Biotechnology | |
| MarketCap: 2383.75 Millions | |
| Recent Price: 38.57 Smart Investing & Trading Score: 75 | |
| Day Percent Change: 0.29% Day Change: 0.11 | |
| Week Change: -0.18% Year-to-date Change: 4.4% | |
| HALO Links: Profile News Message Board | |
| Charts:- Daily , Weekly | |
| Add HALO to Watchlist: View: Get Complete HALO Trend Analysis ➞ | |
 | ANIP ANI Pharmaceuticals, Inc. |
| Sector: Health Care | |
| SubSector: Biotechnology | |
| MarketCap: 489.285 Millions | |
| Recent Price: 65.36 Smart Investing & Trading Score: 51 | |
| Day Percent Change: 0.63% Day Change: 0.41 | |
| Week Change: -0.18% Year-to-date Change: 18.5% | |
| ANIP Links: Profile News Message Board | |
| Charts:- Daily , Weekly | |
| Add ANIP to Watchlist: View: Get Complete ANIP Trend Analysis ➞ | |
 | MGEE MGE Energy, Inc. |
| Sector: Utilities | |
| SubSector: Diversified Utilities | |
| MarketCap: 2608.3 Millions | |
| Recent Price: 77.60 Smart Investing & Trading Score: 95 | |
| Day Percent Change: -1.42% Day Change: -1.12 | |
| Week Change: -0.19% Year-to-date Change: 7.3% | |
| MGEE Links: Profile News Message Board | |
| Charts:- Daily , Weekly | |
| Add MGEE to Watchlist: View: Get Complete MGEE Trend Analysis ➞ | |
 | ACTG Acacia Research Corporation |
| Sector: Services & Goods | |
| SubSector: Business Services | |
| MarketCap: 112.782 Millions | |
| Recent Price: 4.87 Smart Investing & Trading Score: 68 | |
| Day Percent Change: -0.41% Day Change: -0.02 | |
| Week Change: -0.2% Year-to-date Change: 24.2% | |
| ACTG Links: Profile News Message Board | |
| Charts:- Daily , Weekly | |
| Add ACTG to Watchlist: View: Get Complete ACTG Trend Analysis ➞ | |
 | OFLX Omega Flex, Inc. |
| Sector: Industrials | |
| SubSector: Industrial Equipment & Components | |
| MarketCap: 590.609 Millions | |
| Recent Price: 66.85 Smart Investing & Trading Score: 42 | |
| Day Percent Change: -1.09% Day Change: -0.74 | |
| Week Change: -0.22% Year-to-date Change: -5.2% | |
| OFLX Links: Profile News Message Board | |
| Charts:- Daily , Weekly | |
| Add OFLX to Watchlist: View: Get Complete OFLX Trend Analysis ➞ | |
 | BANF BancFirst Corporation |
| Sector: Financials | |
| SubSector: Regional - Southwest Banks | |
| MarketCap: 1068.65 Millions | |
| Recent Price: 89.08 Smart Investing & Trading Score: 93 | |
| Day Percent Change: -0.27% Day Change: -0.24 | |
| Week Change: -0.22% Year-to-date Change: -8.5% | |
| BANF Links: Profile News Message Board | |
| Charts:- Daily , Weekly | |
| Add BANF to Watchlist: View: Get Complete BANF Trend Analysis ➞ | |
 | MLR Miller Industries, Inc. |
| Sector: Consumer Staples | |
| SubSector: Auto Parts | |
| MarketCap: 335.239 Millions | |
| Recent Price: 49.08 Smart Investing & Trading Score: 61 | |
| Day Percent Change: 0.16% Day Change: 0.08 | |
| Week Change: -0.22% Year-to-date Change: 16.1% | |
| MLR Links: Profile News Message Board | |
| Charts:- Daily , Weekly | |
| Add MLR to Watchlist: View: Get Complete MLR Trend Analysis ➞ | |
| Too many stocks? View smallcap stocks filtered by marketcap & sector |
| Marketcap: All SmallCap Stocks (default-no microcap), Large, Mid-Range, Small & MicroCap |
| Sector: Tech, Finance, Energy, Staples, Retail, Industrial, Materials, Utilities & Medical |
|
Best Stocks Today 12Stocks.com |
© 2024 12Stocks.com Terms & Conditions Privacy Contact Us
All Information Provided Only For Education And Not To Be Used For Investing or Trading. See Terms & Conditions


One More Thing ... Get Best Stocks Delivered Daily!
Never Ever Miss A Move With Our Top Ten Stocks Lists
Find Best Stocks In Any Market - Bull or Bear Market
Take A Peek At Our Top Ten Stocks Lists: Daily, Weekly, Year-to-Date & Top Trends
Find Best Stocks In Any Market - Bull or Bear Market
Take A Peek At Our Top Ten Stocks Lists: Daily, Weekly, Year-to-Date & Top Trends
Smallcap Stocks With Best Up Trends [0-bearish to 100-bullish]: Cullinan Oncology[100], NextNav [100], MBIA [100], Reservoir Media[100], B. Riley[100], Braemar Hotels[100], Pactiv Evergreen[100], Wolverine World[100], Haemonetics [100], Benchmark Electronics[100], Uniti Group[100]
Best Smallcap Stocks Year-to-Date:
CareMax [568.04%], Janux [341.65%], Viking [299.3%], Alpine Immune[239.21%], Longboard [222.09%], Super Micro[201.64%], Avidity Biosciences[166.81%], Arcutis Bio[162.23%], Vera [156.27%], Cullinan Oncology[147.08%], Hippo [141.6%] Best Smallcap Stocks This Week:
Matterport [170.98%], B. Riley[84.19%], Cullinan Oncology[60.86%], Seres [47.35%], Zura Bio[38.67%], Universal Logistics[36.84%], Tutor Perini[33.89%], Riot Blockchain[30.67%], IGM Biosciences[30.56%], Impinj [29.74%], Sonic Automotive[28.14%] Best Smallcap Stocks Daily:
Universal Logistics[39.37%], Zura Bio[31.90%], Cullinan Oncology[30.86%], Tutor Perini[28.01%], IGM Biosciences[23.36%], U.S. Silica[21.67%], Maxeon Solar[20.17%], Exponent [19.49%], TPI Composites[16.32%], OptimizeRx [14.84%], Solaris Oilfield[13.95%]