
 Login Sign Up


| |||||
 |  | ||||

| 12Stocks.com Market Intelligence |
Best SmallCap Stocks
|
| In a hurry? Small Cap Stock Lists: Performance Trends Table, Stock Charts
Sort Small Cap stocks: Daily, Weekly, Year-to-Date, Market Cap & Trends. Filter Small Cap stocks list by sector: Show all, Tech, Finance, Energy, Staples, Retail, Industrial, Materials, Utilities and HealthCare Filter Small Cap stocks list by size: All Large Medium Small and MicroCap |
| 12Stocks.com Small Cap Stocks Performances & Trends Daily | |||||||||
|
|  The overall Smart Investing & Trading Score is 69 (0-bearish to 100-bullish) which puts Small Cap index in short term neutral to bullish trend. The Smart Investing & Trading Score from previous trading session is 49 and hence an improvement of trend.
| ||||||||
Here are the Smart Investing & Trading Scores of the most requested small cap stocks at 12Stocks.com (click stock name for detailed review):
|


| 12Stocks.com: Investing in Smallcap Index with Stocks | |
|
The following table helps investors and traders sort through current performance and trends (as measured by Smart Investing & Trading Score) of various
stocks in the Smallcap Index. Quick View: Move mouse or cursor over stock symbol (ticker) to view short-term technical chart and over stock name to view long term chart. Click on  to add stock symbol to your watchlist and to add stock symbol to your watchlist and  to view watchlist. Click on any ticker or stock name for detailed market intelligence report for that stock. to view watchlist. Click on any ticker or stock name for detailed market intelligence report for that stock. |
12Stocks.com Performance of Stocks in Smallcap Index
| Ticker | Stock Name | Watchlist | Category | Recent Price | Smart Investing & Trading Score | Change % | YTD Change% |
| PATK | Patrick Industries |   | Industrials | 111.13 | 64 | 0.72 | 10.74% |
| NTB | Bank of N.T. Butterfield & Son | | Financials | 35.37 | 95 | 0.71 | 10.50% |
| LZB | La-Z-Boy | | Consumer Staples | 33.21 | 42 | 0.70 | -10.05% |
| GRC | Gorman-Rupp | | Industrials | 32.71 | 17 | 0.68 | -7.94% |
| DRH | DiamondRock Hospitality | | Financials | 8.83 | 25 | 0.68 | -5.96% |
| CDRE | Cadre | | Industrials | 33.84 | 57 | 0.67 | 2.64% |
| CBL | CBL & Associates Properties | | Financials | 21.71 | 45 | 0.65 | -11.10% |
| SGH | SMART Global | | Technology | 18.63 | 39 | 0.65 | -1.58% |
| GMS | GMS | | Industrials | 95.32 | 70 | 0.63 | 15.64% |
| TSVT | 2seventy bio | | Health Care | 4.78 | 49 | 0.63 | 10.52% |
| BATRK | Liberty Braves | | Services & Goods | 38.79 | 57 | 0.62 | -2.00% |
| FBP | First Ban | | Financials | 18.08 | 100 | 0.61 | 9.91% |
| OI | O-I Glass | | Consumer Staples | 13.17 | 7 | 0.61 | -19.60% |
| WASH | Washington Trust | | Financials | 26.54 | 93 | 0.61 | -18.04% |
| GFF | Griffon | | Industrials | 69.13 | 54 | 0.61 | 13.42% |
| CAKE | Cheesecake Factory | | Services & Goods | 33.67 | 15 | 0.60 | -3.83% |
| GABC | German American | | Financials | 32.15 | 76 | 0.59 | -0.80% |
| FCF | First Commonwealth | | Financials | 13.67 | 100 | 0.59 | -11.46% |
| SST | System1 | | Industrials | 1.75 | 63 | 0.58 | -27.59% |
| MEI | Methode Electronics | | Technology | 12.34 | 54 | 0.57 | -45.71% |
| PRIM | Primoris Services | | Industrials | 47.30 | 95 | 0.57 | 42.43% |
| HLVX | HilleVax | | Health Care | 14.02 | 49 | 0.57 | -14.90% |
| SCHL | Scholastic | | Services & Goods | 36.15 | 67 | 0.56 | -4.11% |
| SPTN | SpartanNash | | Consumer Staples | 19.64 | 67 | 0.56 | -14.42% |
| SMP | Standard Motor | | Consumer Staples | 32.35 | 56 | 0.56 | -18.74% |
| For chart view version of above stock list: Chart View ➞ 0 - 25 , 25 - 50 , 50 - 75 , 75 - 100 , 100 - 125 , 125 - 150 , 150 - 175 , 175 - 200 , 200 - 225 , 225 - 250 , 250 - 275 , 275 - 300 , 300 - 325 , 325 - 350 | ||
 | Click To Change The Sort Order: By Market Cap or Company Size Performance: Year-to-date, Week and Day |  |
| Too many stocks? View smallcap stocks filtered by marketcap & sector |
| Marketcap: All SmallCap Stocks (default-no microcap), Large, Mid-Range, Small |
| Smallcap Sector: Tech, Finance, Energy, Staples, Retail, Industrial, Materials, & Medical |
|
Get the most comprehensive stock market coverage daily at 12Stocks.com ➞ Best Stocks Today ➞ Best Stocks Weekly ➞ Best Stocks Year-to-Date ➞ Best Stocks Trends ➞  Best Stocks Today 12Stocks.com Best Nasdaq Stocks ➞ Best S&P 500 Stocks ➞ Best Tech Stocks ➞ Best Biotech Stocks ➞ |
| Detailed Overview of SmallCap Stocks |
| SmallCap Technical Overview, Leaders & Laggards, Top SmallCap ETF Funds & Detailed SmallCap Stocks List, Charts, Trends & More |
| Smallcap: Technical Analysis, Trends & YTD Performance | |
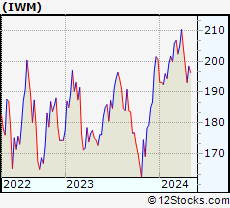
| SmallCap segment as represented by
IWM, an exchange-traded fund [ETF], holds basket of thousands of smallcap stocks from across all major sectors of the US stock market. The smallcap index (contains stocks like Riverbed & Sotheby's) is up by 0.59% and is currently underperforming the overall market by -6.29% year-to-date. Below is a quick view of technical charts and trends: | |
 IWM Weekly Chart |
|
| Long Term Trend: Not Good | |
| Medium Term Trend: Very Good | |
 IWM Daily Chart |
|
| Short Term Trend: Very Good | |
| Overall Trend Score: 69 | |
| YTD Performance: 0.59% | |
| **Trend Scores & Views Are Only For Educational Purposes And Not For Investing | |
| 12Stocks.com: Top Performing Small Cap Index Stocks | ||||||||||||||||||||||||||||||||||||||||||||||||
 The top performing Small Cap Index stocks year to date are
Now, more recently, over last week, the top performing Small Cap Index stocks on the move are


|
||||||||||||||||||||||||||||||||||||||||||||||||
| 12Stocks.com: Investing in Smallcap Index using Exchange Traded Funds | |
|
The following table shows list of key exchange traded funds (ETF) that
help investors track Smallcap index. The following list also includes leveraged ETF funds that track twice or thrice the daily returns of Smallcap indices. Short or inverse ETF funds move in the opposite direction to the index they track and are useful during market pullbacks or during bear markets. Quick View: Move mouse or cursor over ETF symbol (ticker) to view short-term technical chart and over ETF name to view long term chart. Click on ticker or stock name for detailed view. Click on to add stock symbol to your watchlist and to view watchlist. |
12Stocks.com List of ETFs that track Smallcap Index
| Ticker | ETF Name | Watchlist | Recent Price | Smart Investing & Trading Score | Change % | Week % | Year-to-date % |
| IWM | iShares Russell 2000 | | 201.90 | 69 | 0.99 | 1.77 | 0.59% |
| IJR | iShares Core S&P Small-Cap | | 107.13 | 82 | 0.75 | 1.4 | -1.03% |
| VTWO | Vanguard Russell 2000 ETF | | 81.61 | 69 | 0.94 | 1.73 | 0.63% |
| IWN | iShares Russell 2000 Value | | 154.21 | 100 | 0.87 | 2.03 | -0.72% |
| IJS | iShares S&P Small-Cap 600 Value | | 98.72 | 64 | 0.71 | 1.57 | -4.22% |
| IWO | iShares Russell 2000 Growth | | 256.87 | 57 | 0.99 | 1.49 | 1.84% |
| IJT | iShares S&P Small-Cap 600 Growth | | 127.76 | 95 | 0.82 | 1.32 | 2.09% |
| XSLV | PowerShares S&P SmallCap Low Volatil ETF | | 43.22 | 87 | 0.19 | 1.17 | -2.11% |
| SBB | ProShares Short SmallCap600 | | 16.16 | 13 | -1.28 | -1.37 | 1.44% |
| SDD | ProShares UltraShort SmallCap600 | | 18.84 | 23 | -2.41 | -2.61 | 2.27% |
| SAA | ProShares Ultra SmallCap600 | | 23.59 | 69 | 2.86 | 2.39 | -5.45% |
| SMLV | SPDR SSGA US Small Cap Low Volatil ETF | | 109.69 | 87 | 0.78 | 2.01 | -2.52% |
| 12Stocks.com: Charts, Trends, Fundamental Data and Performances of SmallCap Stocks | |
|
We now take in-depth look at all SmallCap stocks including charts, multi-period performances and overall trends (as measured by Smart Investing & Trading Score). One can sort SmallCap stocks (click link to choose) by Daily, Weekly and by Year-to-Date performances. Also, one can sort by size of the company or by market capitalization. |
| Select Your Default Chart Type: | |||||
| |||||
| Click on stock symbol or name for detailed view. Click on to add stock symbol to your watchlist and to view watchlist. Quick View: Move mouse or cursor over "Daily" to quickly view daily technical stock chart and over "Weekly" to view weekly technical stock chart. | |||||

 | PATK Patrick Industries, Inc. |
| Sector: Industrials | |
| SubSector: Lumber, Wood Production | |
| MarketCap: 565.838 Millions | |
| Recent Price: 111.13 Smart Investing & Trading Score: 64 | |
| Day Percent Change: 0.72% Day Change: 0.79 | |
| Week Change: 5.35% Year-to-date Change: 10.7% | |
| PATK Links: Profile News Message Board | |
| Charts:- Daily , Weekly | |
| Add PATK to Watchlist: View: Get Complete PATK Trend Analysis ➞ | |
 | NTB The Bank of N.T. Butterfield & Son Limited |
| Sector: Financials | |
| SubSector: Foreign Regional Banks | |
| MarketCap: 889.379 Millions | |
| Recent Price: 35.37 Smart Investing & Trading Score: 95 | |
| Day Percent Change: 0.71% Day Change: 0.25 | |
| Week Change: 3.85% Year-to-date Change: 10.5% | |
| NTB Links: Profile News Message Board | |
| Charts:- Daily , Weekly | |
| Add NTB to Watchlist: View: Get Complete NTB Trend Analysis ➞ | |
 | LZB La-Z-Boy Incorporated |
| Sector: Consumer Staples | |
| SubSector: Home Furnishings & Fixtures | |
| MarketCap: 951.635 Millions | |
| Recent Price: 33.21 Smart Investing & Trading Score: 42 | |
| Day Percent Change: 0.70% Day Change: 0.23 | |
| Week Change: 0.3% Year-to-date Change: -10.1% | |
| LZB Links: Profile News Message Board | |
| Charts:- Daily , Weekly | |
| Add LZB to Watchlist: View: Get Complete LZB Trend Analysis ➞ | |
 | GRC The Gorman-Rupp Company |
| Sector: Industrials | |
| SubSector: Diversified Machinery | |
| MarketCap: 729.616 Millions | |
| Recent Price: 32.71 Smart Investing & Trading Score: 17 | |
| Day Percent Change: 0.68% Day Change: 0.22 | |
| Week Change: -2.01% Year-to-date Change: -7.9% | |
| GRC Links: Profile News Message Board | |
| Charts:- Daily , Weekly | |
| Add GRC to Watchlist: View: Get Complete GRC Trend Analysis ➞ | |
 | DRH DiamondRock Hospitality Company |
| Sector: Financials | |
| SubSector: REIT - Hotel/Motel | |
| MarketCap: 964 Millions | |
| Recent Price: 8.83 Smart Investing & Trading Score: 25 | |
| Day Percent Change: 0.68% Day Change: 0.06 | |
| Week Change: -2.43% Year-to-date Change: -6.0% | |
| DRH Links: Profile News Message Board | |
| Charts:- Daily , Weekly | |
| Add DRH to Watchlist: View: Get Complete DRH Trend Analysis ➞ | |
 | CDRE Cadre Holdings, Inc. |
| Sector: Industrials | |
| SubSector: Aerospace & Defense | |
| MarketCap: 817 Millions | |
| Recent Price: 33.84 Smart Investing & Trading Score: 57 | |
| Day Percent Change: 0.67% Day Change: 0.23 | |
| Week Change: 2.17% Year-to-date Change: 2.6% | |
| CDRE Links: Profile News Message Board | |
| Charts:- Daily , Weekly | |
| Add CDRE to Watchlist: View: Get Complete CDRE Trend Analysis ➞ | |
 | CBL CBL & Associates Properties, Inc. |
| Sector: Financials | |
| SubSector: REIT - Retail | |
| MarketCap: 690 Millions | |
| Recent Price: 21.71 Smart Investing & Trading Score: 45 | |
| Day Percent Change: 0.65% Day Change: 0.14 | |
| Week Change: -0.96% Year-to-date Change: -11.1% | |
| CBL Links: Profile News Message Board | |
| Charts:- Daily , Weekly | |
| Add CBL to Watchlist: View: Get Complete CBL Trend Analysis ➞ | |
 | SGH SMART Global Holdings, Inc. |
| Sector: Technology | |
| SubSector: Semiconductor- Memory Chips | |
| MarketCap: 657.8 Millions | |
| Recent Price: 18.63 Smart Investing & Trading Score: 39 | |
| Day Percent Change: 0.65% Day Change: 0.12 | |
| Week Change: 1.58% Year-to-date Change: -1.6% | |
| SGH Links: Profile News Message Board | |
| Charts:- Daily , Weekly | |
| Add SGH to Watchlist: View: Get Complete SGH Trend Analysis ➞ | |
 | GMS GMS Inc. |
| Sector: Industrials | |
| SubSector: General Building Materials | |
| MarketCap: 587.753 Millions | |
| Recent Price: 95.32 Smart Investing & Trading Score: 70 | |
| Day Percent Change: 0.63% Day Change: 0.60 | |
| Week Change: 2.62% Year-to-date Change: 15.6% | |
| GMS Links: Profile News Message Board | |
| Charts:- Daily , Weekly | |
| Add GMS to Watchlist: View: Get Complete GMS Trend Analysis ➞ | |
 | TSVT 2seventy bio, Inc. |
| Sector: Health Care | |
| SubSector: Biotechnology | |
| MarketCap: 504 Millions | |
| Recent Price: 4.78 Smart Investing & Trading Score: 49 | |
| Day Percent Change: 0.63% Day Change: 0.03 | |
| Week Change: 12.21% Year-to-date Change: 10.5% | |
| TSVT Links: Profile News Message Board | |
| Charts:- Daily , Weekly | |
| Add TSVT to Watchlist: View: Get Complete TSVT Trend Analysis ➞ | |
 | BATRK The Liberty Braves Group |
| Sector: Services & Goods | |
| SubSector: Broadcasting - TV | |
| MarketCap: 638.363 Millions | |
| Recent Price: 38.79 Smart Investing & Trading Score: 57 | |
| Day Percent Change: 0.62% Day Change: 0.24 | |
| Week Change: 1.57% Year-to-date Change: -2.0% | |
| BATRK Links: Profile News Message Board | |
| Charts:- Daily , Weekly | |
| Add BATRK to Watchlist: View: Get Complete BATRK Trend Analysis ➞ | |
 | FBP First BanCorp. |
| Sector: Financials | |
| SubSector: Foreign Regional Banks | |
| MarketCap: 913.079 Millions | |
| Recent Price: 18.08 Smart Investing & Trading Score: 100 | |
| Day Percent Change: 0.61% Day Change: 0.11 | |
| Week Change: 4.87% Year-to-date Change: 9.9% | |
| FBP Links: Profile News Message Board | |
| Charts:- Daily , Weekly | |
| Add FBP to Watchlist: View: Get Complete FBP Trend Analysis ➞ | |
 | OI O-I Glass, Inc. |
| Sector: Consumer Staples | |
| SubSector: Packaging & Containers | |
| MarketCap: 881.853 Millions | |
| Recent Price: 13.17 Smart Investing & Trading Score: 7 | |
| Day Percent Change: 0.61% Day Change: 0.08 | |
| Week Change: -12.61% Year-to-date Change: -19.6% | |
| OI Links: Profile News Message Board | |
| Charts:- Daily , Weekly | |
| Add OI to Watchlist: View: Get Complete OI Trend Analysis ➞ | |
 | WASH Washington Trust Bancorp, Inc. |
| Sector: Financials | |
| SubSector: Regional - Northeast Banks | |
| MarketCap: 590.099 Millions | |
| Recent Price: 26.54 Smart Investing & Trading Score: 93 | |
| Day Percent Change: 0.61% Day Change: 0.16 | |
| Week Change: 1.53% Year-to-date Change: -18.0% | |
| WASH Links: Profile News Message Board | |
| Charts:- Daily , Weekly | |
| Add WASH to Watchlist: View: Get Complete WASH Trend Analysis ➞ | |
 | GFF Griffon Corporation |
| Sector: Industrials | |
| SubSector: General Building Materials | |
| MarketCap: 616 Millions | |
| Recent Price: 69.13 Smart Investing & Trading Score: 54 | |
| Day Percent Change: 0.61% Day Change: 0.42 | |
| Week Change: 1.26% Year-to-date Change: 13.4% | |
| GFF Links: Profile News Message Board | |
| Charts:- Daily , Weekly | |
| Add GFF to Watchlist: View: Get Complete GFF Trend Analysis ➞ | |
 | CAKE The Cheesecake Factory Incorporated |
| Sector: Services & Goods | |
| SubSector: Restaurants | |
| MarketCap: 829 Millions | |
| Recent Price: 33.67 Smart Investing & Trading Score: 15 | |
| Day Percent Change: 0.60% Day Change: 0.20 | |
| Week Change: -4.77% Year-to-date Change: -3.8% | |
| CAKE Links: Profile News Message Board | |
| Charts:- Daily , Weekly | |
| Add CAKE to Watchlist: View: Get Complete CAKE Trend Analysis ➞ | |
 | GABC German American Bancorp, Inc. |
| Sector: Financials | |
| SubSector: Regional - Midwest Banks | |
| MarketCap: 731.47 Millions | |
| Recent Price: 32.15 Smart Investing & Trading Score: 76 | |
| Day Percent Change: 0.59% Day Change: 0.19 | |
| Week Change: -0.31% Year-to-date Change: -0.8% | |
| GABC Links: Profile News Message Board | |
| Charts:- Daily , Weekly | |
| Add GABC to Watchlist: View: Get Complete GABC Trend Analysis ➞ | |
 | FCF First Commonwealth Financial Corporation |
| Sector: Financials | |
| SubSector: Regional - Northeast Banks | |
| MarketCap: 900.299 Millions | |
| Recent Price: 13.67 Smart Investing & Trading Score: 100 | |
| Day Percent Change: 0.59% Day Change: 0.08 | |
| Week Change: 0.89% Year-to-date Change: -11.5% | |
| FCF Links: Profile News Message Board | |
| Charts:- Daily , Weekly | |
| Add FCF to Watchlist: View: Get Complete FCF Trend Analysis ➞ | |
 | SST System1, Inc. |
| Sector: Industrials | |
| SubSector: Specialty Business Services | |
| MarketCap: 504 Millions | |
| Recent Price: 1.75 Smart Investing & Trading Score: 63 | |
| Day Percent Change: 0.58% Day Change: 0.01 | |
| Week Change: 0.87% Year-to-date Change: -27.6% | |
| SST Links: Profile News Message Board | |
| Charts:- Daily , Weekly | |
| Add SST to Watchlist: View: Get Complete SST Trend Analysis ➞ | |
 | MEI Methode Electronics, Inc. |
| Sector: Technology | |
| SubSector: Diversified Electronics | |
| MarketCap: 941.896 Millions | |
| Recent Price: 12.34 Smart Investing & Trading Score: 54 | |
| Day Percent Change: 0.57% Day Change: 0.07 | |
| Week Change: 0.98% Year-to-date Change: -45.7% | |
| MEI Links: Profile News Message Board | |
| Charts:- Daily , Weekly | |
| Add MEI to Watchlist: View: Get Complete MEI Trend Analysis ➞ | |
 | PRIM Primoris Services Corporation |
| Sector: Industrials | |
| SubSector: Heavy Construction | |
| MarketCap: 931.895 Millions | |
| Recent Price: 47.30 Smart Investing & Trading Score: 95 | |
| Day Percent Change: 0.57% Day Change: 0.27 | |
| Week Change: 1.9% Year-to-date Change: 42.4% | |
| PRIM Links: Profile News Message Board | |
| Charts:- Daily , Weekly | |
| Add PRIM to Watchlist: View: Get Complete PRIM Trend Analysis ➞ | |
 | HLVX HilleVax, Inc. |
| Sector: Health Care | |
| SubSector: Biotechnology | |
| MarketCap: 680 Millions | |
| Recent Price: 14.02 Smart Investing & Trading Score: 49 | |
| Day Percent Change: 0.57% Day Change: 0.08 | |
| Week Change: 9.45% Year-to-date Change: -14.9% | |
| HLVX Links: Profile News Message Board | |
| Charts:- Daily , Weekly | |
| Add HLVX to Watchlist: View: Get Complete HLVX Trend Analysis ➞ | |
 | SCHL Scholastic Corporation |
| Sector: Services & Goods | |
| SubSector: Publishing - Books | |
| MarketCap: 791 Millions | |
| Recent Price: 36.15 Smart Investing & Trading Score: 67 | |
| Day Percent Change: 0.56% Day Change: 0.20 | |
| Week Change: -0.74% Year-to-date Change: -4.1% | |
| SCHL Links: Profile News Message Board | |
| Charts:- Daily , Weekly | |
| Add SCHL to Watchlist: View: Get Complete SCHL Trend Analysis ➞ | |
 | SPTN SpartanNash Company |
| Sector: Consumer Staples | |
| SubSector: Food Wholesale | |
| MarketCap: 671.229 Millions | |
| Recent Price: 19.64 Smart Investing & Trading Score: 67 | |
| Day Percent Change: 0.56% Day Change: 0.11 | |
| Week Change: 1.71% Year-to-date Change: -14.4% | |
| SPTN Links: Profile News Message Board | |
| Charts:- Daily , Weekly | |
| Add SPTN to Watchlist: View: Get Complete SPTN Trend Analysis ➞ | |
 | SMP Standard Motor Products, Inc. |
| Sector: Consumer Staples | |
| SubSector: Auto Parts | |
| MarketCap: 909.939 Millions | |
| Recent Price: 32.35 Smart Investing & Trading Score: 56 | |
| Day Percent Change: 0.56% Day Change: 0.18 | |
| Week Change: -0.34% Year-to-date Change: -18.7% | |
| SMP Links: Profile News Message Board | |
| Charts:- Daily , Weekly | |
| Add SMP to Watchlist: View: Get Complete SMP Trend Analysis ➞ | |
| For tabular summary view of above stock list: Summary View ➞ 0 - 25 , 25 - 50 , 50 - 75 , 75 - 100 , 100 - 125 , 125 - 150 , 150 - 175 , 175 - 200 , 200 - 225 , 225 - 250 , 250 - 275 , 275 - 300 , 300 - 325 , 325 - 350 | ||
| Click To Change The Sort Order: By Market Cap or Company Size Performance: Year-to-date, Week and Day | |
| Select Chart Type: | ||
| Too many stocks? View smallcap stocks filtered by marketcap & sector |
| Marketcap: All SmallCap Stocks (default-no microcap), Large, Mid-Range, Small & MicroCap |
| Sector: Tech, Finance, Energy, Staples, Retail, Industrial, Materials, Utilities & Medical |
|
Best Stocks Today 12Stocks.com |
© 2024 12Stocks.com Terms & Conditions Privacy Contact Us
All Information Provided Only For Education And Not To Be Used For Investing or Trading. See Terms & Conditions


One More Thing ... Get Best Stocks Delivered Daily!
Never Ever Miss A Move With Our Top Ten Stocks Lists
Find Best Stocks In Any Market - Bull or Bear Market
Take A Peek At Our Top Ten Stocks Lists: Daily, Weekly, Year-to-Date & Top Trends
Find Best Stocks In Any Market - Bull or Bear Market
Take A Peek At Our Top Ten Stocks Lists: Daily, Weekly, Year-to-Date & Top Trends
Smallcap Stocks With Best Up Trends [0-bearish to 100-bullish]: Twist Bioscience[100], WideOpenWest [100], Joint [100], FTC Solar[100], Origin Materials[100], Alignment Healthcare[100], Clarus [100], IES [100], Emergent BioSolutions[100], Enovix [100], El Pollo[100]
Best Smallcap Stocks Year-to-Date:
Janux [482.74%], Viking [313.59%], Longboard [272.5%], Alpine Immune[239.29%], Bakkt [199.55%], Avidity Biosciences[192.48%], Vera [189.47%], Cullinan Oncology[176.9%], Super Micro[175.35%], Y-mAbs [151.47%], Sana [149.33%] Best Smallcap Stocks This Week:
Emergent BioSolutions[102.6%], Deciphera [73.24%], Origin Materials[66.52%], Eyenovia [60.78%], Cue Biopharma[56.04%], Aspen Aerogels[55.96%], Enovix [54.02%], Luna Innovations[53.77%], Codexis [47.37%], Carvana Co[44.31%], Office Properties[42.79%] Best Smallcap Stocks Daily:
Luna Innovations[36.00%], Twist Bioscience[28.74%], Ardelyx [28.42%], WideOpenWest [28.23%], 2U [26.63%], Joint [25.35%], FTC Solar[25.09%], Origin Materials[22.23%], Alignment Healthcare[21.97%], Clarus [18.67%], Aurora Innovation[18.09%]