
 Login Sign Up


| |||||
 |  | ||||

| 12Stocks.com Market Intelligence |
Best SmallCap Stocks
|
| In a hurry? Small Cap Stock Lists: Performance Trends Table, Stock Charts
Sort Small Cap stocks: Daily, Weekly, Year-to-Date, Market Cap & Trends. Filter Small Cap stocks list by sector: Show all, Tech, Finance, Energy, Staples, Retail, Industrial, Materials, Utilities and HealthCare Filter Small Cap stocks list by size: All Large Medium Small and MicroCap |
| 12Stocks.com Small Cap Stocks Performances & Trends Daily | |||||||||
|
|  The overall Smart Investing & Trading Score is 25 (0-bearish to 100-bullish) which puts Small Cap index in short term bearish to neutral trend. The Smart Investing & Trading Score from previous trading session is 17 and hence an improvement of trend.
| ||||||||
Here are the Smart Investing & Trading Scores of the most requested small cap stocks at 12Stocks.com (click stock name for detailed review):
|


| 12Stocks.com: Investing in Smallcap Index with Stocks | |
|
The following table helps investors and traders sort through current performance and trends (as measured by Smart Investing & Trading Score) of various
stocks in the Smallcap Index. Quick View: Move mouse or cursor over stock symbol (ticker) to view short-term technical chart and over stock name to view long term chart. Click on  to add stock symbol to your watchlist and to add stock symbol to your watchlist and  to view watchlist. Click on any ticker or stock name for detailed market intelligence report for that stock. to view watchlist. Click on any ticker or stock name for detailed market intelligence report for that stock. |
12Stocks.com Performance of Stocks in Smallcap Index
| Ticker | Stock Name | Watchlist | Category | Recent Price | Smart Investing & Trading Score | Change % | Weekly Change% |
| EPRT | Essential Properties |   | Financials | 27.24 | 66 | -1.48% | -1.30% |
| SKT | Tanger Factory | | Financials | 26.68 | 17 | -1.69% | -1.37% |
| SITC | SITE Centers | | Financials | 14.36 | 18 | -1.10% | -1.37% |
| HASI | Hannon Armstrong | | Financials | 30.99 | 46 | 0.42% | -1.40% |
| NREF | NexPoint Real | | Financials | 13.14 | 0 | 0.28% | -1.50% |
| GEO | GEO Group | | Financials | 12.85 | 17 | -1.91% | -1.53% |
| FFWM | First Foundation | | Financials | 5.70 | 27 | 0.00% | -1.55% |
| WSR | Whitestone REIT | | Financials | 13.16 | 76 | -2.45% | -1.64% |
| HCI | HCI Group | | Financials | 92.54 | 10 | -1.47% | -1.65% |
| LGIH | LGI Homes | | Financials | 92.00 | 10 | -3.01% | -1.74% |
| CHMG | Chemung Financial | | Financials | 42.06 | 13 | -0.33% | -1.84% |
| DHIL | Diamond Hill | | Financials | 143.89 | 10 | -1.42% | -1.85% |
| PAX | Patria s | | Financials | 12.13 | 10 | -1.46% | -1.86% |
| BSIG | BrightSphere | | Financials | 21.96 | 7 | 0.83% | -2.01% |
| HPP | Hudson Pacific | | Financials | 4.85 | 57 | -0.21% | -2.02% |
| ONL | Orion Office | | Financials | 3.36 | 20 | 0.90% | -2.04% |
| NKSH | National Bankshares | | Financials | 29.20 | 45 | -2.60% | -2.05% |
| PLBC | Plumas Bancorp | | Financials | 34.32 | 18 | -1.89% | -2.14% |
| ARR | ARMOUR Residential | | Financials | 19.10 | 10 | -1.24% | -2.25% |
| PGC | Peapack-Gladstone Financial | | Financials | 21.45 | 32 | -0.46% | -2.28% |
| FOR | Forestar Group | | Financials | 31.40 | 10 | -1.60% | -2.36% |
| CXW | CoreCivic | | Financials | 11.31 | 10 | -2.08% | -2.58% |
| CBAN | Colony Bankcorp | | Financials | 11.51 | 15 | 0.31% | -2.62% |
| SNFCA | Security National | | Financials | 7.41 | 10 | -1.40% | -2.69% |
| PAGS | PagSeguro Digital | | Financials | 11.15 | 0 | -2.19% | -2.71% |
| For chart view version of above stock list: Chart View ➞ 0 - 25 , 25 - 50 , 50 - 75 , 75 - 100 , 100 - 125 , 125 - 150 , 150 - 175 , 175 - 200 , 200 - 225 , 225 - 250 , 250 - 275 , 275 - 300 , 300 - 325 , 325 - 350 , 350 - 375 , 375 - 400 | ||
 | Click To Change The Sort Order: By Market Cap or Company Size Performance: Year-to-date, Week and Day |  |
| Too many stocks? View smallcap stocks filtered by marketcap & sector |
| Marketcap: All SmallCap Stocks (default-no microcap), Large, Mid-Range, Small |
| Smallcap Sector: Tech, Finance, Energy, Staples, Retail, Industrial, Materials, & Medical |
|
Get the most comprehensive stock market coverage daily at 12Stocks.com ➞ Best Stocks Today ➞ Best Stocks Weekly ➞ Best Stocks Year-to-Date ➞ Best Stocks Trends ➞  Best Stocks Today 12Stocks.com Best Nasdaq Stocks ➞ Best S&P 500 Stocks ➞ Best Tech Stocks ➞ Best Biotech Stocks ➞ |
| Detailed Overview of SmallCap Stocks |
| SmallCap Technical Overview, Leaders & Laggards, Top SmallCap ETF Funds & Detailed SmallCap Stocks List, Charts, Trends & More |
| Smallcap: Technical Analysis, Trends & YTD Performance | |
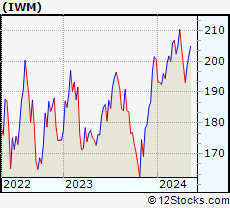
| SmallCap segment as represented by
IWM, an exchange-traded fund [ETF], holds basket of thousands of smallcap stocks from across all major sectors of the US stock market. The smallcap index (contains stocks like Riverbed & Sotheby's) is up by 0.02% and is currently underperforming the overall market by -13.55% year-to-date. Below is a quick view of technical charts and trends: | |
 IWM Weekly Chart |
|
| Long Term Trend: Not Good | |
| Medium Term Trend: Not Good | |
 IWM Daily Chart |
|
| Short Term Trend: Deteriorating | |
| Overall Trend Score: 25 | |
| YTD Performance: 0.02% | |
| **Trend Scores & Views Are Only For Educational Purposes And Not For Investing | |
| 12Stocks.com: Top Performing Small Cap Index Stocks | ||||||||||||||||||||||||||||||||||||||||||||||||
 The top performing Small Cap Index stocks year to date are
Now, more recently, over last week, the top performing Small Cap Index stocks on the move are


|
||||||||||||||||||||||||||||||||||||||||||||||||
| 12Stocks.com: Investing in Smallcap Index using Exchange Traded Funds | |
|
The following table shows list of key exchange traded funds (ETF) that
help investors track Smallcap index. The following list also includes leveraged ETF funds that track twice or thrice the daily returns of Smallcap indices. Short or inverse ETF funds move in the opposite direction to the index they track and are useful during market pullbacks or during bear markets. Quick View: Move mouse or cursor over ETF symbol (ticker) to view short-term technical chart and over ETF name to view long term chart. Click on ticker or stock name for detailed view. Click on to add stock symbol to your watchlist and to view watchlist. |
12Stocks.com List of ETFs that track Smallcap Index
| Ticker | ETF Name | Watchlist | Recent Price | Smart Investing & Trading Score | Change % | Week % | Year-to-date % |
| IWM | iShares Russell 2000 | | 200.75 | 25 | 0.17 | 1.02 | 0.02% |
| IJR | iShares Core S&P Small-Cap | | 105.70 | 17 | 0.03 | 0.97 | -2.36% |
| IWN | iShares Russell 2000 Value | | 149.94 | 17 | -0.01 | 0.78 | -3.47% |
| VTWO | Vanguard Russell 2000 ETF | | 81.40 | 17 | 0.16 | 0.99 | 0.37% |
| IWO | iShares Russell 2000 Growth | | 261.17 | 27 | 0.37 | 1.16 | 3.55% |
| IJS | iShares S&P Small-Cap 600 Value | | 96.07 | 17 | -0.02 | 0.83 | -6.79% |
| IJT | iShares S&P Small-Cap 600 Growth | | 127.56 | 17 | 0.06 | 1.27 | 1.93% |
| XSLV | PowerShares S&P SmallCap Low Volatil ETF | | 43.15 | 22 | 0.07 | 0.96 | -2.27% |
| SAA | ProShares Ultra SmallCap600 | | 22.95 | 17 | 0.61 | 0.31 | -8.02% |
| SMLV | SPDR SSGA US Small Cap Low Volatil ETF | | 107.80 | 25 | 0.31 | 1.35 | -4.19% |
| SBB | ProShares Short SmallCap600 | | 16.45 | 83 | -0.84 | -1.38 | 3.26% |
| SDD | ProShares UltraShort SmallCap600 | | 19.39 | 76 | -2.11 | -2.41 | 5.24% |
| 12Stocks.com: Charts, Trends, Fundamental Data and Performances of SmallCap Stocks | |
|
We now take in-depth look at all SmallCap stocks including charts, multi-period performances and overall trends (as measured by Smart Investing & Trading Score). One can sort SmallCap stocks (click link to choose) by Daily, Weekly and by Year-to-Date performances. Also, one can sort by size of the company or by market capitalization. |
| Select Your Default Chart Type: | |||||
| |||||
| Click on stock symbol or name for detailed view. Click on to add stock symbol to your watchlist and to view watchlist. Quick View: Move mouse or cursor over "Daily" to quickly view daily technical stock chart and over "Weekly" to view weekly technical stock chart. | |||||

 | EPRT Essential Properties Realty Trust, Inc. |
| Sector: Financials | |
| SubSector: REIT - Diversified | |
| MarketCap: 1424.43 Millions | |
| Recent Price: 27.24 Smart Investing & Trading Score: 66 | |
| Day Percent Change: -1.48% Day Change: -0.41 | |
| Week Change: -1.3% Year-to-date Change: 6.6% | |
| EPRT Links: Profile News Message Board | |
| Charts:- Daily , Weekly | |
| Add EPRT to Watchlist: View: Get Complete EPRT Trend Analysis ➞ | |
 | SKT Tanger Factory Outlet Centers, Inc. |
| Sector: Financials | |
| SubSector: REIT - Retail | |
| MarketCap: 720.214 Millions | |
| Recent Price: 26.68 Smart Investing & Trading Score: 17 | |
| Day Percent Change: -1.69% Day Change: -0.46 | |
| Week Change: -1.37% Year-to-date Change: -3.8% | |
| SKT Links: Profile News Message Board | |
| Charts:- Daily , Weekly | |
| Add SKT to Watchlist: View: Get Complete SKT Trend Analysis ➞ | |
 | SITC SITE Centers Corp. |
| Sector: Financials | |
| SubSector: REIT - Retail | |
| MarketCap: 1449.54 Millions | |
| Recent Price: 14.36 Smart Investing & Trading Score: 18 | |
| Day Percent Change: -1.10% Day Change: -0.16 | |
| Week Change: -1.37% Year-to-date Change: 5.4% | |
| SITC Links: Profile News Message Board | |
| Charts:- Daily , Weekly | |
| Add SITC to Watchlist: View: Get Complete SITC Trend Analysis ➞ | |
 | HASI Hannon Armstrong Sustainable Infrastructure Capital, Inc. |
| Sector: Financials | |
| SubSector: REIT - Diversified | |
| MarketCap: 1405.93 Millions | |
| Recent Price: 30.99 Smart Investing & Trading Score: 46 | |
| Day Percent Change: 0.42% Day Change: 0.13 | |
| Week Change: -1.4% Year-to-date Change: 12.4% | |
| HASI Links: Profile News Message Board | |
| Charts:- Daily , Weekly | |
| Add HASI to Watchlist: View: Get Complete HASI Trend Analysis ➞ | |
 | NREF NexPoint Real Estate Finance, Inc. |
| Sector: Financials | |
| SubSector: REIT Diversified | |
| MarketCap: 97267 Millions | |
| Recent Price: 13.14 Smart Investing & Trading Score: 0 | |
| Day Percent Change: 0.28% Day Change: 0.04 | |
| Week Change: -1.5% Year-to-date Change: -16.5% | |
| NREF Links: Profile News Message Board | |
| Charts:- Daily , Weekly | |
| Add NREF to Watchlist: View: Get Complete NREF Trend Analysis ➞ | |
 | GEO The GEO Group, Inc. |
| Sector: Financials | |
| SubSector: REIT - Healthcare Facilities | |
| MarketCap: 1678.34 Millions | |
| Recent Price: 12.85 Smart Investing & Trading Score: 17 | |
| Day Percent Change: -1.91% Day Change: -0.25 | |
| Week Change: -1.53% Year-to-date Change: 18.7% | |
| GEO Links: Profile News Message Board | |
| Charts:- Daily , Weekly | |
| Add GEO to Watchlist: View: Get Complete GEO Trend Analysis ➞ | |
 | FFWM First Foundation Inc. |
| Sector: Financials | |
| SubSector: Regional - Midwest Banks | |
| MarketCap: 457.17 Millions | |
| Recent Price: 5.70 Smart Investing & Trading Score: 27 | |
| Day Percent Change: 0.00% Day Change: 0.00 | |
| Week Change: -1.55% Year-to-date Change: -41.1% | |
| FFWM Links: Profile News Message Board | |
| Charts:- Daily , Weekly | |
| Add FFWM to Watchlist: View: Get Complete FFWM Trend Analysis ➞ | |
 | WSR Whitestone REIT |
| Sector: Financials | |
| SubSector: REIT - Retail | |
| MarketCap: 316.114 Millions | |
| Recent Price: 13.16 Smart Investing & Trading Score: 76 | |
| Day Percent Change: -2.45% Day Change: -0.33 | |
| Week Change: -1.64% Year-to-date Change: 7.1% | |
| WSR Links: Profile News Message Board | |
| Charts:- Daily , Weekly | |
| Add WSR to Watchlist: View: Get Complete WSR Trend Analysis ➞ | |
 | HCI HCI Group, Inc. |
| Sector: Financials | |
| SubSector: Property & Casualty Insurance | |
| MarketCap: 297.412 Millions | |
| Recent Price: 92.54 Smart Investing & Trading Score: 10 | |
| Day Percent Change: -1.47% Day Change: -1.38 | |
| Week Change: -1.65% Year-to-date Change: 5.9% | |
| HCI Links: Profile News Message Board | |
| Charts:- Daily , Weekly | |
| Add HCI to Watchlist: View: Get Complete HCI Trend Analysis ➞ | |
 | LGIH LGI Homes, Inc. |
| Sector: Financials | |
| SubSector: Real Estate Development | |
| MarketCap: 1316.49 Millions | |
| Recent Price: 92.00 Smart Investing & Trading Score: 10 | |
| Day Percent Change: -3.01% Day Change: -2.86 | |
| Week Change: -1.74% Year-to-date Change: -30.9% | |
| LGIH Links: Profile News Message Board | |
| Charts:- Daily , Weekly | |
| Add LGIH to Watchlist: View: Get Complete LGIH Trend Analysis ➞ | |
 | CHMG Chemung Financial Corporation |
| Sector: Financials | |
| SubSector: Regional - Pacific Banks | |
| MarketCap: 142.229 Millions | |
| Recent Price: 42.06 Smart Investing & Trading Score: 13 | |
| Day Percent Change: -0.33% Day Change: -0.14 | |
| Week Change: -1.84% Year-to-date Change: -15.5% | |
| CHMG Links: Profile News Message Board | |
| Charts:- Daily , Weekly | |
| Add CHMG to Watchlist: View: Get Complete CHMG Trend Analysis ➞ | |
 | DHIL Diamond Hill Investment Group, Inc. |
| Sector: Financials | |
| SubSector: Asset Management | |
| MarketCap: 316.203 Millions | |
| Recent Price: 143.89 Smart Investing & Trading Score: 10 | |
| Day Percent Change: -1.42% Day Change: -2.07 | |
| Week Change: -1.85% Year-to-date Change: -13.1% | |
| DHIL Links: Profile News Message Board | |
| Charts:- Daily , Weekly | |
| Add DHIL to Watchlist: View: Get Complete DHIL Trend Analysis ➞ | |
 | PAX Patria Investments Limited |
| Sector: Financials | |
| SubSector: Asset Management | |
| MarketCap: 2130 Millions | |
| Recent Price: 12.13 Smart Investing & Trading Score: 10 | |
| Day Percent Change: -1.46% Day Change: -0.18 | |
| Week Change: -1.86% Year-to-date Change: -22.7% | |
| PAX Links: Profile News Message Board | |
| Charts:- Daily , Weekly | |
| Add PAX to Watchlist: View: Get Complete PAX Trend Analysis ➞ | |
 | BSIG BrightSphere Investment Group Inc. |
| Sector: Financials | |
| SubSector: Asset Management | |
| MarketCap: 430.103 Millions | |
| Recent Price: 21.96 Smart Investing & Trading Score: 7 | |
| Day Percent Change: 0.83% Day Change: 0.18 | |
| Week Change: -2.01% Year-to-date Change: 14.6% | |
| BSIG Links: Profile News Message Board | |
| Charts:- Daily , Weekly | |
| Add BSIG to Watchlist: View: Get Complete BSIG Trend Analysis ➞ | |
 | HPP Hudson Pacific Properties, Inc. |
| Sector: Financials | |
| SubSector: REIT - Office | |
| MarketCap: 3267.16 Millions | |
| Recent Price: 4.85 Smart Investing & Trading Score: 57 | |
| Day Percent Change: -0.21% Day Change: -0.01 | |
| Week Change: -2.02% Year-to-date Change: -47.9% | |
| HPP Links: Profile News Message Board | |
| Charts:- Daily , Weekly | |
| Add HPP to Watchlist: View: Get Complete HPP Trend Analysis ➞ | |
 | ONL Orion Office REIT Inc. |
| Sector: Financials | |
| SubSector: REIT - Office | |
| MarketCap: 375 Millions | |
| Recent Price: 3.36 Smart Investing & Trading Score: 20 | |
| Day Percent Change: 0.90% Day Change: 0.03 | |
| Week Change: -2.04% Year-to-date Change: -41.3% | |
| ONL Links: Profile News Message Board | |
| Charts:- Daily , Weekly | |
| Add ONL to Watchlist: View: Get Complete ONL Trend Analysis ➞ | |
 | NKSH National Bankshares, Inc. |
| Sector: Financials | |
| SubSector: Regional - Mid-Atlantic Banks | |
| MarketCap: 209.759 Millions | |
| Recent Price: 29.20 Smart Investing & Trading Score: 45 | |
| Day Percent Change: -2.60% Day Change: -0.78 | |
| Week Change: -2.05% Year-to-date Change: -9.7% | |
| NKSH Links: Profile News Message Board | |
| Charts:- Daily , Weekly | |
| Add NKSH to Watchlist: View: Get Complete NKSH Trend Analysis ➞ | |
 | PLBC Plumas Bancorp |
| Sector: Financials | |
| SubSector: Regional - Pacific Banks | |
| MarketCap: 85.0829 Millions | |
| Recent Price: 34.32 Smart Investing & Trading Score: 18 | |
| Day Percent Change: -1.89% Day Change: -0.66 | |
| Week Change: -2.14% Year-to-date Change: -17.0% | |
| PLBC Links: Profile News Message Board | |
| Charts:- Daily , Weekly | |
| Add PLBC to Watchlist: View: Get Complete PLBC Trend Analysis ➞ | |
 | ARR ARMOUR Residential REIT, Inc. |
| Sector: Financials | |
| SubSector: Mortgage Investment | |
| MarketCap: 578.739 Millions | |
| Recent Price: 19.10 Smart Investing & Trading Score: 10 | |
| Day Percent Change: -1.24% Day Change: -0.24 | |
| Week Change: -2.25% Year-to-date Change: -1.1% | |
| ARR Links: Profile News Message Board | |
| Charts:- Daily , Weekly | |
| Add ARR to Watchlist: View: Get Complete ARR Trend Analysis ➞ | |
 | PGC Peapack-Gladstone Financial Corporation |
| Sector: Financials | |
| SubSector: Regional - Northeast Banks | |
| MarketCap: 284.399 Millions | |
| Recent Price: 21.45 Smart Investing & Trading Score: 32 | |
| Day Percent Change: -0.46% Day Change: -0.10 | |
| Week Change: -2.28% Year-to-date Change: -28.1% | |
| PGC Links: Profile News Message Board | |
| Charts:- Daily , Weekly | |
| Add PGC to Watchlist: View: Get Complete PGC Trend Analysis ➞ | |
 | FOR Forestar Group Inc. |
| Sector: Financials | |
| SubSector: Real Estate Development | |
| MarketCap: 661.019 Millions | |
| Recent Price: 31.40 Smart Investing & Trading Score: 10 | |
| Day Percent Change: -1.60% Day Change: -0.51 | |
| Week Change: -2.36% Year-to-date Change: -5.1% | |
| FOR Links: Profile News Message Board | |
| Charts:- Daily , Weekly | |
| Add FOR to Watchlist: View: Get Complete FOR Trend Analysis ➞ | |
 | CXW CoreCivic, Inc. |
| Sector: Financials | |
| SubSector: REIT - Diversified | |
| MarketCap: 1440.23 Millions | |
| Recent Price: 11.31 Smart Investing & Trading Score: 10 | |
| Day Percent Change: -2.08% Day Change: -0.24 | |
| Week Change: -2.58% Year-to-date Change: -22.2% | |
| CXW Links: Profile News Message Board | |
| Charts:- Daily , Weekly | |
| Add CXW to Watchlist: View: Get Complete CXW Trend Analysis ➞ | |
 | CBAN Colony Bankcorp, Inc. |
| Sector: Financials | |
| SubSector: Regional - Mid-Atlantic Banks | |
| MarketCap: 115.559 Millions | |
| Recent Price: 11.51 Smart Investing & Trading Score: 15 | |
| Day Percent Change: 0.31% Day Change: 0.04 | |
| Week Change: -2.62% Year-to-date Change: -13.5% | |
| CBAN Links: Profile News Message Board | |
| Charts:- Daily , Weekly | |
| Add CBAN to Watchlist: View: Get Complete CBAN Trend Analysis ➞ | |
 | SNFCA Security National Financial Corporation |
| Sector: Financials | |
| SubSector: Credit Services | |
| MarketCap: 81.0208 Millions | |
| Recent Price: 7.41 Smart Investing & Trading Score: 10 | |
| Day Percent Change: -1.40% Day Change: -0.10 | |
| Week Change: -2.69% Year-to-date Change: -17.7% | |
| SNFCA Links: Profile News Message Board | |
| Charts:- Daily , Weekly | |
| Add SNFCA to Watchlist: View: Get Complete SNFCA Trend Analysis ➞ | |
 | PAGS PagSeguro Digital Ltd. |
| Sector: Financials | |
| SubSector: Credit Services | |
| MarketCap: 6500.78 Millions | |
| Recent Price: 11.15 Smart Investing & Trading Score: 0 | |
| Day Percent Change: -2.19% Day Change: -0.25 | |
| Week Change: -2.71% Year-to-date Change: -10.6% | |
| PAGS Links: Profile News Message Board | |
| Charts:- Daily , Weekly | |
| Add PAGS to Watchlist: View: Get Complete PAGS Trend Analysis ➞ | |
| For tabular summary view of above stock list: Summary View ➞ 0 - 25 , 25 - 50 , 50 - 75 , 75 - 100 , 100 - 125 , 125 - 150 , 150 - 175 , 175 - 200 , 200 - 225 , 225 - 250 , 250 - 275 , 275 - 300 , 300 - 325 , 325 - 350 , 350 - 375 , 375 - 400 | ||
| Click To Change The Sort Order: By Market Cap or Company Size Performance: Year-to-date, Week and Day | |
| Select Chart Type: | ||
| Too many stocks? View smallcap stocks filtered by marketcap & sector |
| Marketcap: All SmallCap Stocks (default-no microcap), Large, Mid-Range, Small & MicroCap |
| Sector: Tech, Finance, Energy, Staples, Retail, Industrial, Materials, Utilities & Medical |
|
Best Stocks Today 12Stocks.com |
© 2024 12Stocks.com Terms & Conditions Privacy Contact Us
All Information Provided Only For Education And Not To Be Used For Investing or Trading. See Terms & Conditions


One More Thing ... Get Best Stocks Delivered Daily!
Never Ever Miss A Move With Our Top Ten Stocks Lists
Find Best Stocks In Any Market - Bull or Bear Market
Take A Peek At Our Top Ten Stocks Lists: Daily, Weekly, Year-to-Date & Top Trends
Find Best Stocks In Any Market - Bull or Bear Market
Take A Peek At Our Top Ten Stocks Lists: Daily, Weekly, Year-to-Date & Top Trends
Smallcap Stocks With Best Up Trends [0-bearish to 100-bullish]: Comtech Tele[100], Silk Road[100], La-Z-Boy [100], Rocket Lab[100], Intra-Cellular Therapies[100], Fossil Group[100], e.l.f. Beauty[100], Amkor [100], United Homes[100], Six Flags[100], Fortress Transportation[100]
Best Smallcap Stocks Year-to-Date:
Dominion Midstream[561.78%], CareMax [525.77%], Workhorse Group[422.22%], 2U [367.48%], Avidity Biosciences[330.75%], Virgin Galactic[313.47%], Janux [275.99%], Super Micro[223.55%], Longboard [210.72%], Summit [204.21%], NuScale Power[195.81%] Best Smallcap Stocks This Week:
Comtech Tele[91.75%], Xponential Fitness[38.51%], Aaron s[33.02%], Dominion Midstream[29.43%], Silk Road[25.46%], La-Z-Boy [20.7%], HomeStreet [19.18%], NuScale Power[16.48%], Babcock & Wilcox Enterprises[15.5%], Amkor [15%], TPI Composites[13.53%] Best Smallcap Stocks Daily:
Comtech Tele[87.33%], Dominion Midstream[35.79%], Silk Road[23.83%], Omega [21.69%], La-Z-Boy [19.39%], Rocket Lab[13.25%], NuScale Power[12.24%], Patterson [11.07%], Day One[10.56%], Intra-Cellular Therapies[9.54%], Origin Materials[9.43%]