
 Login Sign Up


| |||||
 |  | ||||

| 12Stocks.com Market Intelligence |
Best SmallCap Stocks
|
| In a hurry? Small Cap Stock Lists: Performance Trends Table, Stock Charts
Sort Small Cap stocks: Daily, Weekly, Year-to-Date, Market Cap & Trends. Filter Small Cap stocks list by sector: Show all, Tech, Finance, Energy, Staples, Retail, Industrial, Materials, Utilities and HealthCare Filter Small Cap stocks list by size: All Large Medium Small and MicroCap |
| 12Stocks.com Small Cap Stocks Performances & Trends Daily | |||||||||
|
|  The overall Smart Investing & Trading Score is 18 (0-bearish to 100-bullish) which puts Small Cap index in short term bearish trend. The Smart Investing & Trading Score from previous trading session is 32 and hence a deterioration of trend.
| ||||||||
Here are the Smart Investing & Trading Scores of the most requested small cap stocks at 12Stocks.com (click stock name for detailed review):
|


| 12Stocks.com: Investing in Smallcap Index with Stocks | |
|
The following table helps investors and traders sort through current performance and trends (as measured by Smart Investing & Trading Score) of various
stocks in the Smallcap Index. Quick View: Move mouse or cursor over stock symbol (ticker) to view short-term technical chart and over stock name to view long term chart. Click on  to add stock symbol to your watchlist and to add stock symbol to your watchlist and  to view watchlist. Click on any ticker or stock name for detailed market intelligence report for that stock. to view watchlist. Click on any ticker or stock name for detailed market intelligence report for that stock. |
12Stocks.com Performance of Stocks in Smallcap Index
| Ticker | Stock Name | Watchlist | Category | Recent Price | Smart Investing & Trading Score | Change % | YTD Change% |
| WAFD | Washington Federal |   | Financials | 26.54 | 25 | -1.89% | -19.48% |
| CVBF | CVB Financial | | Financials | 16.23 | 25 | -1.81% | -19.61% |
| WTBA | West Ban | | Financials | 17.03 | 42 | -0.38% | -19.67% |
| FCCO | First Community | | Financials | 17.25 | 67 | 4.99% | -19.88% |
| TSBK | Timberland Bancorp | | Financials | 25.20 | 52 | -1.60% | -19.90% |
| SBCF | Seacoast Banking | | Financials | 22.78 | 25 | -1.68% | -19.96% |
| FRBA | First Bank | | Financials | 11.74 | 35 | -2.33% | -20.14% |
| SAFE | Safehold | | Financials | 18.68 | 28 | -1.16% | -20.17% |
| HAFC | Hanmi Financial | | Financials | 15.48 | 43 | -1.40% | -20.21% |
| HFWA | Heritage Financial | | Financials | 17.05 | 18 | -1.62% | -20.29% |
| CATY | Cathay General | | Financials | 35.50 | 8 | -1.77% | -20.35% |
| HTBK | Heritage Commerce | | Financials | 7.89 | 35 | -1.87% | -20.46% |
| OVLY | Oak Valley | | Financials | 23.81 | 42 | 0.55% | -20.50% |
| CIO | City Office | | Financials | 4.85 | 42 | 3.19% | -20.62% |
| MSBI | Midland States | | Financials | 21.82 | 8 | -2.63% | -20.83% |
| WASH | Washington Trust | | Financials | 25.63 | 35 | -1.31% | -20.85% |
| PX | P10 | | Financials | 8.06 | 53 | -0.12% | -21.14% |
| ARL | American Realty | | Financials | 13.72 | 18 | 0.15% | -21.19% |
| KW | Kennedy-Wilson | | Financials | 9.75 | 54 | -0.41% | -21.24% |
| CLDT | Chatham Lodging | | Financials | 8.44 | 35 | -0.12% | -21.27% |
| AMBC | Ambac Financial | | Financials | 12.94 | 18 | -0.77% | -21.48% |
| NAVI | Navient | | Financials | 14.57 | 42 | 0.69% | -21.75% |
| BOH | Bank of Hawaii | | Financials | 56.59 | 43 | -0.91% | -21.90% |
| PFIS | Peoples Financial | | Financials | 37.98 | 18 | -0.13% | -22.01% |
| CNOB | ConnectOne Bancorp | | Financials | 17.85 | 18 | -1.71% | -22.09% |
| For chart view version of above stock list: Chart View ➞ 0 - 25 , 25 - 50 , 50 - 75 , 75 - 100 , 100 - 125 , 125 - 150 , 150 - 175 , 175 - 200 , 200 - 225 , 225 - 250 , 250 - 275 , 275 - 300 , 300 - 325 , 325 - 350 , 350 - 375 , 375 - 400 | ||
 | Click To Change The Sort Order: By Market Cap or Company Size Performance: Year-to-date, Week and Day |  |
| Too many stocks? View smallcap stocks filtered by marketcap & sector |
| Marketcap: All SmallCap Stocks (default-no microcap), Large, Mid-Range, Small |
| Smallcap Sector: Tech, Finance, Energy, Staples, Retail, Industrial, Materials, & Medical |
|
Get the most comprehensive stock market coverage daily at 12Stocks.com ➞ Best Stocks Today ➞ Best Stocks Weekly ➞ Best Stocks Year-to-Date ➞ Best Stocks Trends ➞  Best Stocks Today 12Stocks.com Best Nasdaq Stocks ➞ Best S&P 500 Stocks ➞ Best Tech Stocks ➞ Best Biotech Stocks ➞ |
| Detailed Overview of SmallCap Stocks |
| SmallCap Technical Overview, Leaders & Laggards, Top SmallCap ETF Funds & Detailed SmallCap Stocks List, Charts, Trends & More |
| Smallcap: Technical Analysis, Trends & YTD Performance | |
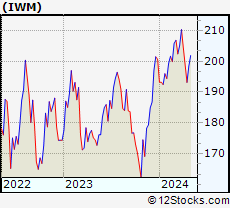
| SmallCap segment as represented by
IWM, an exchange-traded fund [ETF], holds basket of thousands of smallcap stocks from across all major sectors of the US stock market. The smallcap index (contains stocks like Riverbed & Sotheby's) is up by 0.61% and is currently underperforming the overall market by -11.9% year-to-date. Below is a quick view of technical charts and trends: | |
 IWM Weekly Chart |
|
| Long Term Trend: Not Good | |
| Medium Term Trend: Not Good | |
 IWM Daily Chart |
|
| Short Term Trend: Very Good | |
| Overall Trend Score: 18 | |
| YTD Performance: 0.61% | |
| **Trend Scores & Views Are Only For Educational Purposes And Not For Investing | |
| 12Stocks.com: Top Performing Small Cap Index Stocks | ||||||||||||||||||||||||||||||||||||||||||||||||
 The top performing Small Cap Index stocks year to date are
Now, more recently, over last week, the top performing Small Cap Index stocks on the move are


|
||||||||||||||||||||||||||||||||||||||||||||||||
| 12Stocks.com: Investing in Smallcap Index using Exchange Traded Funds | |
|
The following table shows list of key exchange traded funds (ETF) that
help investors track Smallcap index. The following list also includes leveraged ETF funds that track twice or thrice the daily returns of Smallcap indices. Short or inverse ETF funds move in the opposite direction to the index they track and are useful during market pullbacks or during bear markets. Quick View: Move mouse or cursor over ETF symbol (ticker) to view short-term technical chart and over ETF name to view long term chart. Click on ticker or stock name for detailed view. Click on to add stock symbol to your watchlist and to view watchlist. |
12Stocks.com List of ETFs that track Smallcap Index
| Ticker | ETF Name | Watchlist | Recent Price | Smart Investing & Trading Score | Change % | Week % | Year-to-date % |
| IWM | iShares Russell 2000 | | 201.94 | 18 | -0.87 | 0.37 | 0.61% |
| IJR | iShares Core S&P Small-Cap | | 106.26 | 18 | -0.98 | -0.76 | -1.84% |
| VTWO | Vanguard Russell 2000 ETF | | 81.88 | 18 | -0.92 | 0.61 | 0.96% |
| IWN | iShares Russell 2000 Value | | 151.10 | 18 | -1.05 | -0.66 | -2.72% |
| IJT | iShares S&P Small-Cap 600 Growth | | 128.13 | 18 | -1.03 | 0.02 | 2.39% |
| IWO | iShares Russell 2000 Growth | | 262.07 | 28 | -0.78 | 0.61 | 3.91% |
| IJS | iShares S&P Small-Cap 600 Value | | 96.64 | 18 | -1.11 | -1.32 | -6.24% |
| SMLV | SPDR SSGA US Small Cap Low Volatil ETF | | 107.45 | 18 | -0.89 | -0.55 | -4.51% |
| XSLV | PowerShares S&P SmallCap Low Volatil ETF | | 43.18 | 23 | -0.37 | -0.49 | -2.2% |
| SDD | ProShares UltraShort SmallCap600 | | 19.36 | 93 | 4.42 | 1.69 | 5.07% |
| SBB | ProShares Short SmallCap600 | | 16.37 | 93 | 1.61 | 0.49 | 2.76% |
| SAA | ProShares Ultra SmallCap600 | | 23.17 | 18 | -2.18 | -0.57 | -7.12% |
| 12Stocks.com: Charts, Trends, Fundamental Data and Performances of SmallCap Stocks | |
|
We now take in-depth look at all SmallCap stocks including charts, multi-period performances and overall trends (as measured by Smart Investing & Trading Score). One can sort SmallCap stocks (click link to choose) by Daily, Weekly and by Year-to-Date performances. Also, one can sort by size of the company or by market capitalization. |
| Select Your Default Chart Type: | |||||
| |||||
| Click on stock symbol or name for detailed view. Click on to add stock symbol to your watchlist and to view watchlist. Quick View: Move mouse or cursor over "Daily" to quickly view daily technical stock chart and over "Weekly" to view weekly technical stock chart. | |||||

 | WAFD Washington Federal, Inc. |
| Sector: Financials | |
| SubSector: Savings & Loans | |
| MarketCap: 2219.2 Millions | |
| Recent Price: 26.54 Smart Investing & Trading Score: 25 | |
| Day Percent Change: -1.89% Day Change: -0.51 | |
| Week Change: -1.63% Year-to-date Change: -19.5% | |
| WAFD Links: Profile News Message Board | |
| Charts:- Daily , Weekly | |
| Add WAFD to Watchlist: View: Get Complete WAFD Trend Analysis ➞ | |
 | CVBF CVB Financial Corp. |
| Sector: Financials | |
| SubSector: Regional - Pacific Banks | |
| MarketCap: 2699.99 Millions | |
| Recent Price: 16.23 Smart Investing & Trading Score: 25 | |
| Day Percent Change: -1.81% Day Change: -0.30 | |
| Week Change: -1.4% Year-to-date Change: -19.6% | |
| CVBF Links: Profile News Message Board | |
| Charts:- Daily , Weekly | |
| Add CVBF to Watchlist: View: Get Complete CVBF Trend Analysis ➞ | |
 | WTBA West Bancorporation, Inc. |
| Sector: Financials | |
| SubSector: Regional - Southwest Banks | |
| MarketCap: 272.965 Millions | |
| Recent Price: 17.03 Smart Investing & Trading Score: 42 | |
| Day Percent Change: -0.38% Day Change: -0.06 | |
| Week Change: 0.83% Year-to-date Change: -19.7% | |
| WTBA Links: Profile News Message Board | |
| Charts:- Daily , Weekly | |
| Add WTBA to Watchlist: View: Get Complete WTBA Trend Analysis ➞ | |
 | FCCO First Community Corporation |
| Sector: Financials | |
| SubSector: Regional - Southwest Banks | |
| MarketCap: 123.865 Millions | |
| Recent Price: 17.25 Smart Investing & Trading Score: 67 | |
| Day Percent Change: 4.99% Day Change: 0.82 | |
| Week Change: 6.91% Year-to-date Change: -19.9% | |
| FCCO Links: Profile News Message Board | |
| Charts:- Daily , Weekly | |
| Add FCCO to Watchlist: View: Get Complete FCCO Trend Analysis ➞ | |
 | TSBK Timberland Bancorp, Inc. |
| Sector: Financials | |
| SubSector: Savings & Loans | |
| MarketCap: 155.03 Millions | |
| Recent Price: 25.20 Smart Investing & Trading Score: 52 | |
| Day Percent Change: -1.60% Day Change: -0.41 | |
| Week Change: 0.88% Year-to-date Change: -19.9% | |
| TSBK Links: Profile News Message Board | |
| Charts:- Daily , Weekly | |
| Add TSBK to Watchlist: View: Get Complete TSBK Trend Analysis ➞ | |
 | SBCF Seacoast Banking Corporation of Florida |
| Sector: Financials | |
| SubSector: Regional - Mid-Atlantic Banks | |
| MarketCap: 881.559 Millions | |
| Recent Price: 22.78 Smart Investing & Trading Score: 25 | |
| Day Percent Change: -1.68% Day Change: -0.39 | |
| Week Change: 0.18% Year-to-date Change: -20.0% | |
| SBCF Links: Profile News Message Board | |
| Charts:- Daily , Weekly | |
| Add SBCF to Watchlist: View: Get Complete SBCF Trend Analysis ➞ | |
 | FRBA First Bank |
| Sector: Financials | |
| SubSector: Regional - Mid-Atlantic Banks | |
| MarketCap: 124.859 Millions | |
| Recent Price: 11.74 Smart Investing & Trading Score: 35 | |
| Day Percent Change: -2.33% Day Change: -0.28 | |
| Week Change: -0.04% Year-to-date Change: -20.1% | |
| FRBA Links: Profile News Message Board | |
| Charts:- Daily , Weekly | |
| Add FRBA to Watchlist: View: Get Complete FRBA Trend Analysis ➞ | |
 | SAFE Safehold Inc. |
| Sector: Financials | |
| SubSector: REIT - Diversified | |
| MarketCap: 2994.63 Millions | |
| Recent Price: 18.68 Smart Investing & Trading Score: 28 | |
| Day Percent Change: -1.16% Day Change: -0.22 | |
| Week Change: -1.99% Year-to-date Change: -20.2% | |
| SAFE Links: Profile News Message Board | |
| Charts:- Daily , Weekly | |
| Add SAFE to Watchlist: View: Get Complete SAFE Trend Analysis ➞ | |
 | HAFC Hanmi Financial Corporation |
| Sector: Financials | |
| SubSector: Regional - Pacific Banks | |
| MarketCap: 319.929 Millions | |
| Recent Price: 15.48 Smart Investing & Trading Score: 43 | |
| Day Percent Change: -1.40% Day Change: -0.22 | |
| Week Change: -0.58% Year-to-date Change: -20.2% | |
| HAFC Links: Profile News Message Board | |
| Charts:- Daily , Weekly | |
| Add HAFC to Watchlist: View: Get Complete HAFC Trend Analysis ➞ | |
 | HFWA Heritage Financial Corporation |
| Sector: Financials | |
| SubSector: Regional - Pacific Banks | |
| MarketCap: 752.829 Millions | |
| Recent Price: 17.05 Smart Investing & Trading Score: 18 | |
| Day Percent Change: -1.62% Day Change: -0.28 | |
| Week Change: -1.84% Year-to-date Change: -20.3% | |
| HFWA Links: Profile News Message Board | |
| Charts:- Daily , Weekly | |
| Add HFWA to Watchlist: View: Get Complete HFWA Trend Analysis ➞ | |
 | CATY Cathay General Bancorp |
| Sector: Financials | |
| SubSector: Regional - Pacific Banks | |
| MarketCap: 1781.99 Millions | |
| Recent Price: 35.50 Smart Investing & Trading Score: 8 | |
| Day Percent Change: -1.77% Day Change: -0.64 | |
| Week Change: -2.63% Year-to-date Change: -20.4% | |
| CATY Links: Profile News Message Board | |
| Charts:- Daily , Weekly | |
| Add CATY to Watchlist: View: Get Complete CATY Trend Analysis ➞ | |
 | HTBK Heritage Commerce Corp |
| Sector: Financials | |
| SubSector: Regional - Pacific Banks | |
| MarketCap: 416.129 Millions | |
| Recent Price: 7.89 Smart Investing & Trading Score: 35 | |
| Day Percent Change: -1.87% Day Change: -0.15 | |
| Week Change: -1.13% Year-to-date Change: -20.5% | |
| HTBK Links: Profile News Message Board | |
| Charts:- Daily , Weekly | |
| Add HTBK to Watchlist: View: Get Complete HTBK Trend Analysis ➞ | |
 | OVLY Oak Valley Bancorp |
| Sector: Financials | |
| SubSector: Regional - Pacific Banks | |
| MarketCap: 148.429 Millions | |
| Recent Price: 23.81 Smart Investing & Trading Score: 42 | |
| Day Percent Change: 0.55% Day Change: 0.13 | |
| Week Change: 2.19% Year-to-date Change: -20.5% | |
| OVLY Links: Profile News Message Board | |
| Charts:- Daily , Weekly | |
| Add OVLY to Watchlist: View: Get Complete OVLY Trend Analysis ➞ | |
 | CIO City Office REIT, Inc. |
| Sector: Financials | |
| SubSector: REIT - Office | |
| MarketCap: 478.566 Millions | |
| Recent Price: 4.85 Smart Investing & Trading Score: 42 | |
| Day Percent Change: 3.19% Day Change: 0.15 | |
| Week Change: -1.22% Year-to-date Change: -20.6% | |
| CIO Links: Profile News Message Board | |
| Charts:- Daily , Weekly | |
| Add CIO to Watchlist: View: Get Complete CIO Trend Analysis ➞ | |
 | MSBI Midland States Bancorp, Inc. |
| Sector: Financials | |
| SubSector: Regional - Midwest Banks | |
| MarketCap: 400.27 Millions | |
| Recent Price: 21.82 Smart Investing & Trading Score: 8 | |
| Day Percent Change: -2.63% Day Change: -0.59 | |
| Week Change: -2.37% Year-to-date Change: -20.8% | |
| MSBI Links: Profile News Message Board | |
| Charts:- Daily , Weekly | |
| Add MSBI to Watchlist: View: Get Complete MSBI Trend Analysis ➞ | |
 | WASH Washington Trust Bancorp, Inc. |
| Sector: Financials | |
| SubSector: Regional - Northeast Banks | |
| MarketCap: 590.099 Millions | |
| Recent Price: 25.63 Smart Investing & Trading Score: 35 | |
| Day Percent Change: -1.31% Day Change: -0.34 | |
| Week Change: -1.16% Year-to-date Change: -20.9% | |
| WASH Links: Profile News Message Board | |
| Charts:- Daily , Weekly | |
| Add WASH to Watchlist: View: Get Complete WASH Trend Analysis ➞ | |
 | PX P10, Inc. |
| Sector: Financials | |
| SubSector: Asset Management | |
| MarketCap: 1300 Millions | |
| Recent Price: 8.06 Smart Investing & Trading Score: 53 | |
| Day Percent Change: -0.12% Day Change: -0.01 | |
| Week Change: -0.49% Year-to-date Change: -21.1% | |
| PX Links: Profile News Message Board | |
| Charts:- Daily , Weekly | |
| Add PX to Watchlist: View: Get Complete PX Trend Analysis ➞ | |
 | ARL American Realty Investors, Inc. |
| Sector: Financials | |
| SubSector: Property Management | |
| MarketCap: 132.242 Millions | |
| Recent Price: 13.72 Smart Investing & Trading Score: 18 | |
| Day Percent Change: 0.15% Day Change: 0.02 | |
| Week Change: -1.01% Year-to-date Change: -21.2% | |
| ARL Links: Profile News Message Board | |
| Charts:- Daily , Weekly | |
| Add ARL to Watchlist: View: Get Complete ARL Trend Analysis ➞ | |
 | KW Kennedy-Wilson Holdings, Inc. |
| Sector: Financials | |
| SubSector: Property Management | |
| MarketCap: 2025.42 Millions | |
| Recent Price: 9.75 Smart Investing & Trading Score: 54 | |
| Day Percent Change: -0.41% Day Change: -0.04 | |
| Week Change: -1.12% Year-to-date Change: -21.2% | |
| KW Links: Profile News Message Board | |
| Charts:- Daily , Weekly | |
| Add KW to Watchlist: View: Get Complete KW Trend Analysis ➞ | |
 | CLDT Chatham Lodging Trust |
| Sector: Financials | |
| SubSector: REIT - Hotel/Motel | |
| MarketCap: 274.734 Millions | |
| Recent Price: 8.44 Smart Investing & Trading Score: 35 | |
| Day Percent Change: -0.12% Day Change: -0.01 | |
| Week Change: -1.52% Year-to-date Change: -21.3% | |
| CLDT Links: Profile News Message Board | |
| Charts:- Daily , Weekly | |
| Add CLDT to Watchlist: View: Get Complete CLDT Trend Analysis ➞ | |
 | AMBC Ambac Financial Group, Inc. |
| Sector: Financials | |
| SubSector: Surety & Title Insurance | |
| MarketCap: 587.818 Millions | |
| Recent Price: 12.94 Smart Investing & Trading Score: 18 | |
| Day Percent Change: -0.77% Day Change: -0.10 | |
| Week Change: -0.23% Year-to-date Change: -21.5% | |
| AMBC Links: Profile News Message Board | |
| Charts:- Daily , Weekly | |
| Add AMBC to Watchlist: View: Get Complete AMBC Trend Analysis ➞ | |
 | NAVI Navient Corporation |
| Sector: Financials | |
| SubSector: Credit Services | |
| MarketCap: 1362.48 Millions | |
| Recent Price: 14.57 Smart Investing & Trading Score: 42 | |
| Day Percent Change: 0.69% Day Change: 0.10 | |
| Week Change: 1.25% Year-to-date Change: -21.8% | |
| NAVI Links: Profile News Message Board | |
| Charts:- Daily , Weekly | |
| Add NAVI to Watchlist: View: Get Complete NAVI Trend Analysis ➞ | |
 | BOH Bank of Hawaii Corporation |
| Sector: Financials | |
| SubSector: Regional - Pacific Banks | |
| MarketCap: 2305.19 Millions | |
| Recent Price: 56.59 Smart Investing & Trading Score: 43 | |
| Day Percent Change: -0.91% Day Change: -0.52 | |
| Week Change: -0.54% Year-to-date Change: -21.9% | |
| BOH Links: Profile News Message Board | |
| Charts:- Daily , Weekly | |
| Add BOH to Watchlist: View: Get Complete BOH Trend Analysis ➞ | |
 | PFIS Peoples Financial Services Corp. |
| Sector: Financials | |
| SubSector: Regional - Northeast Banks | |
| MarketCap: 305.499 Millions | |
| Recent Price: 37.98 Smart Investing & Trading Score: 18 | |
| Day Percent Change: -0.13% Day Change: -0.05 | |
| Week Change: -0.96% Year-to-date Change: -22.0% | |
| PFIS Links: Profile News Message Board | |
| Charts:- Daily , Weekly | |
| Add PFIS to Watchlist: View: Get Complete PFIS Trend Analysis ➞ | |
 | CNOB ConnectOne Bancorp, Inc. |
| Sector: Financials | |
| SubSector: Regional - Northeast Banks | |
| MarketCap: 491.899 Millions | |
| Recent Price: 17.85 Smart Investing & Trading Score: 18 | |
| Day Percent Change: -1.71% Day Change: -0.31 | |
| Week Change: -1.27% Year-to-date Change: -22.1% | |
| CNOB Links: Profile News Message Board | |
| Charts:- Daily , Weekly | |
| Add CNOB to Watchlist: View: Get Complete CNOB Trend Analysis ➞ | |
| For tabular summary view of above stock list: Summary View ➞ 0 - 25 , 25 - 50 , 50 - 75 , 75 - 100 , 100 - 125 , 125 - 150 , 150 - 175 , 175 - 200 , 200 - 225 , 225 - 250 , 250 - 275 , 275 - 300 , 300 - 325 , 325 - 350 , 350 - 375 , 375 - 400 | ||
| Click To Change The Sort Order: By Market Cap or Company Size Performance: Year-to-date, Week and Day | |
| Select Chart Type: | ||
| Too many stocks? View smallcap stocks filtered by marketcap & sector |
| Marketcap: All SmallCap Stocks (default-no microcap), Large, Mid-Range, Small & MicroCap |
| Sector: Tech, Finance, Energy, Staples, Retail, Industrial, Materials, Utilities & Medical |
|
Best Stocks Today 12Stocks.com |
© 2024 12Stocks.com Terms & Conditions Privacy Contact Us
All Information Provided Only For Education And Not To Be Used For Investing or Trading. See Terms & Conditions


One More Thing ... Get Best Stocks Delivered Daily!
Never Ever Miss A Move With Our Top Ten Stocks Lists
Find Best Stocks In Any Market - Bull or Bear Market
Take A Peek At Our Top Ten Stocks Lists: Daily, Weekly, Year-to-Date & Top Trends
Find Best Stocks In Any Market - Bull or Bear Market
Take A Peek At Our Top Ten Stocks Lists: Daily, Weekly, Year-to-Date & Top Trends
Smallcap Stocks With Best Up Trends [0-bearish to 100-bullish]: UroGen Pharma[100], Omeros [100], United Homes[100], Korn Ferry[100], Vanda [100], Terns [100], XOMA [100], MannKind [100], Farmland Partners[100], Avidity Biosciences[100], Rackspace [100]
Best Smallcap Stocks Year-to-Date:
CareMax [507.22%], Li-Cycle [475.47%], Dominion Midstream[421.97%], Avidity Biosciences[342.04%], Janux [294.32%], Stoke [232.89%], Longboard [226.51%], Novavax [213.54%], Summit [209.96%], Super Micro[206.44%], Sweetgreen [198.14%] Best Smallcap Stocks This Week:
Dominion Midstream[700%], Avidity Biosciences[50.23%], Kaltura [44.96%], Biomea Fusion[40.34%], Eos Energy[37.01%], Scilex Holding[36.7%], UroGen Pharma[32.32%], Arcutis Bio[29.28%], Nerdy [27.21%], Li-Cycle [26.5%], Redwire [25.33%] Best Smallcap Stocks Daily:
UroGen Pharma[37.42%], Biomea Fusion[25.62%], Arcutis Bio[15.56%], Super Micro[12.44%], Omeros [12.20%], United Homes[11.35%], Korn Ferry[10.82%], Immuneering [10.46%], Tango [10.10%], Vanda [9.80%], Fossil Group[9.56%]