
 Login Sign Up


| |||||
 |  | ||||

| 12Stocks.com Market Intelligence |
Best Nasdaq Stocks
|
On this page, you will find the most comprehensive analysis of Nasdaq 100 stocks and ETFs - from latest trends to performances to charts ➞. First, here are the year-to-date (YTD) performances of the most requested Nasdaq stocks at 12Stocks.com (click stock for review):
| NVIDIA 68% | ||
| Amazon.com 18% | ||
| Google 17% | ||
| QUALCOMM 13% | ||
| Netflix 13% | ||
| Costco 9% | ||
| Microsoft 5% | ||
| Amgen -4% | ||
| Apple -12% | ||
| Expedia -12% | ||
| Baidu -12% | ||
| Comcast -13% | ||
| Biogen -16% | ||
| Gilead -19% | ||
| Starbucks -22% | ||
| Tesla -28% | ||
| Intel -40% | ||
| Nasdaq 100 Stocks Lists: Performances & Trends, Nasdaq 100 Stock Charts
Sort Nasdaq 100 stocks: Daily, Weekly, Year-to-Date, Market Cap & Trends. |
| 12Stocks.com Nasdaq Stocks Performances & Trends Daily Report | |||||||||
|
| 
The overall Smart Investing & Trading Score is 7 (0-bearish to 100-bullish) which puts Nasdaq index in short term bearish trend. The Smart Investing & Trading Score from previous trading session is 41 and hence a deterioration of trend. | ||||||||
| Here are the Smart Investing & Trading Scores of the most requested Nasdaq 100 stocks at 12Stocks.com (click stock name for detailed review): |


| 12Stocks.com: Top Performing Nasdaq 100 Index Stocks | ||||||||||||||||||||||||||||||||||||||||||||||||
 The top performing Nasdaq 100 Index stocks year to date are
Now, more recently, over last week, the top performing Nasdaq 100 Index stocks on the move are


|
||||||||||||||||||||||||||||||||||||||||||||||||
| 12Stocks.com: Investing in Nasdaq 100 Index with Stocks | |
|
The following table helps investors and traders sort through current performance and trends (as measured by Smart Investing & Trading Score) of various
stocks in the Nasdaq 100 Index. Quick View: Move mouse or cursor over stock symbol (ticker) to view short-term technical chart and over stock name to view long term chart. Click on  to add stock symbol to your watchlist and to add stock symbol to your watchlist and  to view watchlist. Click on any ticker or stock name for detailed market intelligence report for that stock. to view watchlist. Click on any ticker or stock name for detailed market intelligence report for that stock. |
12Stocks.com Performance of Stocks in Nasdaq 100 Index
| Ticker | Stock Name | Watchlist | Category | Recent Price | Smart Investing & Trading Score | Change % | YTD Change% |
| REGN | Regeneron |   | Health Care | 903.48 | 50 | 1.44% | 2.87% |
| EA | Electronic Arts | | Technology | 128.18 | 49 | 1.07% | -6.31% |
| ADI | Analog Devices | | Technology | 193.89 | 48 | -3.35% | -2.35% |
| MU | Micron | | Technology | 109.70 | 48 | -2.89% | 28.54% |
| MDB | MongoDB | | Technology | 373.33 | 44 | 2.23% | -8.69% |
| DASH | DoorDash | | Technology | 127.46 | 43 | -1.39% | 29.00% |
| KHC | Kraft Heinz | | Consumer Staples | 36.28 | 41 | -6.03% | -1.89% |
| CSGP | CoStar | | Financials | 90.36 | 41 | -1.28% | 3.40% |
| MDLZ | Mondelez | | Consumer Staples | 70.69 | 40 | -1.74% | -2.40% |
| QCOM | QUALCOMM | | Technology | 164.11 | 38 | -1.05% | 13.47% |
| PDD | Pinduoduo | | Services & Goods | 124.49 | 38 | -0.55% | -14.91% |
| SIRI | Sirius XM | | Services & Goods | 3.05 | 35 | 3.74% | -44.24% |
| GILD | Gilead | | Health Care | 65.51 | 35 | 0.48% | -19.13% |
| ODFL | Old Dominion | | Transports | 182.49 | 35 | 0.43% | -54.98% |
| TTWO | Take-Two Interactive | | Technology | 142.74 | 34 | -0.05% | -11.31% |
| DXCM | DexCom | | Health Care | 125.88 | 34 | -1.19% | 1.44% |
| CPRT | Copart | | Services & Goods | 54.44 | 33 | 0.24% | 11.10% |
| NVDA | NVIDIA | | Technology | 830.41 | 33 | -3.89% | 67.69% |
| PANW | Palo Alto | | Technology | 287.34 | 32 | -1.22% | -2.56% |
| FANG | Diamondback Energy | | Energy | 196.01 | 31 | -2.55% | 26.39% |
| CEG | Constellation Energy | | Utilities | 184.63 | 31 | -0.70% | 57.66% |
| BKR | Baker Hughes | | Services & Goods | 31.89 | 26 | -2.24% | -6.70% |
| LULU | Lululemon Athletica | | Consumer Staples | 354.40 | 25 | -1.72% | -30.69% |
| WBA | Walgreens Boots | | Services & Goods | 17.34 | 20 | -2.20% | -33.59% |
| MNST | Monster Beverage | | Consumer Staples | 53.54 | 18 | 0.17% | -7.06% |
| CRWD | CrowdStrike | | Technology | 295.44 | 17 | 0.99% | 15.71% |
| FTNT | Fortinet | | Technology | 63.53 | 17 | 0.55% | 8.54% |
| FAST | Fastenal | | Services & Goods | 68.18 | 17 | 0.35% | 5.26% |
| ISRG | Intuitive Surgical | | Health Care | 371.70 | 17 | 0.29% | 10.18% |
| DLTR | Dollar Tree | | Services & Goods | 118.56 | 17 | 0.26% | -16.54% |
| For chart view version of above stock list: Chart View ➞ 0 - 30 , 30 - 60 , 60 - 90 , 90 - 120 | ||
 | Click To Change The Sort Order: By Market Cap or Company Size Performance: Year-to-date, Week and Day |  |
|
Get the most comprehensive stock market coverage daily at 12Stocks.com ➞ Best Stocks Today ➞ Best Stocks Weekly ➞ Best Stocks Year-to-Date ➞ Best Stocks Trends ➞  Best Stocks Today 12Stocks.com Best Dow Stocks ➞ Best S&P 500 Stocks ➞ Best Tech Stocks ➞ Best Biotech Stocks ➞ |
| Detailed Overview of Nasdaq 100 Stocks |
| Nasdaq 100 Technical Overview, Leaders & Laggards, Top Nasdaq 100 ETF Funds & Detailed Nasdaq 100 Stocks List, Charts, Trends & More |
| Nasdaq 100: Technical Analysis, Trends & YTD Performance | |
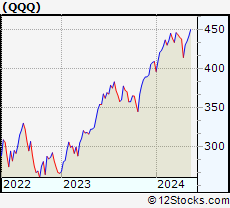
| Nasdaq 100 index as represented by
QQQ, an exchange-traded fund [ETF], holds basket of one hundred (mostly largecap) stocks from technology, biotech & retail sectors of the US stock market. The Nasdaq 100 index (contains stocks like Apple and Amgen) is up by 2.93% and is currently underperforming the overall market by -1.61% year-to-date. Below is a quick view of technical charts and trends: | |
 QQQ Weekly Chart |
|
| Long Term Trend: Not Good | |
| Medium Term Trend: Not Good | |
 QQQ Daily Chart |
|
| Short Term Trend: Not Good | |
| Overall Trend Score: 7 | |
| YTD Performance: 2.93% | |
| **Trend Scores & Views Are Only For Educational Purposes And Not For Investing | |
| 12Stocks.com: Investing in Nasdaq 100 Index using Exchange Traded Funds | |
|
The following table shows list of key exchange traded funds (ETF) that
help investors track Nasdaq 100 index. The following list also includes leveraged ETF funds that track twice or thrice the daily returns of Nasdaq 100 indices. Short or inverse ETF funds move in the opposite direction to the index they track and are useful during market pullbacks or during bear markets. Quick View: Move mouse or cursor over ETF symbol (ticker) to view short-term technical chart and over ETF name to view long term chart. Click on ticker or stock name for detailed view. Click on to add stock symbol to your watchlist and to view watchlist. |
12Stocks.com List of ETFs that track Nasdaq 100 Index
| Ticker | ETF Name | Watchlist | Recent Price | Smart Investing & Trading Score | Change % | Week % | Year-to-date % |
| SQQQ | ProShares UltraPro Short QQQ | | 12.22 | 88 | 2.26 | 6.91 | -9.14% |
| TQQQ | ProShares UltraPro QQQ | | 51.60 | 7 | -2.15 | -6.66 | 1.78% |
| QQQ | PowerShares QQQ ETF | | 421.52 | 7 | -0.72 | -2.2 | 2.93% |
| QID | ProShares UltraShort QQQ | | 49.90 | 88 | 1.51 | 4.61 | -5.94% |
| QLD | ProShares Ultra QQQ | | 78.15 | 7 | -1.48 | -4.5 | 2.83% |
| QYLD | Recon Capital NASDAQ 100 Cov Call ETF | | 17.39 | 7 | -0.11 | -0.51 | 0.29% |
| QQQE | Direxion NASDAQ-100 Equal Wtd ETF | | 83.87 | 0 | -0.68 | -1.95 | -0.91% |
| QTEC | First Trust NASDAQ-100-Tech Sector ETF | | 177.34 | 0 | -1.51 | -3.61 | 1.07% |
| QQQX | Nuveen Nasdaq 100 Dynamic Overwrite Fund | | 22.80 | 17 | -0.26 | -0.87 | -1.51% |
| QQEW | First Trust NASDAQ-100 Equal Wtd ETF | | 116.39 | 7 | -0.81 | -2.03 | -0.9% |
| QQXT | First Trust NASDAQ-100 ex-Tech Sect ETF | | 86.03 | 20 | -0.50 | -1.14 | -2.38% |
| 12Stocks.com: Charts, Trends, Fundamental Data and Performances of Nasdaq 100 Stocks | |
|
We now take in-depth look at all Nasdaq 100 stocks including charts, multi-period performances and overall trends (as measured by Smart Investing & Trading Score). One can sort Nasdaq 100 stocks (click link to choose) by Daily, Weekly and by Year-to-Date performances. Also, one can sort by size of the company or by market capitalization. |
| Select Your Default Chart Type: | |||||
| |||||
| Click on stock symbol or name for detailed view. Click on to add stock symbol to your watchlist and to view watchlist. Quick View: Move mouse or cursor over "Daily" to quickly view daily technical stock chart and over "Weekly" to view weekly technical stock chart. | |||||

 | REGN Regeneron Pharmaceuticals, Inc. |
| Sector: Health Care | |
| SubSector: Biotechnology | |
| MarketCap: 51903.7 Millions | |
| Recent Price: 903.48 Smart Investing & Trading Score: 50 | |
| Day Percent Change: 1.44% Day Change: 12.82 | |
| Week Change: 2.3% Year-to-date Change: 2.9% | |
| REGN Links: Profile News Message Board | |
| Charts:- Daily , Weekly | |
| Add REGN to Watchlist: View: Get Complete REGN Trend Analysis ➞ | |
 | EA Electronic Arts Inc. |
| Sector: Technology | |
| SubSector: Multimedia & Graphics Software | |
| MarketCap: 27296.5 Millions | |
| Recent Price: 128.18 Smart Investing & Trading Score: 49 | |
| Day Percent Change: 1.07% Day Change: 1.36 | |
| Week Change: 0.22% Year-to-date Change: -6.3% | |
| EA Links: Profile News Message Board | |
| Charts:- Daily , Weekly | |
| Add EA to Watchlist: View: Get Complete EA Trend Analysis ➞ | |
 | ADI Analog Devices, Inc. |
| Sector: Technology | |
| SubSector: Semiconductor - Integrated Circuits | |
| MarketCap: 32859 Millions | |
| Recent Price: 193.89 Smart Investing & Trading Score: 48 | |
| Day Percent Change: -3.35% Day Change: -6.72 | |
| Week Change: -4% Year-to-date Change: -2.4% | |
| ADI Links: Profile News Message Board | |
| Charts:- Daily , Weekly | |
| Add ADI to Watchlist: View: Get Complete ADI Trend Analysis ➞ | |
 | MU Micron Technology, Inc. |
| Sector: Technology | |
| SubSector: Semiconductor- Memory Chips | |
| MarketCap: 45188.4 Millions | |
| Recent Price: 109.70 Smart Investing & Trading Score: 48 | |
| Day Percent Change: -2.89% Day Change: -3.26 | |
| Week Change: -4.48% Year-to-date Change: 28.5% | |
| MU Links: Profile News Message Board | |
| Charts:- Daily , Weekly | |
| Add MU to Watchlist: View: Get Complete MU Trend Analysis ➞ | |
 | MDB MongoDB, Inc. |
| Sector: Technology | |
| SubSector: Application Software | |
| MarketCap: 7591.22 Millions | |
| Recent Price: 373.33 Smart Investing & Trading Score: 44 | |
| Day Percent Change: 2.23% Day Change: 8.15 | |
| Week Change: -2.73% Year-to-date Change: -8.7% | |
| MDB Links: Profile News Message Board | |
| Charts:- Daily , Weekly | |
| Add MDB to Watchlist: View: Get Complete MDB Trend Analysis ➞ | |
 | DASH DoorDash, Inc. |
| Sector: Technology | |
| SubSector: Internet Content & Information | |
| MarketCap: 59087 Millions | |
| Recent Price: 127.46 Smart Investing & Trading Score: 43 | |
| Day Percent Change: -1.39% Day Change: -1.80 | |
| Week Change: -3.52% Year-to-date Change: 29.0% | |
| DASH Links: Profile News Message Board | |
| Charts:- Daily , Weekly | |
| Add DASH to Watchlist: View: Get Complete DASH Trend Analysis ➞ | |
 | KHC The Kraft Heinz Company |
| Sector: Consumer Staples | |
| SubSector: Food - Major Diversified | |
| MarketCap: 32096.3 Millions | |
| Recent Price: 36.28 Smart Investing & Trading Score: 41 | |
| Day Percent Change: -6.03% Day Change: -2.33 | |
| Week Change: -4.93% Year-to-date Change: -1.9% | |
| KHC Links: Profile News Message Board | |
| Charts:- Daily , Weekly | |
| Add KHC to Watchlist: View: Get Complete KHC Trend Analysis ➞ | |
 | CSGP CoStar Group, Inc. |
| Sector: Financials | |
| SubSector: Property Management | |
| MarketCap: 21454.4 Millions | |
| Recent Price: 90.36 Smart Investing & Trading Score: 41 | |
| Day Percent Change: -1.28% Day Change: -1.17 | |
| Week Change: -2.47% Year-to-date Change: 3.4% | |
| CSGP Links: Profile News Message Board | |
| Charts:- Daily , Weekly | |
| Add CSGP to Watchlist: View: Get Complete CSGP Trend Analysis ➞ | |
 | MDLZ Mondelez International, Inc. |
| Sector: Consumer Staples | |
| SubSector: Confectioners | |
| MarketCap: 68385.8 Millions | |
| Recent Price: 70.69 Smart Investing & Trading Score: 40 | |
| Day Percent Change: -1.74% Day Change: -1.25 | |
| Week Change: 0.11% Year-to-date Change: -2.4% | |
| MDLZ Links: Profile News Message Board | |
| Charts:- Daily , Weekly | |
| Add MDLZ to Watchlist: View: Get Complete MDLZ Trend Analysis ➞ | |
 | QCOM QUALCOMM Incorporated |
| Sector: Technology | |
| SubSector: Communication Equipment | |
| MarketCap: 77517.7 Millions | |
| Recent Price: 164.11 Smart Investing & Trading Score: 38 | |
| Day Percent Change: -1.05% Day Change: -1.74 | |
| Week Change: -0.94% Year-to-date Change: 13.5% | |
| QCOM Links: Profile News Message Board | |
| Charts:- Daily , Weekly | |
| Add QCOM to Watchlist: View: Get Complete QCOM Trend Analysis ➞ | |
 | PDD Pinduoduo Inc. |
| Sector: Services & Goods | |
| SubSector: Specialty Retail, Other | |
| MarketCap: 41696.2 Millions | |
| Recent Price: 124.49 Smart Investing & Trading Score: 38 | |
| Day Percent Change: -0.55% Day Change: -0.69 | |
| Week Change: -3.73% Year-to-date Change: -14.9% | |
| PDD Links: Profile News Message Board | |
| Charts:- Daily , Weekly | |
| Add PDD to Watchlist: View: Get Complete PDD Trend Analysis ➞ | |
 | SIRI Sirius XM Holdings Inc. |
| Sector: Services & Goods | |
| SubSector: Broadcasting - Radio | |
| MarketCap: 21325.5 Millions | |
| Recent Price: 3.05 Smart Investing & Trading Score: 35 | |
| Day Percent Change: 3.74% Day Change: 0.11 | |
| Week Change: 0.99% Year-to-date Change: -44.2% | |
| SIRI Links: Profile News Message Board | |
| Charts:- Daily , Weekly | |
| Add SIRI to Watchlist: View: Get Complete SIRI Trend Analysis ➞ | |
 | GILD Gilead Sciences, Inc. |
| Sector: Health Care | |
| SubSector: Biotechnology | |
| MarketCap: 99485.6 Millions | |
| Recent Price: 65.51 Smart Investing & Trading Score: 35 | |
| Day Percent Change: 0.48% Day Change: 0.31 | |
| Week Change: 0.14% Year-to-date Change: -19.1% | |
| GILD Links: Profile News Message Board | |
| Charts:- Daily , Weekly | |
| Add GILD to Watchlist: View: Get Complete GILD Trend Analysis ➞ | |
 | ODFL Old Dominion Freight Line, Inc. |
| Sector: Transports | |
| SubSector: Trucking | |
| MarketCap: 14457.5 Millions | |
| Recent Price: 182.49 Smart Investing & Trading Score: 35 | |
| Day Percent Change: 0.43% Day Change: 0.78 | |
| Week Change: 0.04% Year-to-date Change: -55.0% | |
| ODFL Links: Profile News Message Board | |
| Charts:- Daily , Weekly | |
| Add ODFL to Watchlist: View: Get Complete ODFL Trend Analysis ➞ | |
 | TTWO Take-Two Interactive Software, Inc. |
| Sector: Technology | |
| SubSector: Multimedia & Graphics Software | |
| MarketCap: 12479.6 Millions | |
| Recent Price: 142.74 Smart Investing & Trading Score: 34 | |
| Day Percent Change: -0.05% Day Change: -0.07 | |
| Week Change: -1.2% Year-to-date Change: -11.3% | |
| TTWO Links: Profile News Message Board | |
| Charts:- Daily , Weekly | |
| Add TTWO to Watchlist: View: Get Complete TTWO Trend Analysis ➞ | |
 | DXCM DexCom, Inc. |
| Sector: Health Care | |
| SubSector: Medical Laboratories & Research | |
| MarketCap: 19559 Millions | |
| Recent Price: 125.88 Smart Investing & Trading Score: 34 | |
| Day Percent Change: -1.19% Day Change: -1.51 | |
| Week Change: 1.24% Year-to-date Change: 1.4% | |
| DXCM Links: Profile News Message Board | |
| Charts:- Daily , Weekly | |
| Add DXCM to Watchlist: View: Get Complete DXCM Trend Analysis ➞ | |
 | CPRT Copart, Inc. |
| Sector: Services & Goods | |
| SubSector: Auto Dealerships | |
| MarketCap: 15462.1 Millions | |
| Recent Price: 54.44 Smart Investing & Trading Score: 33 | |
| Day Percent Change: 0.24% Day Change: 0.13 | |
| Week Change: -2.31% Year-to-date Change: 11.1% | |
| CPRT Links: Profile News Message Board | |
| Charts:- Daily , Weekly | |
| Add CPRT to Watchlist: View: Get Complete CPRT Trend Analysis ➞ | |
 | NVDA NVIDIA Corporation |
| Sector: Technology | |
| SubSector: Semiconductor - Specialized | |
| MarketCap: 143476 Millions | |
| Recent Price: 830.41 Smart Investing & Trading Score: 33 | |
| Day Percent Change: -3.89% Day Change: -33.61 | |
| Week Change: -5.35% Year-to-date Change: 67.7% | |
| NVDA Links: Profile News Message Board | |
| Charts:- Daily , Weekly | |
| Add NVDA to Watchlist: View: Get Complete NVDA Trend Analysis ➞ | |
 | PANW Palo Alto Networks, Inc. |
| Sector: Technology | |
| SubSector: Networking & Communication Devices | |
| MarketCap: 16039.4 Millions | |
| Recent Price: 287.34 Smart Investing & Trading Score: 32 | |
| Day Percent Change: -1.22% Day Change: -3.55 | |
| Week Change: -1.4% Year-to-date Change: -2.6% | |
| PANW Links: Profile News Message Board | |
| Charts:- Daily , Weekly | |
| Add PANW to Watchlist: View: Get Complete PANW Trend Analysis ➞ | |
 | FANG Diamondback Energy, Inc. |
| Sector: Energy | |
| SubSector: Independent Oil & Gas | |
| MarketCap: 3009.13 Millions | |
| Recent Price: 196.01 Smart Investing & Trading Score: 31 | |
| Day Percent Change: -2.55% Day Change: -5.12 | |
| Week Change: -5.66% Year-to-date Change: 26.4% | |
| FANG Links: Profile News Message Board | |
| Charts:- Daily , Weekly | |
| Add FANG to Watchlist: View: Get Complete FANG Trend Analysis ➞ | |
 | CEG Constellation Energy Corporation |
| Sector: Utilities | |
| SubSector: Utilities - Renewable | |
| MarketCap: 29600 Millions | |
| Recent Price: 184.63 Smart Investing & Trading Score: 31 | |
| Day Percent Change: -0.70% Day Change: -1.31 | |
| Week Change: -1.99% Year-to-date Change: 57.7% | |
| CEG Links: Profile News Message Board | |
| Charts:- Daily , Weekly | |
| Add CEG to Watchlist: View: Get Complete CEG Trend Analysis ➞ | |
 | BKR Baker Hughes Company |
| Sector: Services & Goods | |
| SubSector: Technical Services | |
| MarketCap: 1330 Millions | |
| Recent Price: 31.89 Smart Investing & Trading Score: 26 | |
| Day Percent Change: -2.24% Day Change: -0.73 | |
| Week Change: -2.89% Year-to-date Change: -6.7% | |
| BKR Links: Profile News Message Board | |
| Charts:- Daily , Weekly | |
| Add BKR to Watchlist: View: Get Complete BKR Trend Analysis ➞ | |
 | LULU Lululemon Athletica Inc. |
| Sector: Consumer Staples | |
| SubSector: Textile - Apparel Clothing | |
| MarketCap: 24627.8 Millions | |
| Recent Price: 354.40 Smart Investing & Trading Score: 25 | |
| Day Percent Change: -1.72% Day Change: -6.20 | |
| Week Change: -2.82% Year-to-date Change: -30.7% | |
| LULU Links: Profile News Message Board | |
| Charts:- Daily , Weekly | |
| Add LULU to Watchlist: View: Get Complete LULU Trend Analysis ➞ | |
 | WBA Walgreens Boots Alliance, Inc. |
| Sector: Services & Goods | |
| SubSector: Drug Stores | |
| MarketCap: 46184.1 Millions | |
| Recent Price: 17.34 Smart Investing & Trading Score: 20 | |
| Day Percent Change: -2.20% Day Change: -0.39 | |
| Week Change: -2.03% Year-to-date Change: -33.6% | |
| WBA Links: Profile News Message Board | |
| Charts:- Daily , Weekly | |
| Add WBA to Watchlist: View: Get Complete WBA Trend Analysis ➞ | |
 | MNST Monster Beverage Corporation |
| Sector: Consumer Staples | |
| SubSector: Beverages - Soft Drinks | |
| MarketCap: 30126.8 Millions | |
| Recent Price: 53.54 Smart Investing & Trading Score: 18 | |
| Day Percent Change: 0.17% Day Change: 0.09 | |
| Week Change: 0.32% Year-to-date Change: -7.1% | |
| MNST Links: Profile News Message Board | |
| Charts:- Daily , Weekly | |
| Add MNST to Watchlist: View: Get Complete MNST Trend Analysis ➞ | |
 | CRWD CrowdStrike Holdings, Inc. |
| Sector: Technology | |
| SubSector: Security Software & Services | |
| MarketCap: 11803.6 Millions | |
| Recent Price: 295.44 Smart Investing & Trading Score: 17 | |
| Day Percent Change: 0.99% Day Change: 2.90 | |
| Week Change: -2.84% Year-to-date Change: 15.7% | |
| CRWD Links: Profile News Message Board | |
| Charts:- Daily , Weekly | |
| Add CRWD to Watchlist: View: Get Complete CRWD Trend Analysis ➞ | |
 | FTNT Fortinet, Inc. |
| Sector: Technology | |
| SubSector: Application Software | |
| MarketCap: 16993.8 Millions | |
| Recent Price: 63.53 Smart Investing & Trading Score: 17 | |
| Day Percent Change: 0.55% Day Change: 0.35 | |
| Week Change: -1.01% Year-to-date Change: 8.5% | |
| FTNT Links: Profile News Message Board | |
| Charts:- Daily , Weekly | |
| Add FTNT to Watchlist: View: Get Complete FTNT Trend Analysis ➞ | |
 | FAST Fastenal Company |
| Sector: Services & Goods | |
| SubSector: Industrial Equipment Wholesale | |
| MarketCap: 17609.9 Millions | |
| Recent Price: 68.18 Smart Investing & Trading Score: 17 | |
| Day Percent Change: 0.35% Day Change: 0.24 | |
| Week Change: 0.01% Year-to-date Change: 5.3% | |
| FAST Links: Profile News Message Board | |
| Charts:- Daily , Weekly | |
| Add FAST to Watchlist: View: Get Complete FAST Trend Analysis ➞ | |
 | ISRG Intuitive Surgical, Inc. |
| Sector: Health Care | |
| SubSector: Medical Instruments & Supplies | |
| MarketCap: 50917.5 Millions | |
| Recent Price: 371.70 Smart Investing & Trading Score: 17 | |
| Day Percent Change: 0.29% Day Change: 1.08 | |
| Week Change: -0.97% Year-to-date Change: 10.2% | |
| ISRG Links: Profile News Message Board | |
| Charts:- Daily , Weekly | |
| Add ISRG to Watchlist: View: Get Complete ISRG Trend Analysis ➞ | |
 | DLTR Dollar Tree, Inc. |
| Sector: Services & Goods | |
| SubSector: Discount, Variety Stores | |
| MarketCap: 21383.2 Millions | |
| Recent Price: 118.56 Smart Investing & Trading Score: 17 | |
| Day Percent Change: 0.26% Day Change: 0.31 | |
| Week Change: -2.61% Year-to-date Change: -16.5% | |
| DLTR Links: Profile News Message Board | |
| Charts:- Daily , Weekly | |
| Add DLTR to Watchlist: View: Get Complete DLTR Trend Analysis ➞ | |
| For tabular summary view of above stock list: Summary View ➞ 0 - 30 , 30 - 60 , 60 - 90 , 90 - 120 | ||
| Click To Change The Sort Order: By Market Cap or Company Size Performance: Year-to-date, Week and Day | |
| Select Chart Type: | ||
|
Best Stocks Today 12Stocks.com |
© 2024 12Stocks.com Terms & Conditions Privacy Contact Us
All Information Provided Only For Education And Not To Be Used For Investing or Trading. See Terms & Conditions


One More Thing ... Get Best Stocks Delivered Daily!
Never Ever Miss A Move With Our Top Ten Stocks Lists
Find Best Stocks In Any Market - Bull or Bear Market
Take A Peek At Our Top Ten Stocks Lists: Daily, Weekly, Year-to-Date & Top Trends
Find Best Stocks In Any Market - Bull or Bear Market
Take A Peek At Our Top Ten Stocks Lists: Daily, Weekly, Year-to-Date & Top Trends
Nasdaq 100 Stocks With Best Up Trends [0-bearish to 100-bullish]: American Electric[100], T-Mobile US[95], AstraZeneca [95], Exelon [95], Moderna [93], Amgen [90], UltraPro[88], Biogen [87], PayPal [78], Coca-Cola European[73], PepsiCo [71]
Best Nasdaq 100 Stocks Year-to-Date:
NVIDIA [67.69%], Constellation Energy[57.66%], DoorDash [29%], Micron [28.54%], Diamondback Energy[26.39%], Meta Platforms[24.06%], Applied Materials[19.7%], Trade Desk[18.69%], Amazon.com [17.81%], Google [17.48%], Google [17.3%] Best Nasdaq 100 Stocks This Week:
Tesla [6.95%], UltraPro[6.91%], Verisk Analytics[5.28%], MercadoLibre [3.59%], Biogen [3.46%], American Electric[3.39%], Moderna [3.23%], NXP Semiconductors[2.77%], Amgen [2.74%], Regeneron [2.3%], Charter [2%] Best Nasdaq 100 Stocks Daily:
Verisk Analytics[6.81%], Sirius XM[3.74%], Trade Desk[3.09%], GE HealthCare[2.65%], American Electric[2.46%], Vertex [2.38%], Amazon.com [2.29%], UltraPro[2.26%], Automatic Data[2.25%], MongoDB [2.23%], Meta Platforms[2.10%]