
 Login Sign Up


| |||||
 |  | ||||

| 12Stocks.com Market Intelligence |
Best Nasdaq Stocks
|
On this page, you will find the most comprehensive analysis of Nasdaq 100 stocks and ETFs - from latest trends to performances to charts ➞. First, here are the year-to-date (YTD) performances of the most requested Nasdaq stocks at 12Stocks.com (click stock for review):
| NVIDIA 67% | ||
| Netflix 16% | ||
| Amazon.com 14% | ||
| QUALCOMM 13% | ||
| Google 12% | ||
| Costco 9% | ||
| Microsoft 6% | ||
| Amgen -6% | ||
| Starbucks -9% | ||
| Expedia -10% | ||
| Apple -12% | ||
| Comcast -14% | ||
| Baidu -16% | ||
| Gilead -19% | ||
| Biogen -22% | ||
| Intel -30% | ||
| Tesla -32% | ||
| Nasdaq 100 Stocks Lists: Performances & Trends, Nasdaq 100 Stock Charts
Sort Nasdaq 100 stocks: Daily, Weekly, Year-to-Date, Market Cap & Trends. |
| 12Stocks.com Nasdaq Stocks Performances & Trends Daily Report | |||||||||
|
| 
The overall Smart Investing & Trading Score is 51 (0-bearish to 100-bullish) which puts Nasdaq index in short term neutral trend. The Smart Investing & Trading Score from previous trading session is 58 and hence a deterioration of trend. | ||||||||
| Here are the Smart Investing & Trading Scores of the most requested Nasdaq 100 stocks at 12Stocks.com (click stock name for detailed review): |


| 12Stocks.com: Top Performing Nasdaq 100 Index Stocks | ||||||||||||||||||||||||||||||||||||||||||||||||
 The top performing Nasdaq 100 Index stocks year to date are
Now, more recently, over last week, the top performing Nasdaq 100 Index stocks on the move are


|
||||||||||||||||||||||||||||||||||||||||||||||||
| 12Stocks.com: Investing in Nasdaq 100 Index with Stocks | |
|
The following table helps investors and traders sort through current performance and trends (as measured by Smart Investing & Trading Score) of various
stocks in the Nasdaq 100 Index. Quick View: Move mouse or cursor over stock symbol (ticker) to view short-term technical chart and over stock name to view long term chart. Click on  to add stock symbol to your watchlist and to add stock symbol to your watchlist and  to view watchlist. Click on any ticker or stock name for detailed market intelligence report for that stock. to view watchlist. Click on any ticker or stock name for detailed market intelligence report for that stock. |
12Stocks.com Performance of Stocks in Nasdaq 100 Index
| Ticker | Stock Name | Watchlist | Category | Recent Price | Smart Investing & Trading Score | Change % | YTD Change% |
| AZN | AstraZeneca |   | Health Care | 75.03 | 100 | 5.38 | 11.40% |
| TSLA | Tesla | | Consumer Staples | 170.18 | 57 | 4.97 | -31.51% |
| KDP | Keurig Dr | | Consumer Staples | 33.87 | 80 | 4.73 | 1.65% |
| MRVL | Marvell | | Technology | 67.48 | 45 | 4.06 | 11.89% |
| NVDA | NVIDIA | | Technology | 826.32 | 56 | 3.71 | 66.86% |
| AVGO | Broadcom | | Technology | 1294.42 | 58 | 2.99 | 15.96% |
| KLAC | KLA | | Technology | 672.95 | 63 | 2.50 | 15.77% |
| BKR | Baker Hughes | | Services & Goods | 33.29 | 53 | 1.99 | -2.60% |
| GFS | GLOBALFOUNDRIES | | Technology | 47.79 | 32 | 1.96 | -21.01% |
| LRCX | Lam Research | | Technology | 901.47 | 58 | 1.87 | 15.09% |
| CCEP | Coca-Cola European | | Consumer Staples | 70.95 | 50 | 1.85 | 6.31% |
| INTC | Intel | | Technology | 35.11 | 42 | 1.77 | -30.13% |
| NFLX | Netflix | | Technology | 564.80 | 38 | 1.74 | 16.00% |
| MCHP | Microchip | | Technology | 92.21 | 100 | 1.69 | 2.25% |
| SQQQ | UltraPro | | Utilities | 12.00 | 44 | 1.61 | -10.78% |
| AMD | Advanced Micro | | Technology | 153.76 | 32 | 1.33 | 4.31% |
| ON | ON Semiconductor | | Technology | 66.38 | 42 | 1.30 | -20.53% |
| NXPI | NXP Semiconductors | | Technology | 238.08 | 75 | 1.29 | 3.66% |
| ASML | ASML Holding | | Technology | 902.51 | 58 | 1.14 | 19.23% |
| CDW | CDW | | Technology | 243.42 | 58 | 1.13 | 7.08% |
| CSX | CSX | | Transports | 34.03 | 10 | 1.07 | -1.85% |
| FANG | Diamondback Energy | | Energy | 207.10 | 76 | 0.91 | 33.54% |
| ODFL | Old Dominion | | Transports | 196.66 | 15 | 0.82 | -51.48% |
| ADI | Analog Devices | | Technology | 197.94 | 100 | 0.73 | -0.31% |
| AMAT | Applied Materials | | Technology | 197.50 | 63 | 0.73 | 21.86% |
| CEG | Constellation Energy | | Utilities | 188.01 | 68 | 0.72 | 60.54% |
| ADSK | Autodesk | | Technology | 216.40 | 10 | 0.65 | -11.12% |
| FAST | Fastenal | | Services & Goods | 68.14 | 32 | 0.59 | 5.20% |
| AEP | American Electric | | Utilities | 86.86 | 100 | 0.57 | 6.94% |
| CPRT | Copart | | Services & Goods | 55.22 | 58 | 0.53 | 12.69% |
| For chart view version of above stock list: Chart View ➞ 0 - 30 , 30 - 60 , 60 - 90 , 90 - 120 | ||
 | Click To Change The Sort Order: By Market Cap or Company Size Performance: Year-to-date, Week and Day |  |
|
Get the most comprehensive stock market coverage daily at 12Stocks.com ➞ Best Stocks Today ➞ Best Stocks Weekly ➞ Best Stocks Year-to-Date ➞ Best Stocks Trends ➞  Best Stocks Today 12Stocks.com Best Dow Stocks ➞ Best S&P 500 Stocks ➞ Best Tech Stocks ➞ Best Biotech Stocks ➞ |
| Detailed Overview of Nasdaq 100 Stocks |
| Nasdaq 100 Technical Overview, Leaders & Laggards, Top Nasdaq 100 ETF Funds & Detailed Nasdaq 100 Stocks List, Charts, Trends & More |
| Nasdaq 100: Technical Analysis, Trends & YTD Performance | |
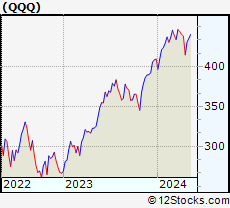
| Nasdaq 100 index as represented by
QQQ, an exchange-traded fund [ETF], holds basket of one hundred (mostly largecap) stocks from technology, biotech & retail sectors of the US stock market. The Nasdaq 100 index (contains stocks like Apple and Amgen) is up by 3.65% and is currently underperforming the overall market by -1.51% year-to-date. Below is a quick view of technical charts and trends: | |
 QQQ Weekly Chart |
|
| Long Term Trend: Good | |
| Medium Term Trend: Not Good | |
 QQQ Daily Chart |
|
| Short Term Trend: Very Good | |
| Overall Trend Score: 51 | |
| YTD Performance: 3.65% | |
| **Trend Scores & Views Are Only For Educational Purposes And Not For Investing | |
| 12Stocks.com: Investing in Nasdaq 100 Index using Exchange Traded Funds | |
|
The following table shows list of key exchange traded funds (ETF) that
help investors track Nasdaq 100 index. The following list also includes leveraged ETF funds that track twice or thrice the daily returns of Nasdaq 100 indices. Short or inverse ETF funds move in the opposite direction to the index they track and are useful during market pullbacks or during bear markets. Quick View: Move mouse or cursor over ETF symbol (ticker) to view short-term technical chart and over ETF name to view long term chart. Click on ticker or stock name for detailed view. Click on to add stock symbol to your watchlist and to view watchlist. |
12Stocks.com List of ETFs that track Nasdaq 100 Index
| Ticker | ETF Name | Watchlist | Recent Price | Smart Investing & Trading Score | Change % | Week % | Year-to-date % |
| SQQQ | ProShares UltraPro Short QQQ | | 12.00 | 44 | 1.61 | -6.54 | -10.78% |
| TQQQ | ProShares UltraPro QQQ | | 52.85 | 38 | -1.60 | 6.81 | 4.24% |
| QQQ | PowerShares QQQ ETF | | 424.45 | 51 | -0.48 | 2.36 | 3.65% |
| QYLD | Recon Capital NASDAQ 100 Cov Call ETF | | 17.35 | 10 | -0.23 | 0.43 | 0.06% |
| QID | ProShares UltraShort QQQ | | 49.23 | 49 | 1.07 | -4.39 | -7.2% |
| QLD | ProShares Ultra QQQ | | 79.36 | 38 | -1.06 | 4.59 | 4.42% |
| QQEW | First Trust NASDAQ-100 Equal Wtd ETF | | 118.18 | 32 | -0.10 | 2.72 | 0.62% |
| QQQX | Nuveen Nasdaq 100 Dynamic Overwrite Fund | | 22.70 | 23 | -0.70 | 1.48 | -1.94% |
| QTEC | First Trust NASDAQ-100-Tech Sector ETF | | 181.18 | 51 | 0.02 | 4.16 | 3.25% |
| QQQE | Direxion NASDAQ-100 Equal Wtd ETF | | 84.99 | 38 | -0.18 | 2.58 | 0.41% |
| QQXT | First Trust NASDAQ-100 ex-Tech Sect ETF | | 86.90 | 18 | -0.03 | 1.97 | -1.4% |
| 12Stocks.com: Charts, Trends, Fundamental Data and Performances of Nasdaq 100 Stocks | |
|
We now take in-depth look at all Nasdaq 100 stocks including charts, multi-period performances and overall trends (as measured by Smart Investing & Trading Score). One can sort Nasdaq 100 stocks (click link to choose) by Daily, Weekly and by Year-to-Date performances. Also, one can sort by size of the company or by market capitalization. |
| Select Your Default Chart Type: | |||||
| |||||
| Click on stock symbol or name for detailed view. Click on to add stock symbol to your watchlist and to view watchlist. Quick View: Move mouse or cursor over "Daily" to quickly view daily technical stock chart and over "Weekly" to view weekly technical stock chart. | |||||

 | AZN AstraZeneca PLC |
| Sector: Health Care | |
| SubSector: Drug Manufacturers - Major | |
| MarketCap: 113154 Millions | |
| Recent Price: 75.03 Smart Investing & Trading Score: 100 | |
| Day Percent Change: 5.38% Day Change: 3.83 | |
| Week Change: 9.45% Year-to-date Change: 11.4% | |
| AZN Links: Profile News Message Board | |
| Charts:- Daily , Weekly | |
| Add AZN to Watchlist: View: Get Complete AZN Trend Analysis ➞ | |
 | TSLA Tesla, Inc. |
| Sector: Consumer Staples | |
| SubSector: Auto Manufacturers - Major | |
| MarketCap: 89058.8 Millions | |
| Recent Price: 170.18 Smart Investing & Trading Score: 57 | |
| Day Percent Change: 4.97% Day Change: 8.05 | |
| Week Change: 15.73% Year-to-date Change: -31.5% | |
| TSLA Links: Profile News Message Board | |
| Charts:- Daily , Weekly | |
| Add TSLA to Watchlist: View: Get Complete TSLA Trend Analysis ➞ | |
 | KDP Keurig Dr Pepper Inc. |
| Sector: Consumer Staples | |
| SubSector: Beverages - Soft Drinks | |
| MarketCap: 35295.2 Millions | |
| Recent Price: 33.87 Smart Investing & Trading Score: 80 | |
| Day Percent Change: 4.73% Day Change: 1.53 | |
| Week Change: 7.49% Year-to-date Change: 1.7% | |
| KDP Links: Profile News Message Board | |
| Charts:- Daily , Weekly | |
| Add KDP to Watchlist: View: Get Complete KDP Trend Analysis ➞ | |
 | MRVL Marvell Technology Group Ltd. |
| Sector: Technology | |
| SubSector: Semiconductor - Integrated Circuits | |
| MarketCap: 14090.4 Millions | |
| Recent Price: 67.48 Smart Investing & Trading Score: 45 | |
| Day Percent Change: 4.06% Day Change: 2.63 | |
| Week Change: 8.61% Year-to-date Change: 11.9% | |
| MRVL Links: Profile News Message Board | |
| Charts:- Daily , Weekly | |
| Add MRVL to Watchlist: View: Get Complete MRVL Trend Analysis ➞ | |
 | NVDA NVIDIA Corporation |
| Sector: Technology | |
| SubSector: Semiconductor - Specialized | |
| MarketCap: 143476 Millions | |
| Recent Price: 826.32 Smart Investing & Trading Score: 56 | |
| Day Percent Change: 3.71% Day Change: 29.55 | |
| Week Change: 8.44% Year-to-date Change: 66.9% | |
| NVDA Links: Profile News Message Board | |
| Charts:- Daily , Weekly | |
| Add NVDA to Watchlist: View: Get Complete NVDA Trend Analysis ➞ | |
 | AVGO Broadcom Inc. |
| Sector: Technology | |
| SubSector: Semiconductor - Broad Line | |
| MarketCap: 86329.1 Millions | |
| Recent Price: 1294.42 Smart Investing & Trading Score: 58 | |
| Day Percent Change: 2.99% Day Change: 37.60 | |
| Week Change: 7.45% Year-to-date Change: 16.0% | |
| AVGO Links: Profile News Message Board | |
| Charts:- Daily , Weekly | |
| Add AVGO to Watchlist: View: Get Complete AVGO Trend Analysis ➞ | |
 | KLAC KLA Corporation |
| Sector: Technology | |
| SubSector: Semiconductor Equipment & Materials | |
| MarketCap: 20663.8 Millions | |
| Recent Price: 672.95 Smart Investing & Trading Score: 63 | |
| Day Percent Change: 2.50% Day Change: 16.41 | |
| Week Change: 7.13% Year-to-date Change: 15.8% | |
| KLAC Links: Profile News Message Board | |
| Charts:- Daily , Weekly | |
| Add KLAC to Watchlist: View: Get Complete KLAC Trend Analysis ➞ | |
 | BKR Baker Hughes Company |
| Sector: Services & Goods | |
| SubSector: Technical Services | |
| MarketCap: 1330 Millions | |
| Recent Price: 33.29 Smart Investing & Trading Score: 53 | |
| Day Percent Change: 1.99% Day Change: 0.65 | |
| Week Change: 2.15% Year-to-date Change: -2.6% | |
| BKR Links: Profile News Message Board | |
| Charts:- Daily , Weekly | |
| Add BKR to Watchlist: View: Get Complete BKR Trend Analysis ➞ | |
 | GFS GLOBALFOUNDRIES Inc. |
| Sector: Technology | |
| SubSector: Semiconductors | |
| MarketCap: 35570 Millions | |
| Recent Price: 47.79 Smart Investing & Trading Score: 32 | |
| Day Percent Change: 1.96% Day Change: 0.92 | |
| Week Change: 3.31% Year-to-date Change: -21.0% | |
| GFS Links: Profile News Message Board | |
| Charts:- Daily , Weekly | |
| Add GFS to Watchlist: View: Get Complete GFS Trend Analysis ➞ | |
 | LRCX Lam Research Corporation |
| Sector: Technology | |
| SubSector: Semiconductor Equipment & Materials | |
| MarketCap: 31806 Millions | |
| Recent Price: 901.47 Smart Investing & Trading Score: 58 | |
| Day Percent Change: 1.87% Day Change: 16.58 | |
| Week Change: 3.59% Year-to-date Change: 15.1% | |
| LRCX Links: Profile News Message Board | |
| Charts:- Daily , Weekly | |
| Add LRCX to Watchlist: View: Get Complete LRCX Trend Analysis ➞ | |
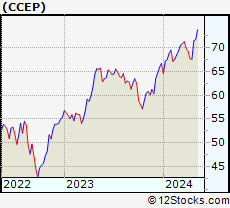 | CCEP Coca-Cola European Partners plc |
| Sector: Consumer Staples | |
| SubSector: Beverages - Soft Drinks | |
| MarketCap: 16714 Millions | |
| Recent Price: 70.95 Smart Investing & Trading Score: 50 | |
| Day Percent Change: 1.85% Day Change: 1.29 | |
| Week Change: 4.94% Year-to-date Change: 6.3% | |
| CCEP Links: Profile News Message Board | |
| Charts:- Daily , Weekly | |
| Add CCEP to Watchlist: View: Get Complete CCEP Trend Analysis ➞ | |
 | INTC Intel Corporation |
| Sector: Technology | |
| SubSector: Semiconductor - Broad Line | |
| MarketCap: 222357 Millions | |
| Recent Price: 35.11 Smart Investing & Trading Score: 42 | |
| Day Percent Change: 1.77% Day Change: 0.61 | |
| Week Change: 2.66% Year-to-date Change: -30.1% | |
| INTC Links: Profile News Message Board | |
| Charts:- Daily , Weekly | |
| Add INTC to Watchlist: View: Get Complete INTC Trend Analysis ➞ | |
 | NFLX Netflix, Inc. |
| Sector: Technology | |
| SubSector: CATV Systems | |
| MarketCap: 162108 Millions | |
| Recent Price: 564.80 Smart Investing & Trading Score: 38 | |
| Day Percent Change: 1.74% Day Change: 9.68 | |
| Week Change: 1.76% Year-to-date Change: 16.0% | |
| NFLX Links: Profile News Message Board | |
| Charts:- Daily , Weekly | |
| Add NFLX to Watchlist: View: Get Complete NFLX Trend Analysis ➞ | |
 | MCHP Microchip Technology Incorporated |
| Sector: Technology | |
| SubSector: Semiconductor - Broad Line | |
| MarketCap: 16826.3 Millions | |
| Recent Price: 92.21 Smart Investing & Trading Score: 100 | |
| Day Percent Change: 1.69% Day Change: 1.53 | |
| Week Change: 12.89% Year-to-date Change: 2.3% | |
| MCHP Links: Profile News Message Board | |
| Charts:- Daily , Weekly | |
| Add MCHP to Watchlist: View: Get Complete MCHP Trend Analysis ➞ | |
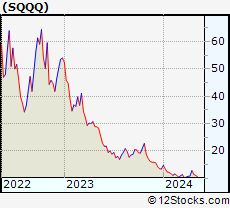 | SQQQ ProShares UltraPro Short QQQ |
| Sector: Utilities | |
| SubSector: Exchange Traded Fund | |
| MarketCap: 0 Millions | |
| Recent Price: 12.00 Smart Investing & Trading Score: 44 | |
| Day Percent Change: 1.61% Day Change: 0.19 | |
| Week Change: -6.54% Year-to-date Change: -10.8% | |
| SQQQ Links: Profile News Message Board | |
| Charts:- Daily , Weekly | |
| Add SQQQ to Watchlist: View: Get Complete SQQQ Trend Analysis ➞ | |
 | AMD Advanced Micro Devices, Inc. |
| Sector: Technology | |
| SubSector: Semiconductor - Broad Line | |
| MarketCap: 54275.1 Millions | |
| Recent Price: 153.76 Smart Investing & Trading Score: 32 | |
| Day Percent Change: 1.33% Day Change: 2.02 | |
| Week Change: 4.86% Year-to-date Change: 4.3% | |
| AMD Links: Profile News Message Board | |
| Charts:- Daily , Weekly | |
| Add AMD to Watchlist: View: Get Complete AMD Trend Analysis ➞ | |
 | ON ON Semiconductor Corporation |
| Sector: Technology | |
| SubSector: Semiconductor - Broad Line | |
| MarketCap: 5183.82 Millions | |
| Recent Price: 66.38 Smart Investing & Trading Score: 42 | |
| Day Percent Change: 1.30% Day Change: 0.85 | |
| Week Change: 9.34% Year-to-date Change: -20.5% | |
| ON Links: Profile News Message Board | |
| Charts:- Daily , Weekly | |
| Add ON to Watchlist: View: Get Complete ON Trend Analysis ➞ | |
 | NXPI NXP Semiconductors N.V. |
| Sector: Technology | |
| SubSector: Semiconductor - Broad Line | |
| MarketCap: 22497.9 Millions | |
| Recent Price: 238.08 Smart Investing & Trading Score: 75 | |
| Day Percent Change: 1.29% Day Change: 3.04 | |
| Week Change: 10.67% Year-to-date Change: 3.7% | |
| NXPI Links: Profile News Message Board | |
| Charts:- Daily , Weekly | |
| Add NXPI to Watchlist: View: Get Complete NXPI Trend Analysis ➞ | |
 | ASML ASML Holding N.V. |
| Sector: Technology | |
| SubSector: Semiconductor Equipment & Materials | |
| MarketCap: 102565 Millions | |
| Recent Price: 902.51 Smart Investing & Trading Score: 58 | |
| Day Percent Change: 1.14% Day Change: 10.19 | |
| Week Change: 5% Year-to-date Change: 19.2% | |
| ASML Links: Profile News Message Board | |
| Charts:- Daily , Weekly | |
| Add ASML to Watchlist: View: Get Complete ASML Trend Analysis ➞ | |
 | CDW CDW Corporation |
| Sector: Technology | |
| SubSector: Information Technology Services | |
| MarketCap: 12775 Millions | |
| Recent Price: 243.42 Smart Investing & Trading Score: 58 | |
| Day Percent Change: 1.13% Day Change: 2.73 | |
| Week Change: 3.24% Year-to-date Change: 7.1% | |
| CDW Links: Profile News Message Board | |
| Charts:- Daily , Weekly | |
| Add CDW to Watchlist: View: Get Complete CDW Trend Analysis ➞ | |
 | CSX CSX Corporation |
| Sector: Transports | |
| SubSector: Railroads | |
| MarketCap: 42131.2 Millions | |
| Recent Price: 34.03 Smart Investing & Trading Score: 10 | |
| Day Percent Change: 1.07% Day Change: 0.36 | |
| Week Change: -0.9% Year-to-date Change: -1.9% | |
| CSX Links: Profile News Message Board | |
| Charts:- Daily , Weekly | |
| Add CSX to Watchlist: View: Get Complete CSX Trend Analysis ➞ | |
 | FANG Diamondback Energy, Inc. |
| Sector: Energy | |
| SubSector: Independent Oil & Gas | |
| MarketCap: 3009.13 Millions | |
| Recent Price: 207.10 Smart Investing & Trading Score: 76 | |
| Day Percent Change: 0.91% Day Change: 1.86 | |
| Week Change: 3.17% Year-to-date Change: 33.5% | |
| FANG Links: Profile News Message Board | |
| Charts:- Daily , Weekly | |
| Add FANG to Watchlist: View: Get Complete FANG Trend Analysis ➞ | |
 | ODFL Old Dominion Freight Line, Inc. |
| Sector: Transports | |
| SubSector: Trucking | |
| MarketCap: 14457.5 Millions | |
| Recent Price: 196.66 Smart Investing & Trading Score: 15 | |
| Day Percent Change: 0.82% Day Change: 1.60 | |
| Week Change: -7.16% Year-to-date Change: -51.5% | |
| ODFL Links: Profile News Message Board | |
| Charts:- Daily , Weekly | |
| Add ODFL to Watchlist: View: Get Complete ODFL Trend Analysis ➞ | |
 | ADI Analog Devices, Inc. |
| Sector: Technology | |
| SubSector: Semiconductor - Integrated Circuits | |
| MarketCap: 32859 Millions | |
| Recent Price: 197.94 Smart Investing & Trading Score: 100 | |
| Day Percent Change: 0.73% Day Change: 1.44 | |
| Week Change: 7.95% Year-to-date Change: -0.3% | |
| ADI Links: Profile News Message Board | |
| Charts:- Daily , Weekly | |
| Add ADI to Watchlist: View: Get Complete ADI Trend Analysis ➞ | |
 | AMAT Applied Materials, Inc. |
| Sector: Technology | |
| SubSector: Semiconductor Equipment & Materials | |
| MarketCap: 40593.8 Millions | |
| Recent Price: 197.50 Smart Investing & Trading Score: 63 | |
| Day Percent Change: 0.73% Day Change: 1.44 | |
| Week Change: 4.07% Year-to-date Change: 21.9% | |
| AMAT Links: Profile News Message Board | |
| Charts:- Daily , Weekly | |
| Add AMAT to Watchlist: View: Get Complete AMAT Trend Analysis ➞ | |
 | CEG Constellation Energy Corporation |
| Sector: Utilities | |
| SubSector: Utilities - Renewable | |
| MarketCap: 29600 Millions | |
| Recent Price: 188.01 Smart Investing & Trading Score: 68 | |
| Day Percent Change: 0.72% Day Change: 1.33 | |
| Week Change: 3.93% Year-to-date Change: 60.5% | |
| CEG Links: Profile News Message Board | |
| Charts:- Daily , Weekly | |
| Add CEG to Watchlist: View: Get Complete CEG Trend Analysis ➞ | |
 | ADSK Autodesk, Inc. |
| Sector: Technology | |
| SubSector: Technical & System Software | |
| MarketCap: 36975.8 Millions | |
| Recent Price: 216.40 Smart Investing & Trading Score: 10 | |
| Day Percent Change: 0.65% Day Change: 1.40 | |
| Week Change: -0.05% Year-to-date Change: -11.1% | |
| ADSK Links: Profile News Message Board | |
| Charts:- Daily , Weekly | |
| Add ADSK to Watchlist: View: Get Complete ADSK Trend Analysis ➞ | |
 | FAST Fastenal Company |
| Sector: Services & Goods | |
| SubSector: Industrial Equipment Wholesale | |
| MarketCap: 17609.9 Millions | |
| Recent Price: 68.14 Smart Investing & Trading Score: 32 | |
| Day Percent Change: 0.59% Day Change: 0.40 | |
| Week Change: 0.84% Year-to-date Change: 5.2% | |
| FAST Links: Profile News Message Board | |
| Charts:- Daily , Weekly | |
| Add FAST to Watchlist: View: Get Complete FAST Trend Analysis ➞ | |
 | AEP American Electric Power Company, Inc. |
| Sector: Utilities | |
| SubSector: Electric Utilities | |
| MarketCap: 38380 Millions | |
| Recent Price: 86.86 Smart Investing & Trading Score: 100 | |
| Day Percent Change: 0.57% Day Change: 0.49 | |
| Week Change: 3.16% Year-to-date Change: 6.9% | |
| AEP Links: Profile News Message Board | |
| Charts:- Daily , Weekly | |
| Add AEP to Watchlist: View: Get Complete AEP Trend Analysis ➞ | |
 | CPRT Copart, Inc. |
| Sector: Services & Goods | |
| SubSector: Auto Dealerships | |
| MarketCap: 15462.1 Millions | |
| Recent Price: 55.22 Smart Investing & Trading Score: 58 | |
| Day Percent Change: 0.53% Day Change: 0.29 | |
| Week Change: 4.43% Year-to-date Change: 12.7% | |
| CPRT Links: Profile News Message Board | |
| Charts:- Daily , Weekly | |
| Add CPRT to Watchlist: View: Get Complete CPRT Trend Analysis ➞ | |
| For tabular summary view of above stock list: Summary View ➞ 0 - 30 , 30 - 60 , 60 - 90 , 90 - 120 | ||
| Click To Change The Sort Order: By Market Cap or Company Size Performance: Year-to-date, Week and Day | |
| Select Chart Type: | ||
|
Best Stocks Today 12Stocks.com |
© 2024 12Stocks.com Terms & Conditions Privacy Contact Us
All Information Provided Only For Education And Not To Be Used For Investing or Trading. See Terms & Conditions


One More Thing ... Get Best Stocks Delivered Daily!
Never Ever Miss A Move With Our Top Ten Stocks Lists
Find Best Stocks In Any Market - Bull or Bear Market
Take A Peek At Our Top Ten Stocks Lists: Daily, Weekly, Year-to-Date & Top Trends
Find Best Stocks In Any Market - Bull or Bear Market
Take A Peek At Our Top Ten Stocks Lists: Daily, Weekly, Year-to-Date & Top Trends
Nasdaq 100 Stocks With Best Up Trends [0-bearish to 100-bullish]: AstraZeneca [100], Microchip [100], Analog Devices[100], American Electric[100], T-Mobile US[100], Kraft Heinz[100], Texas Instruments[93], Google [93], PepsiCo [93], Exelon [81], Keurig Dr[80]
Best Nasdaq 100 Stocks Year-to-Date:
NVIDIA [66.86%], Constellation Energy[60.54%], Diamondback Energy[33.54%], Micron [30.75%], DoorDash [27.81%], Meta Platforms[22.36%], Applied Materials[21.86%], ASML Holding[19.23%], Airbnb [17.62%], CrowdStrike [16.72%], Netflix [16%] Best Nasdaq 100 Stocks This Week:
Tesla [15.73%], Microchip [12.89%], MongoDB [11.87%], Pinduoduo [10.89%], NXP Semiconductors[10.67%], Texas Instruments[9.75%], AstraZeneca [9.45%], ON Semiconductor[9.34%], Marvell [8.61%], NVIDIA [8.44%], Analog Devices[7.95%] Best Nasdaq 100 Stocks Daily:
AstraZeneca [5.38%], Tesla [4.97%], Keurig Dr[4.73%], Marvell [4.06%], NVIDIA [3.71%], Broadcom [2.99%], KLA [2.50%], Baker Hughes[1.99%], GLOBALFOUNDRIES [1.96%], Lam Research[1.87%], Coca-Cola European[1.85%]