
 Login Sign Up


| |||||
 |  | ||||

| 12Stocks.com Market Intelligence |
Best Nasdaq Stocks
|
On this page, you will find the most comprehensive analysis of Nasdaq 100 stocks and ETFs - from latest trends to performances to charts ➞. First, here are the year-to-date (YTD) performances of the most requested Nasdaq stocks at 12Stocks.com (click stock for review):
| NVIDIA 73% | ||
| QUALCOMM 25% | ||
| Amazon.com 22% | ||
| Google 19% | ||
| Netflix 16% | ||
| Costco 11% | ||
| Microsoft 6% | ||
| Amgen -3% | ||
| Baidu -6% | ||
| Apple -10% | ||
| Expedia -10% | ||
| Comcast -13% | ||
| Biogen -17% | ||
| Gilead -19% | ||
| Starbucks -22% | ||
| Tesla -28% | ||
| Intel -39% | ||
| Nasdaq 100 Stocks Lists: Performances & Trends, Nasdaq 100 Stock Charts
Sort Nasdaq 100 stocks: Daily, Weekly, Year-to-Date, Market Cap & Trends. |
| 12Stocks.com Nasdaq Stocks Performances & Trends Daily Report | |||||||||
|
| 
The overall Smart Investing & Trading Score is 17 (0-bearish to 100-bullish) which puts Nasdaq index in short term bearish trend. The Smart Investing & Trading Score from previous trading session is 7 and hence an improvement of trend. | ||||||||
| Here are the Smart Investing & Trading Scores of the most requested Nasdaq 100 stocks at 12Stocks.com (click stock name for detailed review): |


| 12Stocks.com: Top Performing Nasdaq 100 Index Stocks | ||||||||||||||||||||||||||||||||||||||||||||||||
 The top performing Nasdaq 100 Index stocks year to date are
Now, more recently, over last week, the top performing Nasdaq 100 Index stocks on the move are


|
||||||||||||||||||||||||||||||||||||||||||||||||
| 12Stocks.com: Investing in Nasdaq 100 Index with Stocks | |
|
The following table helps investors and traders sort through current performance and trends (as measured by Smart Investing & Trading Score) of various
stocks in the Nasdaq 100 Index. Quick View: Move mouse or cursor over stock symbol (ticker) to view short-term technical chart and over stock name to view long term chart. Click on  to add stock symbol to your watchlist and to add stock symbol to your watchlist and  to view watchlist. Click on any ticker or stock name for detailed market intelligence report for that stock. to view watchlist. Click on any ticker or stock name for detailed market intelligence report for that stock. |
12Stocks.com Performance of Stocks in Nasdaq 100 Index
| Ticker | Stock Name | Watchlist | Category | Recent Price | Smart Investing & Trading Score | Change % | YTD Change% |
| DASH | DoorDash |   | Technology | 114.27 | 0 | -10.35% | 15.65% |
| VRTX | Vertex | | Health Care | 400.16 | 57 | -0.49% | -1.65% |
| ADP | Automatic Data | | Technology | 242.03 | 15 | -2.14% | 3.89% |
| BKNG | Booking | | Services & Goods | 3472.91 | 0 | 1.68% | -2.09% |
| AMD | Advanced Micro | | Technology | 146.16 | 0 | 1.31% | -0.85% |
| BIIB | Biogen | | Health Care | 213.51 | 55 | -1.21% | -17.49% |
| REGN | Regeneron | | Health Care | 937.61 | 64 | 3.78% | 6.75% |
| ISRG | Intuitive Surgical | | Health Care | 377.65 | 25 | 1.60% | 11.94% |
| WBA | Walgreens Boots | | Services & Goods | 17.53 | 25 | 1.10% | -32.86% |
| MU | Micron | | Technology | 112.33 | 48 | 2.40% | 31.63% |
| CSX | CSX | | Transports | 33.57 | 17 | 1.11% | -3.17% |
| PDD | Pinduoduo | | Services & Goods | 137.54 | 57 | 10.48% | -5.99% |
| AMAT | Applied Materials | | Technology | 197.91 | 17 | 2.02% | 22.11% |
| ILMN | Illumina | | Health Care | 123.99 | 52 | -0.55% | -10.95% |
| AEP | American Electric | | Utilities | 88.25 | 100 | 0.11% | 8.66% |
| ADSK | Autodesk | | Technology | 209.95 | 10 | -0.36% | -13.77% |
| GEHC | GE HealthCare | | Health Care | 78.04 | 0 | -0.32% | 0.91% |
| GFS | GLOBALFOUNDRIES | | Technology | 47.51 | 24 | 0.44% | -21.47% |
| KDP | Keurig Dr | | Consumer Staples | 33.56 | 73 | 0.66% | 0.72% |
| EXC | Exelon | | Utilities | 37.89 | 88 | 0.13% | 5.54% |
| ROP | Roper | | Industrials | 510.82 | 8 | -0.77% | -6.30% |
| ADI | Analog Devices | | Technology | 196.49 | 58 | 1.34% | -1.04% |
| TEAM | Atlassian | | Technology | 183.55 | 42 | 6.24% | -22.83% |
| KHC | Kraft Heinz | | Consumer Staples | 36.72 | 46 | 1.21% | -0.70% |
| LRCX | Lam Research | | Technology | 883.68 | 17 | 1.79% | 12.82% |
| WDAY | Workday | | Technology | 250.85 | 42 | 2.40% | -9.13% |
| MNST | Monster Beverage | | Consumer Staples | 53.39 | 10 | -0.28% | -7.33% |
| CEG | Constellation Energy | | Utilities | 185.76 | 48 | 0.61% | 58.62% |
| XEL | Xcel Energy | | Utilities | 53.79 | 61 | 0.02% | -13.12% |
| EA | Electronic Arts | | Technology | 128.50 | 49 | 0.25% | -6.07% |
| For chart view version of above stock list: Chart View ➞ 0 - 30 , 30 - 60 , 60 - 90 , 90 - 120 | ||
 | Click To Change The Sort Order: By Market Cap or Company Size Performance: Year-to-date, Week and Day |  |
|
Get the most comprehensive stock market coverage daily at 12Stocks.com ➞ Best Stocks Today ➞ Best Stocks Weekly ➞ Best Stocks Year-to-Date ➞ Best Stocks Trends ➞  Best Stocks Today 12Stocks.com Best Dow Stocks ➞ Best S&P 500 Stocks ➞ Best Tech Stocks ➞ Best Biotech Stocks ➞ |
| Detailed Overview of Nasdaq 100 Stocks |
| Nasdaq 100 Technical Overview, Leaders & Laggards, Top Nasdaq 100 ETF Funds & Detailed Nasdaq 100 Stocks List, Charts, Trends & More |
| Nasdaq 100: Technical Analysis, Trends & YTD Performance | |
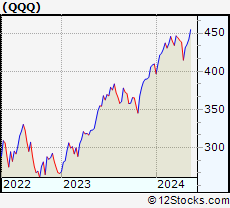
| Nasdaq 100 index as represented by
QQQ, an exchange-traded fund [ETF], holds basket of one hundred (mostly largecap) stocks from technology, biotech & retail sectors of the US stock market. The Nasdaq 100 index (contains stocks like Apple and Amgen) is up by 4.24% and is currently underperforming the overall market by -1.38% year-to-date. Below is a quick view of technical charts and trends: | |
 QQQ Weekly Chart |
|
| Long Term Trend: Not Good | |
| Medium Term Trend: Not Good | |
 QQQ Daily Chart |
|
| Short Term Trend: Deteriorating | |
| Overall Trend Score: 17 | |
| YTD Performance: 4.24% | |
| **Trend Scores & Views Are Only For Educational Purposes And Not For Investing | |
| 12Stocks.com: Investing in Nasdaq 100 Index using Exchange Traded Funds | |
|
The following table shows list of key exchange traded funds (ETF) that
help investors track Nasdaq 100 index. The following list also includes leveraged ETF funds that track twice or thrice the daily returns of Nasdaq 100 indices. Short or inverse ETF funds move in the opposite direction to the index they track and are useful during market pullbacks or during bear markets. Quick View: Move mouse or cursor over ETF symbol (ticker) to view short-term technical chart and over ETF name to view long term chart. Click on ticker or stock name for detailed view. Click on to add stock symbol to your watchlist and to view watchlist. |
12Stocks.com List of ETFs that track Nasdaq 100 Index
| Ticker | ETF Name | Watchlist | Recent Price | Smart Investing & Trading Score | Change % | Week % | Year-to-date % |
| SQQQ | ProShares UltraPro Short QQQ | | 11.78 | 78 | -3.60 | 3.06 | -12.42% |
| TQQQ | ProShares UltraPro QQQ | | 53.53 | 17 | 3.74 | -3.17 | 5.58% |
| QQQ | PowerShares QQQ ETF | | 426.90 | 17 | 1.28 | -0.95 | 4.24% |
| QYLD | Recon Capital NASDAQ 100 Cov Call ETF | | 17.47 | 17 | 0.46 | -0.06 | 0.75% |
| QID | ProShares UltraShort QQQ | | 48.66 | 78 | -2.48 | 2.01 | -8.28% |
| QLD | ProShares Ultra QQQ | | 80.12 | 17 | 2.52 | -2.09 | 5.42% |
| QQQE | Direxion NASDAQ-100 Equal Wtd ETF | | 84.64 | 10 | 0.92 | -1.05 | 0% |
| QTEC | First Trust NASDAQ-100-Tech Sector ETF | | 180.14 | 10 | 1.58 | -2.09 | 2.66% |
| QQQX | Nuveen Nasdaq 100 Dynamic Overwrite Fund | | 23.07 | 25 | 1.18 | 0.3 | -0.35% |
| QQEW | First Trust NASDAQ-100 Equal Wtd ETF | | 117.66 | 7 | 1.09 | -0.96 | 0.18% |
| QQXT | First Trust NASDAQ-100 ex-Tech Sect ETF | | 86.64 | 19 | 0.71 | -0.44 | -1.69% |
| 12Stocks.com: Charts, Trends, Fundamental Data and Performances of Nasdaq 100 Stocks | |
|
We now take in-depth look at all Nasdaq 100 stocks including charts, multi-period performances and overall trends (as measured by Smart Investing & Trading Score). One can sort Nasdaq 100 stocks (click link to choose) by Daily, Weekly and by Year-to-Date performances. Also, one can sort by size of the company or by market capitalization. |
| Select Your Default Chart Type: | |||||
| |||||
| Click on stock symbol or name for detailed view. Click on to add stock symbol to your watchlist and to view watchlist. Quick View: Move mouse or cursor over "Daily" to quickly view daily technical stock chart and over "Weekly" to view weekly technical stock chart. | |||||

 | DASH DoorDash, Inc. |
| Sector: Technology | |
| SubSector: Internet Content & Information | |
| MarketCap: 59087 Millions | |
| Recent Price: 114.27 Smart Investing & Trading Score: 0 | |
| Day Percent Change: -10.35% Day Change: -13.19 | |
| Week Change: -13.5% Year-to-date Change: 15.7% | |
| DASH Links: Profile News Message Board | |
| Charts:- Daily , Weekly | |
| Add DASH to Watchlist: View: Get Complete DASH Trend Analysis ➞ | |
 | VRTX Vertex Pharmaceuticals Incorporated |
| Sector: Health Care | |
| SubSector: Biotechnology | |
| MarketCap: 57669.6 Millions | |
| Recent Price: 400.16 Smart Investing & Trading Score: 57 | |
| Day Percent Change: -0.49% Day Change: -1.98 | |
| Week Change: 0.67% Year-to-date Change: -1.7% | |
| VRTX Links: Profile News Message Board | |
| Charts:- Daily , Weekly | |
| Add VRTX to Watchlist: View: Get Complete VRTX Trend Analysis ➞ | |
 | ADP Automatic Data Processing, Inc. |
| Sector: Technology | |
| SubSector: Business Software & Services | |
| MarketCap: 54966.5 Millions | |
| Recent Price: 242.03 Smart Investing & Trading Score: 15 | |
| Day Percent Change: -2.14% Day Change: -5.30 | |
| Week Change: -0.43% Year-to-date Change: 3.9% | |
| ADP Links: Profile News Message Board | |
| Charts:- Daily , Weekly | |
| Add ADP to Watchlist: View: Get Complete ADP Trend Analysis ➞ | |
 | BKNG Booking Holdings Inc. |
| Sector: Services & Goods | |
| SubSector: Business Services | |
| MarketCap: 54467.9 Millions | |
| Recent Price: 3472.91 Smart Investing & Trading Score: 0 | |
| Day Percent Change: 1.68% Day Change: 57.27 | |
| Week Change: -1.37% Year-to-date Change: -2.1% | |
| BKNG Links: Profile News Message Board | |
| Charts:- Daily , Weekly | |
| Add BKNG to Watchlist: View: Get Complete BKNG Trend Analysis ➞ | |
 | AMD Advanced Micro Devices, Inc. |
| Sector: Technology | |
| SubSector: Semiconductor - Broad Line | |
| MarketCap: 54275.1 Millions | |
| Recent Price: 146.16 Smart Investing & Trading Score: 0 | |
| Day Percent Change: 1.31% Day Change: 1.89 | |
| Week Change: -7.14% Year-to-date Change: -0.9% | |
| AMD Links: Profile News Message Board | |
| Charts:- Daily , Weekly | |
| Add AMD to Watchlist: View: Get Complete AMD Trend Analysis ➞ | |
 | BIIB Biogen Inc. |
| Sector: Health Care | |
| SubSector: Biotechnology | |
| MarketCap: 53102.6 Millions | |
| Recent Price: 213.51 Smart Investing & Trading Score: 55 | |
| Day Percent Change: -1.21% Day Change: -2.62 | |
| Week Change: 2.21% Year-to-date Change: -17.5% | |
| BIIB Links: Profile News Message Board | |
| Charts:- Daily , Weekly | |
| Add BIIB to Watchlist: View: Get Complete BIIB Trend Analysis ➞ | |
 | REGN Regeneron Pharmaceuticals, Inc. |
| Sector: Health Care | |
| SubSector: Biotechnology | |
| MarketCap: 51903.7 Millions | |
| Recent Price: 937.61 Smart Investing & Trading Score: 64 | |
| Day Percent Change: 3.78% Day Change: 34.13 | |
| Week Change: 6.16% Year-to-date Change: 6.8% | |
| REGN Links: Profile News Message Board | |
| Charts:- Daily , Weekly | |
| Add REGN to Watchlist: View: Get Complete REGN Trend Analysis ➞ | |
 | ISRG Intuitive Surgical, Inc. |
| Sector: Health Care | |
| SubSector: Medical Instruments & Supplies | |
| MarketCap: 50917.5 Millions | |
| Recent Price: 377.65 Smart Investing & Trading Score: 25 | |
| Day Percent Change: 1.60% Day Change: 5.95 | |
| Week Change: 0.62% Year-to-date Change: 11.9% | |
| ISRG Links: Profile News Message Board | |
| Charts:- Daily , Weekly | |
| Add ISRG to Watchlist: View: Get Complete ISRG Trend Analysis ➞ | |
 | WBA Walgreens Boots Alliance, Inc. |
| Sector: Services & Goods | |
| SubSector: Drug Stores | |
| MarketCap: 46184.1 Millions | |
| Recent Price: 17.53 Smart Investing & Trading Score: 25 | |
| Day Percent Change: 1.10% Day Change: 0.19 | |
| Week Change: -0.96% Year-to-date Change: -32.9% | |
| WBA Links: Profile News Message Board | |
| Charts:- Daily , Weekly | |
| Add WBA to Watchlist: View: Get Complete WBA Trend Analysis ➞ | |
 | MU Micron Technology, Inc. |
| Sector: Technology | |
| SubSector: Semiconductor- Memory Chips | |
| MarketCap: 45188.4 Millions | |
| Recent Price: 112.33 Smart Investing & Trading Score: 48 | |
| Day Percent Change: 2.40% Day Change: 2.63 | |
| Week Change: -2.19% Year-to-date Change: 31.6% | |
| MU Links: Profile News Message Board | |
| Charts:- Daily , Weekly | |
| Add MU to Watchlist: View: Get Complete MU Trend Analysis ➞ | |
 | CSX CSX Corporation |
| Sector: Transports | |
| SubSector: Railroads | |
| MarketCap: 42131.2 Millions | |
| Recent Price: 33.57 Smart Investing & Trading Score: 17 | |
| Day Percent Change: 1.11% Day Change: 0.37 | |
| Week Change: -1.24% Year-to-date Change: -3.2% | |
| CSX Links: Profile News Message Board | |
| Charts:- Daily , Weekly | |
| Add CSX to Watchlist: View: Get Complete CSX Trend Analysis ➞ | |
 | PDD Pinduoduo Inc. |
| Sector: Services & Goods | |
| SubSector: Specialty Retail, Other | |
| MarketCap: 41696.2 Millions | |
| Recent Price: 137.54 Smart Investing & Trading Score: 57 | |
| Day Percent Change: 10.48% Day Change: 13.05 | |
| Week Change: 6.36% Year-to-date Change: -6.0% | |
| PDD Links: Profile News Message Board | |
| Charts:- Daily , Weekly | |
| Add PDD to Watchlist: View: Get Complete PDD Trend Analysis ➞ | |
 | AMAT Applied Materials, Inc. |
| Sector: Technology | |
| SubSector: Semiconductor Equipment & Materials | |
| MarketCap: 40593.8 Millions | |
| Recent Price: 197.91 Smart Investing & Trading Score: 17 | |
| Day Percent Change: 2.02% Day Change: 3.92 | |
| Week Change: -2.69% Year-to-date Change: 22.1% | |
| AMAT Links: Profile News Message Board | |
| Charts:- Daily , Weekly | |
| Add AMAT to Watchlist: View: Get Complete AMAT Trend Analysis ➞ | |
 | ILMN Illumina, Inc. |
| Sector: Health Care | |
| SubSector: Biotechnology | |
| MarketCap: 39194.3 Millions | |
| Recent Price: 123.99 Smart Investing & Trading Score: 52 | |
| Day Percent Change: -0.55% Day Change: -0.69 | |
| Week Change: 1.4% Year-to-date Change: -11.0% | |
| ILMN Links: Profile News Message Board | |
| Charts:- Daily , Weekly | |
| Add ILMN to Watchlist: View: Get Complete ILMN Trend Analysis ➞ | |
 | AEP American Electric Power Company, Inc. |
| Sector: Utilities | |
| SubSector: Electric Utilities | |
| MarketCap: 38380 Millions | |
| Recent Price: 88.25 Smart Investing & Trading Score: 100 | |
| Day Percent Change: 0.11% Day Change: 0.10 | |
| Week Change: 3.51% Year-to-date Change: 8.7% | |
| AEP Links: Profile News Message Board | |
| Charts:- Daily , Weekly | |
| Add AEP to Watchlist: View: Get Complete AEP Trend Analysis ➞ | |
 | ADSK Autodesk, Inc. |
| Sector: Technology | |
| SubSector: Technical & System Software | |
| MarketCap: 36975.8 Millions | |
| Recent Price: 209.95 Smart Investing & Trading Score: 10 | |
| Day Percent Change: -0.36% Day Change: -0.76 | |
| Week Change: -3.66% Year-to-date Change: -13.8% | |
| ADSK Links: Profile News Message Board | |
| Charts:- Daily , Weekly | |
| Add ADSK to Watchlist: View: Get Complete ADSK Trend Analysis ➞ | |
 | GEHC GE HealthCare Technologies Inc. |
| Sector: Health Care | |
| SubSector: Health Information Services | |
| MarketCap: 36240 Millions | |
| Recent Price: 78.04 Smart Investing & Trading Score: 0 | |
| Day Percent Change: -0.32% Day Change: -0.25 | |
| Week Change: -9.46% Year-to-date Change: 0.9% | |
| GEHC Links: Profile News Message Board | |
| Charts:- Daily , Weekly | |
| Add GEHC to Watchlist: View: Get Complete GEHC Trend Analysis ➞ | |
 | GFS GLOBALFOUNDRIES Inc. |
| Sector: Technology | |
| SubSector: Semiconductors | |
| MarketCap: 35570 Millions | |
| Recent Price: 47.51 Smart Investing & Trading Score: 24 | |
| Day Percent Change: 0.44% Day Change: 0.21 | |
| Week Change: -1.84% Year-to-date Change: -21.5% | |
| GFS Links: Profile News Message Board | |
| Charts:- Daily , Weekly | |
| Add GFS to Watchlist: View: Get Complete GFS Trend Analysis ➞ | |
 | KDP Keurig Dr Pepper Inc. |
| Sector: Consumer Staples | |
| SubSector: Beverages - Soft Drinks | |
| MarketCap: 35295.2 Millions | |
| Recent Price: 33.56 Smart Investing & Trading Score: 73 | |
| Day Percent Change: 0.66% Day Change: 0.22 | |
| Week Change: -0.47% Year-to-date Change: 0.7% | |
| KDP Links: Profile News Message Board | |
| Charts:- Daily , Weekly | |
| Add KDP to Watchlist: View: Get Complete KDP Trend Analysis ➞ | |
 | EXC Exelon Corporation |
| Sector: Utilities | |
| SubSector: Diversified Utilities | |
| MarketCap: 34091.9 Millions | |
| Recent Price: 37.89 Smart Investing & Trading Score: 88 | |
| Day Percent Change: 0.13% Day Change: 0.05 | |
| Week Change: 1.53% Year-to-date Change: 5.5% | |
| EXC Links: Profile News Message Board | |
| Charts:- Daily , Weekly | |
| Add EXC to Watchlist: View: Get Complete EXC Trend Analysis ➞ | |
 | ROP Roper Technologies, Inc. |
| Sector: Industrials | |
| SubSector: Diversified Machinery | |
| MarketCap: 33366.2 Millions | |
| Recent Price: 510.82 Smart Investing & Trading Score: 8 | |
| Day Percent Change: -0.77% Day Change: -3.94 | |
| Week Change: -3.03% Year-to-date Change: -6.3% | |
| ROP Links: Profile News Message Board | |
| Charts:- Daily , Weekly | |
| Add ROP to Watchlist: View: Get Complete ROP Trend Analysis ➞ | |
 | ADI Analog Devices, Inc. |
| Sector: Technology | |
| SubSector: Semiconductor - Integrated Circuits | |
| MarketCap: 32859 Millions | |
| Recent Price: 196.49 Smart Investing & Trading Score: 58 | |
| Day Percent Change: 1.34% Day Change: 2.60 | |
| Week Change: -2.71% Year-to-date Change: -1.0% | |
| ADI Links: Profile News Message Board | |
| Charts:- Daily , Weekly | |
| Add ADI to Watchlist: View: Get Complete ADI Trend Analysis ➞ | |
 | TEAM Atlassian Corporation Plc |
| Sector: Technology | |
| SubSector: Information Technology Services | |
| MarketCap: 32265.7 Millions | |
| Recent Price: 183.55 Smart Investing & Trading Score: 42 | |
| Day Percent Change: 6.24% Day Change: 10.78 | |
| Week Change: 2.28% Year-to-date Change: -22.8% | |
| TEAM Links: Profile News Message Board | |
| Charts:- Daily , Weekly | |
| Add TEAM to Watchlist: View: Get Complete TEAM Trend Analysis ➞ | |
 | KHC The Kraft Heinz Company |
| Sector: Consumer Staples | |
| SubSector: Food - Major Diversified | |
| MarketCap: 32096.3 Millions | |
| Recent Price: 36.72 Smart Investing & Trading Score: 46 | |
| Day Percent Change: 1.21% Day Change: 0.44 | |
| Week Change: -3.77% Year-to-date Change: -0.7% | |
| KHC Links: Profile News Message Board | |
| Charts:- Daily , Weekly | |
| Add KHC to Watchlist: View: Get Complete KHC Trend Analysis ➞ | |
 | LRCX Lam Research Corporation |
| Sector: Technology | |
| SubSector: Semiconductor Equipment & Materials | |
| MarketCap: 31806 Millions | |
| Recent Price: 883.68 Smart Investing & Trading Score: 17 | |
| Day Percent Change: 1.79% Day Change: 15.58 | |
| Week Change: -4.51% Year-to-date Change: 12.8% | |
| LRCX Links: Profile News Message Board | |
| Charts:- Daily , Weekly | |
| Add LRCX to Watchlist: View: Get Complete LRCX Trend Analysis ➞ | |
 | WDAY Workday, Inc. |
| Sector: Technology | |
| SubSector: Application Software | |
| MarketCap: 31372.1 Millions | |
| Recent Price: 250.85 Smart Investing & Trading Score: 42 | |
| Day Percent Change: 2.40% Day Change: 5.89 | |
| Week Change: -0.08% Year-to-date Change: -9.1% | |
| WDAY Links: Profile News Message Board | |
| Charts:- Daily , Weekly | |
| Add WDAY to Watchlist: View: Get Complete WDAY Trend Analysis ➞ | |
 | MNST Monster Beverage Corporation |
| Sector: Consumer Staples | |
| SubSector: Beverages - Soft Drinks | |
| MarketCap: 30126.8 Millions | |
| Recent Price: 53.39 Smart Investing & Trading Score: 10 | |
| Day Percent Change: -0.28% Day Change: -0.15 | |
| Week Change: 0.04% Year-to-date Change: -7.3% | |
| MNST Links: Profile News Message Board | |
| Charts:- Daily , Weekly | |
| Add MNST to Watchlist: View: Get Complete MNST Trend Analysis ➞ | |
 | CEG Constellation Energy Corporation |
| Sector: Utilities | |
| SubSector: Utilities - Renewable | |
| MarketCap: 29600 Millions | |
| Recent Price: 185.76 Smart Investing & Trading Score: 48 | |
| Day Percent Change: 0.61% Day Change: 1.13 | |
| Week Change: -1.39% Year-to-date Change: 58.6% | |
| CEG Links: Profile News Message Board | |
| Charts:- Daily , Weekly | |
| Add CEG to Watchlist: View: Get Complete CEG Trend Analysis ➞ | |
 | XEL Xcel Energy Inc. |
| Sector: Utilities | |
| SubSector: Electric Utilities | |
| MarketCap: 28960.8 Millions | |
| Recent Price: 53.79 Smart Investing & Trading Score: 61 | |
| Day Percent Change: 0.02% Day Change: 0.01 | |
| Week Change: -0.32% Year-to-date Change: -13.1% | |
| XEL Links: Profile News Message Board | |
| Charts:- Daily , Weekly | |
| Add XEL to Watchlist: View: Get Complete XEL Trend Analysis ➞ | |
 | EA Electronic Arts Inc. |
| Sector: Technology | |
| SubSector: Multimedia & Graphics Software | |
| MarketCap: 27296.5 Millions | |
| Recent Price: 128.50 Smart Investing & Trading Score: 49 | |
| Day Percent Change: 0.25% Day Change: 0.32 | |
| Week Change: 0.47% Year-to-date Change: -6.1% | |
| EA Links: Profile News Message Board | |
| Charts:- Daily , Weekly | |
| Add EA to Watchlist: View: Get Complete EA Trend Analysis ➞ | |
| For tabular summary view of above stock list: Summary View ➞ 0 - 30 , 30 - 60 , 60 - 90 , 90 - 120 | ||
| Click To Change The Sort Order: By Market Cap or Company Size Performance: Year-to-date, Week and Day | |
| Select Chart Type: | ||
|
Best Stocks Today 12Stocks.com |
© 2024 12Stocks.com Terms & Conditions Privacy Contact Us
All Information Provided Only For Education And Not To Be Used For Investing or Trading. See Terms & Conditions


One More Thing ... Get Best Stocks Delivered Daily!
Never Ever Miss A Move With Our Top Ten Stocks Lists
Find Best Stocks In Any Market - Bull or Bear Market
Take A Peek At Our Top Ten Stocks Lists: Daily, Weekly, Year-to-Date & Top Trends
Find Best Stocks In Any Market - Bull or Bear Market
Take A Peek At Our Top Ten Stocks Lists: Daily, Weekly, Year-to-Date & Top Trends
Nasdaq 100 Stocks With Best Up Trends [0-bearish to 100-bullish]: QUALCOMM [100], American Electric[100], Trade Desk[95], NXP Semiconductors[88], Amazon.com [88], Exelon [88], AstraZeneca [83], Amgen [83], Google [81], Google [81], Moderna [80]
Best Nasdaq 100 Stocks Year-to-Date:
NVIDIA [73.29%], Constellation Energy[58.62%], Micron [31.63%], Diamondback Energy[27.44%], Moderna [26.28%], Meta Platforms[24.81%], QUALCOMM [24.52%], Trade Desk[22.46%], Applied Materials[22.11%], Amazon.com [21.57%], Google [19.53%] Best Nasdaq 100 Stocks This Week:
Moderna [16.32%], QUALCOMM [8.72%], MercadoLibre [7.11%], Tesla [6.96%], Pinduoduo [6.36%], Regeneron [6.16%], Verisk Analytics[5.71%], NXP Semiconductors[4.76%], Trade Desk[4%], American Electric[3.51%], Amgen [3.12%] Best Nasdaq 100 Stocks Daily:
Moderna [12.68%], Pinduoduo [10.48%], QUALCOMM [9.74%], Atlassian [6.24%], Marvell [4.47%], Regeneron [3.78%], UltraPro[3.74%], MercadoLibre [3.40%], NVIDIA [3.34%], Amazon.com [3.20%], Trade Desk[3.17%]