
 Login Sign Up


| |||||
 |  | ||||

| 12Stocks.com Market Intelligence |
Best MidCap Stocks
|
| In a hurry? Mid Cap Stocks Lists: Performance Trends Table, Stock Charts
Sort midcap stocks: Daily, Weekly, Year-to-Date, Market Cap & Trends. Filter midcap stocks list by sector: Show all, Tech, Finance, Energy, Staples, Retail, Industrial, Materials, Utilities and HealthCare Filter midcap stocks list by size:All MidCap Large Mid-Range Small |
| 12Stocks.com Mid Cap Stocks Performances & Trends Daily | |||||||||
|
|  The overall Smart Investing & Trading Score is 85 (0-bearish to 100-bullish) which puts Mid Cap index in short term bullish trend. The Smart Investing & Trading Score from previous trading session is 45 and hence an improvement of trend.
| ||||||||
Here are the Smart Investing & Trading Scores of the most requested mid cap stocks at 12Stocks.com (click stock name for detailed review):
|


| 12Stocks.com: Top Performing Mid Cap Index Stocks | ||||||||||||||||||||||||||||||||||||||||||||||||
 The top performing Mid Cap Index stocks year to date are
Now, more recently, over last week, the top performing Mid Cap Index stocks on the move are


|
||||||||||||||||||||||||||||||||||||||||||||||||
| 12Stocks.com: Investing in Midcap Index with Stocks | |
|
The following table helps investors and traders sort through current performance and trends (as measured by Smart Investing & Trading Score) of various
stocks in the Midcap Index. Quick View: Move mouse or cursor over stock symbol (ticker) to view short-term technical chart and over stock name to view long term chart. Click on  to add stock symbol to your watchlist and to add stock symbol to your watchlist and  to view watchlist. Click on any ticker or stock name for detailed market intelligence report for that stock. to view watchlist. Click on any ticker or stock name for detailed market intelligence report for that stock. |
12Stocks.com Performance of Stocks in Midcap Index
| Ticker | Stock Name | Watchlist | Category | Recent Price | Smart Investing & Trading Score | Change % | YTD Change% |
| TYL | Tyler Technologies |   | Technology | 469.00 | 95 | 0.98% | 12.17% |
| WDC | Western Digital | | Technology | 70.95 | 63 | 1.76% | 35.48% |
| JKHY | Jack Henry | | Technology | 164.18 | 32 | 1.03% | 0.47% |
| DDOG | Datadog | | Technology | 124.27 | 0 | -0.95% | 2.38% |
| BR | Broadridge Financial | | Technology | 198.85 | 57 | 1.79% | -3.35% |
| ROKU | Roku | | Technology | 59.11 | 37 | -1.39% | -35.51% |
| SSNC | SS&C Technologies | | Technology | 61.81 | 39 | 0.47% | 1.15% |
| PATH | UiPath | | Technology | 19.48 | 49 | 1.30% | -21.63% |
| GDDY | GoDaddy | | Technology | 123.64 | 78 | -0.55% | 16.47% |
| UI | Ubiquiti | | Technology | 111.20 | 74 | -0.39% | -20.32% |
| QRVO | Qorvo | | Technology | 95.95 | 0 | 0.29% | -14.79% |
| TDY | Teledyne Technologies | | Technology | 385.34 | 42 | -0.07% | -13.66% |
| HOOD | Robinhood Markets | | Technology | 17.95 | 78 | 4.63% | 41.56% |
| PCOR | Procore Technologies | | Technology | 68.13 | 15 | -4.75% | -2.51% |
| NTAP | NetApp | | Technology | 104.64 | 95 | 2.47% | 18.69% |
| FDS | FactSet Research | | Technology | 428.25 | 50 | 1.16% | -10.23% |
| TTD | Trade Desk | | Technology | 88.59 | 95 | 0.53% | 23.11% |
| APP | AppLovin | | Technology | 75.04 | 83 | 4.32% | 88.57% |
| CABO | Cable One | | Technology | 378.45 | 20 | -4.43% | -32.01% |
| TER | Teradyne | | Technology | 120.44 | 100 | 2.60% | 10.98% |
| TRMB | Trimble | | Technology | 55.93 | 0 | -6.92% | 5.13% |
| FICO | Fair Isaac | | Technology | 1193.01 | 57 | 2.37% | 2.49% |
| LYFT | Lyft | | Technology | 17.20 | 58 | 2.14% | 14.74% |
| GTLB | GitLab | | Technology | 54.56 | 42 | 0.37% | -13.90% |
| IT | Gartner | | Technology | 428.64 | 32 | 2.29% | -4.98% |
| For chart view version of above stock list: Chart View ➞ 0 - 25 , 25 - 50 , 50 - 75 , 75 - 100 , 100 - 125 , 125 - 150 | ||
 | Click To Change The Sort Order: By Market Cap or Company Size Performance: Year-to-date, Week and Day |  |
|
Get the most comprehensive stock market coverage daily at 12Stocks.com ➞ Best Stocks Today ➞ Best Stocks Weekly ➞ Best Stocks Year-to-Date ➞ Best Stocks Trends ➞  Best Stocks Today 12Stocks.com Best Nasdaq Stocks ➞ Best S&P 500 Stocks ➞ Best Tech Stocks ➞ Best Biotech Stocks ➞ |
| Detailed Overview of Midcap Stocks |
| Midcap Technical Overview, Leaders & Laggards, Top Midcap ETF Funds & Detailed Midcap Stocks List, Charts, Trends & More |
| Midcap: Technical Analysis, Trends & YTD Performance | |
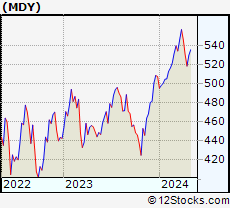
| MidCap segment as represented by
MDY, an exchange-traded fund [ETF], holds basket of about four hundred midcap stocks from across all major sectors of the US stock market. The midcap index (contains stocks like Green Mountain Coffee Roasters and Tractor Supply Company) is up by 5.52% and is currently underperforming the overall market by -1.36% year-to-date. Below is a quick view of technical charts and trends: | |
 MDY Weekly Chart |
|
| Long Term Trend: Good | |
| Medium Term Trend: Good | |
 MDY Daily Chart |
|
| Short Term Trend: Very Good | |
| Overall Trend Score: 85 | |
| YTD Performance: 5.52% | |
| **Trend Scores & Views Are Only For Educational Purposes And Not For Investing | |
| 12Stocks.com: Investing in Midcap Index using Exchange Traded Funds | |
|
The following table shows list of key exchange traded funds (ETF) that
help investors track Midcap index. The following list also includes leveraged ETF funds that track twice or thrice the daily returns of Midcap indices. Short or inverse ETF funds move in the opposite direction to the index they track and are useful during market pullbacks or during bear markets. Quick View: Move mouse or cursor over ETF symbol (ticker) to view short-term technical chart and over ETF name to view long term chart. Click on ticker or stock name for detailed view. Click on to add stock symbol to your watchlist and to view watchlist. |
12Stocks.com List of ETFs that track Midcap Index
| Ticker | ETF Name | Watchlist | Recent Price | Smart Investing & Trading Score | Change % | Week % | Year-to-date % |
| IJH | iShares Core S&P Mid-Cap | | 58.53 | 85 | 1.05 | 1.23 | 5.59% |
| IWR | iShares Russell Mid-Cap | | 80.78 | 60 | 0.72 | 0.32 | 3.92% |
| MDY | SPDR S&P MidCap 400 ETF | | 535.41 | 85 | 1.01 | 1.14 | 5.52% |
| IWP | iShares Russell Mid-Cap Growth | | 108.75 | 39 | 0.54 | -0.21 | 4.11% |
| IJK | iShares S&P Mid-Cap 400 Growth | | 87.89 | 78 | 1.02 | 1.02 | 10.94% |
| IWS | iShares Russell Mid-Cap Value | | 120.70 | 78 | 0.80 | 0.59 | 3.79% |
| IJJ | iShares S&P Mid-Cap 400 Value | | 113.77 | 90 | 0.96 | 1.37 | -0.24% |
| XMLV | PowerShares S&P MidCap Low Volatil ETF | | 55.50 | 100 | 0.62 | 1.56 | 4.36% |
| SMDD | ProShares UltraPro Short MidCap400 | | 11.45 | 10 | -2.82 | -3.23 | -14.97% |
| MVV | ProShares Ultra MidCap400 | | 62.72 | 85 | 2.37 | 2.1 | 8.34% |
| UMDD | ProShares UltraPro MidCap400 | | 24.68 | 85 | 3.08 | 3 | 10.56% |
| MYY | ProShares Short MidCap400 | | 20.57 | 28 | -0.76 | -1.04 | -4.11% |
| MZZ | ProShares UltraShort MidCap400 | | 11.46 | 20 | -2.05 | -1.88 | -8.84% |
| 12Stocks.com: Charts, Trends, Fundamental Data and Performances of MidCap Stocks | |
|
We now take in-depth look at all MidCap stocks including charts, multi-period performances and overall trends (as measured by Smart Investing & Trading Score). One can sort MidCap stocks (click link to choose) by Daily, Weekly and by Year-to-Date performances. Also, one can sort by size of the company or by market capitalization. |
| Select Your Default Chart Type: | |||||
| |||||
| Click on stock symbol or name for detailed view. Click on to add stock symbol to your watchlist and to view watchlist. Quick View: Move mouse or cursor over "Daily" to quickly view daily technical stock chart and over "Weekly" to view weekly technical stock chart. | |||||

 | TYL Tyler Technologies, Inc. |
| Sector: Technology | |
| SubSector: Technical & System Software | |
| MarketCap: 10785 Millions | |
| Recent Price: 469.00 Smart Investing & Trading Score: 95 | |
| Day Percent Change: 0.98% Day Change: 4.54 | |
| Week Change: 1.79% Year-to-date Change: 12.2% | |
| TYL Links: Profile News Message Board | |
| Charts:- Daily , Weekly | |
| Add TYL to Watchlist: View: Get Complete TYL Trend Analysis ➞ | |
 | WDC Western Digital Corporation |
| Sector: Technology | |
| SubSector: Data Storage Devices | |
| MarketCap: 10712.9 Millions | |
| Recent Price: 70.95 Smart Investing & Trading Score: 63 | |
| Day Percent Change: 1.76% Day Change: 1.23 | |
| Week Change: -0.57% Year-to-date Change: 35.5% | |
| WDC Links: Profile News Message Board | |
| Charts:- Daily , Weekly | |
| Add WDC to Watchlist: View: Get Complete WDC Trend Analysis ➞ | |
 | JKHY Jack Henry & Associates, Inc. |
| Sector: Technology | |
| SubSector: Information Technology Services | |
| MarketCap: 10695.4 Millions | |
| Recent Price: 164.18 Smart Investing & Trading Score: 32 | |
| Day Percent Change: 1.03% Day Change: 1.67 | |
| Week Change: -0.42% Year-to-date Change: 0.5% | |
| JKHY Links: Profile News Message Board | |
| Charts:- Daily , Weekly | |
| Add JKHY to Watchlist: View: Get Complete JKHY Trend Analysis ➞ | |
 | DDOG Datadog, Inc. |
| Sector: Technology | |
| SubSector: Application Software | |
| MarketCap: 10653.2 Millions | |
| Recent Price: 124.27 Smart Investing & Trading Score: 0 | |
| Day Percent Change: -0.95% Day Change: -1.19 | |
| Week Change: -5.46% Year-to-date Change: 2.4% | |
| DDOG Links: Profile News Message Board | |
| Charts:- Daily , Weekly | |
| Add DDOG to Watchlist: View: Get Complete DDOG Trend Analysis ➞ | |
 | BR Broadridge Financial Solutions, Inc. |
| Sector: Technology | |
| SubSector: Information Technology Services | |
| MarketCap: 10633.8 Millions | |
| Recent Price: 198.85 Smart Investing & Trading Score: 57 | |
| Day Percent Change: 1.79% Day Change: 3.50 | |
| Week Change: 2.42% Year-to-date Change: -3.4% | |
| BR Links: Profile News Message Board | |
| Charts:- Daily , Weekly | |
| Add BR to Watchlist: View: Get Complete BR Trend Analysis ➞ | |
 | ROKU Roku, Inc. |
| Sector: Technology | |
| SubSector: CATV Systems | |
| MarketCap: 10503.6 Millions | |
| Recent Price: 59.11 Smart Investing & Trading Score: 37 | |
| Day Percent Change: -1.39% Day Change: -0.84 | |
| Week Change: 4.9% Year-to-date Change: -35.5% | |
| ROKU Links: Profile News Message Board | |
| Charts:- Daily , Weekly | |
| Add ROKU to Watchlist: View: Get Complete ROKU Trend Analysis ➞ | |
 | SSNC SS&C Technologies Holdings, Inc. |
| Sector: Technology | |
| SubSector: Business Software & Services | |
| MarketCap: 9884.08 Millions | |
| Recent Price: 61.81 Smart Investing & Trading Score: 39 | |
| Day Percent Change: 0.47% Day Change: 0.29 | |
| Week Change: 0.93% Year-to-date Change: 1.2% | |
| SSNC Links: Profile News Message Board | |
| Charts:- Daily , Weekly | |
| Add SSNC to Watchlist: View: Get Complete SSNC Trend Analysis ➞ | |
 | PATH UiPath Inc. |
| Sector: Technology | |
| SubSector: Software - Infrastructure | |
| MarketCap: 9580 Millions | |
| Recent Price: 19.48 Smart Investing & Trading Score: 49 | |
| Day Percent Change: 1.30% Day Change: 0.25 | |
| Week Change: 0.1% Year-to-date Change: -21.6% | |
| PATH Links: Profile News Message Board | |
| Charts:- Daily , Weekly | |
| Add PATH to Watchlist: View: Get Complete PATH Trend Analysis ➞ | |
 | GDDY GoDaddy Inc. |
| Sector: Technology | |
| SubSector: Internet Software & Services | |
| MarketCap: 9570.51 Millions | |
| Recent Price: 123.64 Smart Investing & Trading Score: 78 | |
| Day Percent Change: -0.55% Day Change: -0.69 | |
| Week Change: -1.1% Year-to-date Change: 16.5% | |
| GDDY Links: Profile News Message Board | |
| Charts:- Daily , Weekly | |
| Add GDDY to Watchlist: View: Get Complete GDDY Trend Analysis ➞ | |
 | UI Ubiquiti Inc. |
| Sector: Technology | |
| SubSector: Communication Equipment | |
| MarketCap: 9526.89 Millions | |
| Recent Price: 111.20 Smart Investing & Trading Score: 74 | |
| Day Percent Change: -0.39% Day Change: -0.43 | |
| Week Change: 2.68% Year-to-date Change: -20.3% | |
| UI Links: Profile News Message Board | |
| Charts:- Daily , Weekly | |
| Add UI to Watchlist: View: Get Complete UI Trend Analysis ➞ | |
 | QRVO Qorvo, Inc. |
| Sector: Technology | |
| SubSector: Semiconductor - Broad Line | |
| MarketCap: 9524.32 Millions | |
| Recent Price: 95.95 Smart Investing & Trading Score: 0 | |
| Day Percent Change: 0.29% Day Change: 0.28 | |
| Week Change: -17.82% Year-to-date Change: -14.8% | |
| QRVO Links: Profile News Message Board | |
| Charts:- Daily , Weekly | |
| Add QRVO to Watchlist: View: Get Complete QRVO Trend Analysis ➞ | |
 | TDY Teledyne Technologies Incorporated |
| Sector: Technology | |
| SubSector: Scientific & Technical Instruments | |
| MarketCap: 9360.43 Millions | |
| Recent Price: 385.34 Smart Investing & Trading Score: 42 | |
| Day Percent Change: -0.07% Day Change: -0.26 | |
| Week Change: 2.86% Year-to-date Change: -13.7% | |
| TDY Links: Profile News Message Board | |
| Charts:- Daily , Weekly | |
| Add TDY to Watchlist: View: Get Complete TDY Trend Analysis ➞ | |
 | HOOD Robinhood Markets, Inc. |
| Sector: Technology | |
| SubSector: Software - Infrastructure | |
| MarketCap: 9200 Millions | |
| Recent Price: 17.95 Smart Investing & Trading Score: 78 | |
| Day Percent Change: 4.63% Day Change: 0.79 | |
| Week Change: 0.34% Year-to-date Change: 41.6% | |
| HOOD Links: Profile News Message Board | |
| Charts:- Daily , Weekly | |
| Add HOOD to Watchlist: View: Get Complete HOOD Trend Analysis ➞ | |
 | PCOR Procore Technologies, Inc. |
| Sector: Technology | |
| SubSector: Software - Application | |
| MarketCap: 9180 Millions | |
| Recent Price: 68.13 Smart Investing & Trading Score: 15 | |
| Day Percent Change: -4.75% Day Change: -3.39 | |
| Week Change: -2.8% Year-to-date Change: -2.5% | |
| PCOR Links: Profile News Message Board | |
| Charts:- Daily , Weekly | |
| Add PCOR to Watchlist: View: Get Complete PCOR Trend Analysis ➞ | |
 | NTAP NetApp, Inc. |
| Sector: Technology | |
| SubSector: Data Storage Devices | |
| MarketCap: 9028.89 Millions | |
| Recent Price: 104.64 Smart Investing & Trading Score: 95 | |
| Day Percent Change: 2.47% Day Change: 2.52 | |
| Week Change: 3.27% Year-to-date Change: 18.7% | |
| NTAP Links: Profile News Message Board | |
| Charts:- Daily , Weekly | |
| Add NTAP to Watchlist: View: Get Complete NTAP Trend Analysis ➞ | |
 | FDS FactSet Research Systems Inc. |
| Sector: Technology | |
| SubSector: Information & Delivery Services | |
| MarketCap: 9024.37 Millions | |
| Recent Price: 428.25 Smart Investing & Trading Score: 50 | |
| Day Percent Change: 1.16% Day Change: 4.89 | |
| Week Change: 1.61% Year-to-date Change: -10.2% | |
| FDS Links: Profile News Message Board | |
| Charts:- Daily , Weekly | |
| Add FDS to Watchlist: View: Get Complete FDS Trend Analysis ➞ | |
 | TTD The Trade Desk, Inc. |
| Sector: Technology | |
| SubSector: Application Software | |
| MarketCap: 9006.92 Millions | |
| Recent Price: 88.59 Smart Investing & Trading Score: 95 | |
| Day Percent Change: 0.53% Day Change: 0.47 | |
| Week Change: 4.56% Year-to-date Change: 23.1% | |
| TTD Links: Profile News Message Board | |
| Charts:- Daily , Weekly | |
| Add TTD to Watchlist: View: Get Complete TTD Trend Analysis ➞ | |
 | APP AppLovin Corporation |
| Sector: Technology | |
| SubSector: Software - Application | |
| MarketCap: 9000 Millions | |
| Recent Price: 75.04 Smart Investing & Trading Score: 83 | |
| Day Percent Change: 4.32% Day Change: 3.11 | |
| Week Change: 1.65% Year-to-date Change: 88.6% | |
| APP Links: Profile News Message Board | |
| Charts:- Daily , Weekly | |
| Add APP to Watchlist: View: Get Complete APP Trend Analysis ➞ | |
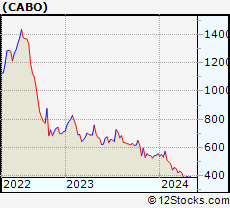 | CABO Cable One, Inc. |
| Sector: Technology | |
| SubSector: Diversified Communication Services | |
| MarketCap: 8350.24 Millions | |
| Recent Price: 378.45 Smart Investing & Trading Score: 20 | |
| Day Percent Change: -4.43% Day Change: -17.53 | |
| Week Change: -2.77% Year-to-date Change: -32.0% | |
| CABO Links: Profile News Message Board | |
| Charts:- Daily , Weekly | |
| Add CABO to Watchlist: View: Get Complete CABO Trend Analysis ➞ | |
 | TER Teradyne, Inc. |
| Sector: Technology | |
| SubSector: Semiconductor Equipment & Materials | |
| MarketCap: 8135.68 Millions | |
| Recent Price: 120.44 Smart Investing & Trading Score: 100 | |
| Day Percent Change: 2.60% Day Change: 3.05 | |
| Week Change: 5.53% Year-to-date Change: 11.0% | |
| TER Links: Profile News Message Board | |
| Charts:- Daily , Weekly | |
| Add TER to Watchlist: View: Get Complete TER Trend Analysis ➞ | |
 | TRMB Trimble Inc. |
| Sector: Technology | |
| SubSector: Scientific & Technical Instruments | |
| MarketCap: 7990.33 Millions | |
| Recent Price: 55.93 Smart Investing & Trading Score: 0 | |
| Day Percent Change: -6.92% Day Change: -4.16 | |
| Week Change: -7.02% Year-to-date Change: 5.1% | |
| TRMB Links: Profile News Message Board | |
| Charts:- Daily , Weekly | |
| Add TRMB to Watchlist: View: Get Complete TRMB Trend Analysis ➞ | |
 | FICO Fair Isaac Corporation |
| Sector: Technology | |
| SubSector: Business Software & Services | |
| MarketCap: 7930.98 Millions | |
| Recent Price: 1193.01 Smart Investing & Trading Score: 57 | |
| Day Percent Change: 2.37% Day Change: 27.66 | |
| Week Change: 7.4% Year-to-date Change: 2.5% | |
| FICO Links: Profile News Message Board | |
| Charts:- Daily , Weekly | |
| Add FICO to Watchlist: View: Get Complete FICO Trend Analysis ➞ | |
 | LYFT Lyft, Inc. |
| Sector: Technology | |
| SubSector: Application Software | |
| MarketCap: 7923.22 Millions | |
| Recent Price: 17.20 Smart Investing & Trading Score: 58 | |
| Day Percent Change: 2.14% Day Change: 0.36 | |
| Week Change: 5.07% Year-to-date Change: 14.7% | |
| LYFT Links: Profile News Message Board | |
| Charts:- Daily , Weekly | |
| Add LYFT to Watchlist: View: Get Complete LYFT Trend Analysis ➞ | |
 | GTLB GitLab Inc. |
| Sector: Technology | |
| SubSector: Software - Application | |
| MarketCap: 7840 Millions | |
| Recent Price: 54.56 Smart Investing & Trading Score: 42 | |
| Day Percent Change: 0.37% Day Change: 0.20 | |
| Week Change: -1.62% Year-to-date Change: -13.9% | |
| GTLB Links: Profile News Message Board | |
| Charts:- Daily , Weekly | |
| Add GTLB to Watchlist: View: Get Complete GTLB Trend Analysis ➞ | |
 | IT Gartner, Inc. |
| Sector: Technology | |
| SubSector: Information Technology Services | |
| MarketCap: 7767.98 Millions | |
| Recent Price: 428.64 Smart Investing & Trading Score: 32 | |
| Day Percent Change: 2.29% Day Change: 9.60 | |
| Week Change: -4.49% Year-to-date Change: -5.0% | |
| IT Links: Profile News Message Board | |
| Charts:- Daily , Weekly | |
| Add IT to Watchlist: View: Get Complete IT Trend Analysis ➞ | |
| For tabular summary view of above stock list: Summary View ➞ 0 - 25 , 25 - 50 , 50 - 75 , 75 - 100 , 100 - 125 , 125 - 150 | ||
| Click To Change The Sort Order: By Market Cap or Company Size Performance: Year-to-date, Week and Day | |
| Select Chart Type: | ||
|
Best Stocks Today 12Stocks.com |
© 2024 12Stocks.com Terms & Conditions Privacy Contact Us
All Information Provided Only For Education And Not To Be Used For Investing or Trading. See Terms & Conditions


One More Thing ... Get Best Stocks Delivered Daily!
Never Ever Miss A Move With Our Top Ten Stocks Lists
Find Best Stocks In Any Market - Bull or Bear Market
Take A Peek At Our Top Ten Stocks Lists: Daily, Weekly, Year-to-Date & Top Trends
Find Best Stocks In Any Market - Bull or Bear Market
Take A Peek At Our Top Ten Stocks Lists: Daily, Weekly, Year-to-Date & Top Trends
Midcap Stocks With Best Up Trends [0-bearish to 100-bullish]: GameStop [100], Tandem Diabetes[100], MasTec [100], Frontier [100], Organon [100], First Solar[100], Reinsurance [100], Brookfield Renewable[100], Camden Property[100], Aptiv [100], Texas Roadhouse[100]
Best Midcap Stocks Year-to-Date:
Vistra Energy[111.55%], AppLovin [88.57%], ShockWave Medical[73.37%], EMCOR [68.86%], Constellation Energy[66.35%], CAVA [65.92%], Tenet [59.16%], Spotify [57.56%], Natera [54.82%], Wingstop [51.43%], Tandem Diabetes[51.18%] Best Midcap Stocks This Week:
GameStop [38.4%], Tandem Diabetes[26.9%], Tenet [25.12%], Wayfair [22.26%], Brookfield Renewable[21.71%], Bio-Techne [20.65%], Pinterest [18.99%], New York[18.86%], Olaplex [18.28%], Valmont Industries[17.25%], NovoCure [16.98%] Best Midcap Stocks Daily:
GameStop [29.08%], Tandem Diabetes[22.32%], Ginkgo Bioworks[12.33%], Paylocity Holding[12.05%], MasTec [11.87%], Plug Power[11.84%], Peloton Interactive[9.42%], Universal Display[9.28%], Sunrun [8.68%], Frontier [8.66%], Wayfair [8.44%]