
 Login Sign Up


| |||||
 |  | ||||

| 12Stocks.com Market Intelligence |
Best MidCap Stocks
|
| In a hurry? Mid Cap Stocks Lists: Performance Trends Table, Stock Charts
Sort midcap stocks: Daily, Weekly, Year-to-Date, Market Cap & Trends. Filter midcap stocks list by sector: Show all, Tech, Finance, Energy, Staples, Retail, Industrial, Materials, Utilities and HealthCare Filter midcap stocks list by size:All MidCap Large Mid-Range Small |
| 12Stocks.com Mid Cap Stocks Performances & Trends Daily | |||||||||
|
|  The overall Smart Investing & Trading Score is 46 (0-bearish to 100-bullish) which puts Mid Cap index in short term neutral trend. The Smart Investing & Trading Score from previous trading session is 70 and hence a deterioration of trend.
| ||||||||
Here are the Smart Investing & Trading Scores of the most requested mid cap stocks at 12Stocks.com (click stock name for detailed review):
|


| 12Stocks.com: Top Performing Mid Cap Index Stocks | ||||||||||||||||||||||||||||||||||||||||||||||||
 The top performing Mid Cap Index stocks year to date are
Now, more recently, over last week, the top performing Mid Cap Index stocks on the move are


|
||||||||||||||||||||||||||||||||||||||||||||||||
| 12Stocks.com: Investing in Midcap Index with Stocks | |
|
The following table helps investors and traders sort through current performance and trends (as measured by Smart Investing & Trading Score) of various
stocks in the Midcap Index. Quick View: Move mouse or cursor over stock symbol (ticker) to view short-term technical chart and over stock name to view long term chart. Click on  to add stock symbol to your watchlist and to add stock symbol to your watchlist and  to view watchlist. Click on any ticker or stock name for detailed market intelligence report for that stock. to view watchlist. Click on any ticker or stock name for detailed market intelligence report for that stock. |
12Stocks.com Performance of Stocks in Midcap Index
| Ticker | Stock Name | Watchlist | Category | Recent Price | Smart Investing & Trading Score | Change % | YTD Change% |
| AKAM | Akamai Technologies |   | Technology | 100.92 | 30 | -0.84% | -14.73% |
| TDC | Teradata | | Technology | 37.10 | 57 | -2.01% | -14.73% |
| CWEN | Clearway Energy | | Utilities | 23.38 | 53 | -0.34% | -14.76% |
| DXC | DXC | | Technology | 19.49 | 20 | -3.90% | -14.78% |
| DAR | Darling Ingredients | | Industrials | 42.37 | 81 | -4.16% | -14.99% |
| ZM | Zoom Video | | Technology | 61.10 | 62 | -2.92% | -15.03% |
| KRC | Kilroy Realty | | Financials | 33.80 | 69 | -1.72% | -15.16% |
| CC | Chemours | | Materials | 26.75 | 67 | -3.39% | -15.19% |
| RKT | Rocket | | Financials | 12.28 | 33 | -1.05% | -15.19% |
| RH | RH | | Services & Goods | 247.05 | 76 | -3.41% | -15.24% |
| ETSY | Etsy | | Services & Goods | 68.67 | 93 | -0.30% | -15.27% |
| EGP | East Properties | | Financials | 155.36 | 18 | -1.56% | -15.35% |
| WPC | W. P. | | Financials | 54.84 | 28 | -1.54% | -15.38% |
| NSA | National Storage | | Financials | 35.04 | 28 | -1.38% | -15.51% |
| MTCH | Match | | Technology | 30.82 | 15 | -2.24% | -15.55% |
| XRAY | DENTSPLY SIRONA | | Health Care | 30.02 | 8 | -2.18% | -15.65% |
| PLTK | Playtika Holding | | Services & Goods | 7.26 | 57 | 0.41% | -15.83% |
| ON | ON Semiconductor | | Technology | 70.27 | 77 | -0.78% | -15.87% |
| THO | Thor Industries | | Consumer Staples | 99.42 | 10 | -3.24% | -15.92% |
| BERY | Berry Global | | Consumer Staples | 56.64 | 57 | -1.41% | -15.95% |
| EPR | EPR Properties | | Financials | 40.59 | 45 | -1.10% | -16.22% |
| BMRN | BioMarin Pharmaceutical | | Health Care | 80.75 | 0 | -1.67% | -16.25% |
| EXR | Extra Space | | Financials | 134.28 | 52 | -2.26% | -16.25% |
| TFX | Teleflex | | Health Care | 208.75 | 35 | 0.13% | -16.28% |
| LSXMA | Liberty SiriusXM | | Services & Goods | 24.05 | 43 | -6.22% | -16.32% |
| For chart view version of above stock list: Chart View ➞ 0 - 25 , 25 - 50 , 50 - 75 , 75 - 100 , 100 - 125 , 125 - 150 , 150 - 175 , 175 - 200 , 200 - 225 , 225 - 250 , 250 - 275 , 275 - 300 , 300 - 325 , 325 - 350 , 350 - 375 , 375 - 400 , 400 - 425 , 425 - 450 , 450 - 475 , 475 - 500 , 500 - 525 , 525 - 550 , 550 - 575 , 575 - 600 , 600 - 625 , 625 - 650 , 650 - 675 , 675 - 700 , 700 - 725 , 725 - 750 , 750 - 775 | ||
 | Click To Change The Sort Order: By Market Cap or Company Size Performance: Year-to-date, Week and Day |  |
|
Get the most comprehensive stock market coverage daily at 12Stocks.com ➞ Best Stocks Today ➞ Best Stocks Weekly ➞ Best Stocks Year-to-Date ➞ Best Stocks Trends ➞  Best Stocks Today 12Stocks.com Best Nasdaq Stocks ➞ Best S&P 500 Stocks ➞ Best Tech Stocks ➞ Best Biotech Stocks ➞ |
| Detailed Overview of Midcap Stocks |
| Midcap Technical Overview, Leaders & Laggards, Top Midcap ETF Funds & Detailed Midcap Stocks List, Charts, Trends & More |
| Midcap: Technical Analysis, Trends & YTD Performance | |
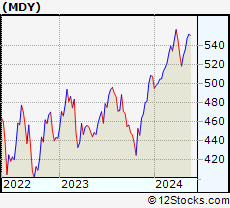
| MidCap segment as represented by
MDY, an exchange-traded fund [ETF], holds basket of about four hundred midcap stocks from across all major sectors of the US stock market. The midcap index (contains stocks like Green Mountain Coffee Roasters and Tractor Supply Company) is up by 3.03% and is currently underperforming the overall market by -1.77% year-to-date. Below is a quick view of technical charts and trends: | |
 MDY Weekly Chart |
|
| Long Term Trend: Good | |
| Medium Term Trend: Not Good | |
 MDY Daily Chart |
|
| Short Term Trend: Not Good | |
| Overall Trend Score: 46 | |
| YTD Performance: 3.03% | |
| **Trend Scores & Views Are Only For Educational Purposes And Not For Investing | |
| 12Stocks.com: Investing in Midcap Index using Exchange Traded Funds | |
|
The following table shows list of key exchange traded funds (ETF) that
help investors track Midcap index. The following list also includes leveraged ETF funds that track twice or thrice the daily returns of Midcap indices. Short or inverse ETF funds move in the opposite direction to the index they track and are useful during market pullbacks or during bear markets. Quick View: Move mouse or cursor over ETF symbol (ticker) to view short-term technical chart and over ETF name to view long term chart. Click on ticker or stock name for detailed view. Click on to add stock symbol to your watchlist and to view watchlist. |
12Stocks.com List of ETFs that track Midcap Index
| Ticker | ETF Name | Watchlist | Recent Price | Smart Investing & Trading Score | Change % | Week % | Year-to-date % |
| IJH | iShares Core S&P Mid-Cap | | 57.13 | 68 | -1.79 | -1.19 | 3.07% |
| MDY | SPDR S&P MidCap 400 ETF | | 522.76 | 46 | -1.79 | -1.25 | 3.03% |
| IWR | iShares Russell Mid-Cap | | 79.64 | 68 | -1.65 | -1.09 | 2.46% |
| IWP | iShares Russell Mid-Cap Growth | | 107.60 | 71 | -1.71 | -1.27 | 3.01% |
| IJK | iShares S&P Mid-Cap 400 Growth | | 85.95 | 63 | -1.78 | -1.21 | 8.5% |
| IWS | iShares Russell Mid-Cap Value | | 118.84 | 68 | -1.59 | -0.96 | 2.19% |
| IJJ | iShares S&P Mid-Cap 400 Value | | 111.50 | 81 | -1.20 | -0.65 | -2.23% |
| XMLV | PowerShares S&P MidCap Low Volatil ETF | | 54.61 | 76 | -0.60 | -0.07 | 2.69% |
| UMDD | ProShares UltraPro MidCap400 | | 23.68 | 31 | -2.63 | -1.17 | 6.09% |
| SMDD | ProShares UltraPro Short MidCap400 | | 11.81 | 57 | 1.64 | -0.17 | -12.28% |
| MVV | ProShares Ultra MidCap400 | | 60.44 | 68 | -2.21 | -1.61 | 4.4% |
| MYY | ProShares Short MidCap400 | | 20.89 | 40 | 0.94 | 0.46 | -2.65% |
| MZZ | ProShares UltraShort MidCap400 | | 11.82 | 27 | 1.98 | 1.2 | -5.97% |
| 12Stocks.com: Charts, Trends, Fundamental Data and Performances of MidCap Stocks | |
|
We now take in-depth look at all MidCap stocks including charts, multi-period performances and overall trends (as measured by Smart Investing & Trading Score). One can sort MidCap stocks (click link to choose) by Daily, Weekly and by Year-to-Date performances. Also, one can sort by size of the company or by market capitalization. |
| Select Your Default Chart Type: | |||||
| |||||
| Click on stock symbol or name for detailed view. Click on to add stock symbol to your watchlist and to view watchlist. Quick View: Move mouse or cursor over "Daily" to quickly view daily technical stock chart and over "Weekly" to view weekly technical stock chart. | |||||

 | AKAM Akamai Technologies, Inc. |
| Sector: Technology | |
| SubSector: Internet Information Providers | |
| MarketCap: 14495.5 Millions | |
| Recent Price: 100.92 Smart Investing & Trading Score: 30 | |
| Day Percent Change: -0.84% Day Change: -0.86 | |
| Week Change: -0.75% Year-to-date Change: -14.7% | |
| AKAM Links: Profile News Message Board | |
| Charts:- Daily , Weekly | |
| Add AKAM to Watchlist: View: Get Complete AKAM Trend Analysis ➞ | |
 | TDC Teradata Corporation |
| Sector: Technology | |
| SubSector: Information Technology Services | |
| MarketCap: 2229.48 Millions | |
| Recent Price: 37.10 Smart Investing & Trading Score: 57 | |
| Day Percent Change: -2.01% Day Change: -0.76 | |
| Week Change: -1.51% Year-to-date Change: -14.7% | |
| TDC Links: Profile News Message Board | |
| Charts:- Daily , Weekly | |
| Add TDC to Watchlist: View: Get Complete TDC Trend Analysis ➞ | |
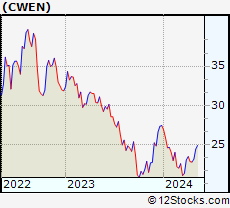 | CWEN Clearway Energy, Inc. |
| Sector: Utilities | |
| SubSector: Electric Utilities | |
| MarketCap: 1545.74 Millions | |
| Recent Price: 23.38 Smart Investing & Trading Score: 53 | |
| Day Percent Change: -0.34% Day Change: -0.08 | |
| Week Change: 1.04% Year-to-date Change: -14.8% | |
| CWEN Links: Profile News Message Board | |
| Charts:- Daily , Weekly | |
| Add CWEN to Watchlist: View: Get Complete CWEN Trend Analysis ➞ | |
 | DXC DXC Technology Company |
| Sector: Technology | |
| SubSector: Information Technology Services | |
| MarketCap: 3622.28 Millions | |
| Recent Price: 19.49 Smart Investing & Trading Score: 20 | |
| Day Percent Change: -3.90% Day Change: -0.79 | |
| Week Change: -2.94% Year-to-date Change: -14.8% | |
| DXC Links: Profile News Message Board | |
| Charts:- Daily , Weekly | |
| Add DXC to Watchlist: View: Get Complete DXC Trend Analysis ➞ | |
 | DAR Darling Ingredients Inc. |
| Sector: Industrials | |
| SubSector: Waste Management | |
| MarketCap: 3075.28 Millions | |
| Recent Price: 42.37 Smart Investing & Trading Score: 81 | |
| Day Percent Change: -4.16% Day Change: -1.84 | |
| Week Change: -5.15% Year-to-date Change: -15.0% | |
| DAR Links: Profile News Message Board | |
| Charts:- Daily , Weekly | |
| Add DAR to Watchlist: View: Get Complete DAR Trend Analysis ➞ | |
 | ZM Zoom Video Communications, Inc. |
| Sector: Technology | |
| SubSector: Application Software | |
| MarketCap: 36358.1 Millions | |
| Recent Price: 61.10 Smart Investing & Trading Score: 62 | |
| Day Percent Change: -2.92% Day Change: -1.84 | |
| Week Change: -1.44% Year-to-date Change: -15.0% | |
| ZM Links: Profile News Message Board | |
| Charts:- Daily , Weekly | |
| Add ZM to Watchlist: View: Get Complete ZM Trend Analysis ➞ | |
 | KRC Kilroy Realty Corporation |
| Sector: Financials | |
| SubSector: REIT - Office | |
| MarketCap: 6390.46 Millions | |
| Recent Price: 33.80 Smart Investing & Trading Score: 69 | |
| Day Percent Change: -1.72% Day Change: -0.59 | |
| Week Change: 1.99% Year-to-date Change: -15.2% | |
| KRC Links: Profile News Message Board | |
| Charts:- Daily , Weekly | |
| Add KRC to Watchlist: View: Get Complete KRC Trend Analysis ➞ | |
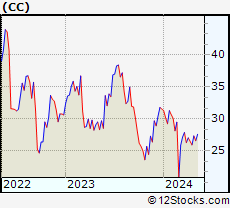 | CC The Chemours Company |
| Sector: Materials | |
| SubSector: Specialty Chemicals | |
| MarketCap: 1718.17 Millions | |
| Recent Price: 26.75 Smart Investing & Trading Score: 67 | |
| Day Percent Change: -3.39% Day Change: -0.94 | |
| Week Change: -2.09% Year-to-date Change: -15.2% | |
| CC Links: Profile News Message Board | |
| Charts:- Daily , Weekly | |
| Add CC to Watchlist: View: Get Complete CC Trend Analysis ➞ | |
 | RKT Rocket Companies, Inc. |
| Sector: Financials | |
| SubSector: Mortgage Finance | |
| MarketCap: 41287 Millions | |
| Recent Price: 12.28 Smart Investing & Trading Score: 33 | |
| Day Percent Change: -1.05% Day Change: -0.13 | |
| Week Change: -0.57% Year-to-date Change: -15.2% | |
| RKT Links: Profile News Message Board | |
| Charts:- Daily , Weekly | |
| Add RKT to Watchlist: View: Get Complete RKT Trend Analysis ➞ | |
 | RH RH |
| Sector: Services & Goods | |
| SubSector: Home Furnishing Stores | |
| MarketCap: 1828.25 Millions | |
| Recent Price: 247.05 Smart Investing & Trading Score: 76 | |
| Day Percent Change: -3.41% Day Change: -8.71 | |
| Week Change: -0.75% Year-to-date Change: -15.2% | |
| RH Links: Profile News Message Board | |
| Charts:- Daily , Weekly | |
| Add RH to Watchlist: View: Get Complete RH Trend Analysis ➞ | |
 | ETSY Etsy, Inc. |
| Sector: Services & Goods | |
| SubSector: Specialty Retail, Other | |
| MarketCap: 4263.24 Millions | |
| Recent Price: 68.67 Smart Investing & Trading Score: 93 | |
| Day Percent Change: -0.30% Day Change: -0.21 | |
| Week Change: 1.84% Year-to-date Change: -15.3% | |
| ETSY Links: Profile News Message Board | |
| Charts:- Daily , Weekly | |
| Add ETSY to Watchlist: View: Get Complete ETSY Trend Analysis ➞ | |
 | EGP EastGroup Properties, Inc. |
| Sector: Financials | |
| SubSector: REIT - Industrial | |
| MarketCap: 4034.29 Millions | |
| Recent Price: 155.36 Smart Investing & Trading Score: 18 | |
| Day Percent Change: -1.56% Day Change: -2.46 | |
| Week Change: -0.36% Year-to-date Change: -15.4% | |
| EGP Links: Profile News Message Board | |
| Charts:- Daily , Weekly | |
| Add EGP to Watchlist: View: Get Complete EGP Trend Analysis ➞ | |
 | WPC W. P. Carey Inc. |
| Sector: Financials | |
| SubSector: REIT - Diversified | |
| MarketCap: 9560.03 Millions | |
| Recent Price: 54.84 Smart Investing & Trading Score: 28 | |
| Day Percent Change: -1.54% Day Change: -0.86 | |
| Week Change: -0.35% Year-to-date Change: -15.4% | |
| WPC Links: Profile News Message Board | |
| Charts:- Daily , Weekly | |
| Add WPC to Watchlist: View: Get Complete WPC Trend Analysis ➞ | |
 | NSA National Storage Affiliates Trust |
| Sector: Financials | |
| SubSector: REIT - Industrial | |
| MarketCap: 1623.99 Millions | |
| Recent Price: 35.04 Smart Investing & Trading Score: 28 | |
| Day Percent Change: -1.38% Day Change: -0.49 | |
| Week Change: 0.34% Year-to-date Change: -15.5% | |
| NSA Links: Profile News Message Board | |
| Charts:- Daily , Weekly | |
| Add NSA to Watchlist: View: Get Complete NSA Trend Analysis ➞ | |
 | MTCH Match Group, Inc. |
| Sector: Technology | |
| SubSector: Internet Information Providers | |
| MarketCap: 14655.8 Millions | |
| Recent Price: 30.82 Smart Investing & Trading Score: 15 | |
| Day Percent Change: -2.24% Day Change: -0.71 | |
| Week Change: -3.34% Year-to-date Change: -15.6% | |
| MTCH Links: Profile News Message Board | |
| Charts:- Daily , Weekly | |
| Add MTCH to Watchlist: View: Get Complete MTCH Trend Analysis ➞ | |
 | XRAY DENTSPLY SIRONA Inc. |
| Sector: Health Care | |
| SubSector: Medical Instruments & Supplies | |
| MarketCap: 7746.1 Millions | |
| Recent Price: 30.02 Smart Investing & Trading Score: 8 | |
| Day Percent Change: -2.18% Day Change: -0.67 | |
| Week Change: -1.8% Year-to-date Change: -15.7% | |
| XRAY Links: Profile News Message Board | |
| Charts:- Daily , Weekly | |
| Add XRAY to Watchlist: View: Get Complete XRAY Trend Analysis ➞ | |
 | PLTK Playtika Holding Corp. |
| Sector: Services & Goods | |
| SubSector: Electronic Gaming & Multimedia | |
| MarketCap: 4260 Millions | |
| Recent Price: 7.26 Smart Investing & Trading Score: 57 | |
| Day Percent Change: 0.41% Day Change: 0.03 | |
| Week Change: 1.54% Year-to-date Change: -15.8% | |
| PLTK Links: Profile News Message Board | |
| Charts:- Daily , Weekly | |
| Add PLTK to Watchlist: View: Get Complete PLTK Trend Analysis ➞ | |
 | ON ON Semiconductor Corporation |
| Sector: Technology | |
| SubSector: Semiconductor - Broad Line | |
| MarketCap: 5183.82 Millions | |
| Recent Price: 70.27 Smart Investing & Trading Score: 77 | |
| Day Percent Change: -0.78% Day Change: -0.55 | |
| Week Change: 3.25% Year-to-date Change: -15.9% | |
| ON Links: Profile News Message Board | |
| Charts:- Daily , Weekly | |
| Add ON to Watchlist: View: Get Complete ON Trend Analysis ➞ | |
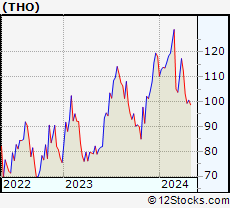 | THO Thor Industries, Inc. |
| Sector: Consumer Staples | |
| SubSector: Recreational Vehicles | |
| MarketCap: 2279.29 Millions | |
| Recent Price: 99.42 Smart Investing & Trading Score: 10 | |
| Day Percent Change: -3.24% Day Change: -3.33 | |
| Week Change: -1.16% Year-to-date Change: -15.9% | |
| THO Links: Profile News Message Board | |
| Charts:- Daily , Weekly | |
| Add THO to Watchlist: View: Get Complete THO Trend Analysis ➞ | |
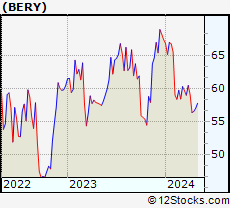 | BERY Berry Global Group, Inc. |
| Sector: Consumer Staples | |
| SubSector: Packaging & Containers | |
| MarketCap: 4349.33 Millions | |
| Recent Price: 56.64 Smart Investing & Trading Score: 57 | |
| Day Percent Change: -1.41% Day Change: -0.81 | |
| Week Change: -0.72% Year-to-date Change: -16.0% | |
| BERY Links: Profile News Message Board | |
| Charts:- Daily , Weekly | |
| Add BERY to Watchlist: View: Get Complete BERY Trend Analysis ➞ | |
 | EPR EPR Properties |
| Sector: Financials | |
| SubSector: REIT - Retail | |
| MarketCap: 2217.64 Millions | |
| Recent Price: 40.59 Smart Investing & Trading Score: 45 | |
| Day Percent Change: -1.10% Day Change: -0.45 | |
| Week Change: -0.98% Year-to-date Change: -16.2% | |
| EPR Links: Profile News Message Board | |
| Charts:- Daily , Weekly | |
| Add EPR to Watchlist: View: Get Complete EPR Trend Analysis ➞ | |
 | BMRN BioMarin Pharmaceutical Inc. |
| Sector: Health Care | |
| SubSector: Biotechnology | |
| MarketCap: 14887.5 Millions | |
| Recent Price: 80.75 Smart Investing & Trading Score: 0 | |
| Day Percent Change: -1.67% Day Change: -1.38 | |
| Week Change: -0.19% Year-to-date Change: -16.3% | |
| BMRN Links: Profile News Message Board | |
| Charts:- Daily , Weekly | |
| Add BMRN to Watchlist: View: Get Complete BMRN Trend Analysis ➞ | |
 | EXR Extra Space Storage Inc. |
| Sector: Financials | |
| SubSector: REIT - Industrial | |
| MarketCap: 11203.9 Millions | |
| Recent Price: 134.28 Smart Investing & Trading Score: 52 | |
| Day Percent Change: -2.26% Day Change: -3.10 | |
| Week Change: 0.61% Year-to-date Change: -16.3% | |
| EXR Links: Profile News Message Board | |
| Charts:- Daily , Weekly | |
| Add EXR to Watchlist: View: Get Complete EXR Trend Analysis ➞ | |
 | TFX Teleflex Incorporated |
| Sector: Health Care | |
| SubSector: Medical Instruments & Supplies | |
| MarketCap: 12989.3 Millions | |
| Recent Price: 208.75 Smart Investing & Trading Score: 35 | |
| Day Percent Change: 0.13% Day Change: 0.27 | |
| Week Change: 0.99% Year-to-date Change: -16.3% | |
| TFX Links: Profile News Message Board | |
| Charts:- Daily , Weekly | |
| Add TFX to Watchlist: View: Get Complete TFX Trend Analysis ➞ | |
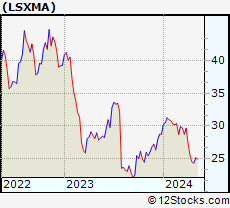 | LSXMA The Liberty SiriusXM Group |
| Sector: Services & Goods | |
| SubSector: Broadcasting - Radio | |
| MarketCap: 14414.5 Millions | |
| Recent Price: 24.05 Smart Investing & Trading Score: 43 | |
| Day Percent Change: -6.22% Day Change: -1.59 | |
| Week Change: -1.07% Year-to-date Change: -16.3% | |
| LSXMA Links: Profile News Message Board | |
| Charts:- Daily , Weekly | |
| Add LSXMA to Watchlist: View: Get Complete LSXMA Trend Analysis ➞ | |
| For tabular summary view of above stock list: Summary View ➞ 0 - 25 , 25 - 50 , 50 - 75 , 75 - 100 , 100 - 125 , 125 - 150 , 150 - 175 , 175 - 200 , 200 - 225 , 225 - 250 , 250 - 275 , 275 - 300 , 300 - 325 , 325 - 350 , 350 - 375 , 375 - 400 , 400 - 425 , 425 - 450 , 450 - 475 , 475 - 500 , 500 - 525 , 525 - 550 , 550 - 575 , 575 - 600 , 600 - 625 , 625 - 650 , 650 - 675 , 675 - 700 , 700 - 725 , 725 - 750 , 750 - 775 | ||
| Click To Change The Sort Order: By Market Cap or Company Size Performance: Year-to-date, Week and Day | |
| Select Chart Type: | ||
|
Best Stocks Today 12Stocks.com |
© 2024 12Stocks.com Terms & Conditions Privacy Contact Us
All Information Provided Only For Education And Not To Be Used For Investing or Trading. See Terms & Conditions


One More Thing ... Get Best Stocks Delivered Daily!
Never Ever Miss A Move With Our Top Ten Stocks Lists
Find Best Stocks In Any Market - Bull or Bear Market
Take A Peek At Our Top Ten Stocks Lists: Daily, Weekly, Year-to-Date & Top Trends
Find Best Stocks In Any Market - Bull or Bear Market
Take A Peek At Our Top Ten Stocks Lists: Daily, Weekly, Year-to-Date & Top Trends
Midcap Stocks With Best Up Trends [0-bearish to 100-bullish]: Tenet [100], Sensata Technologies[100], Leidos [100], Corning [100], Zebra Technologies[100], Timken [100], CAVA [100], Tandem Diabetes[100], Campbell Soup[100], Mosaic [100], Federal Realty[100]
Best Midcap Stocks Year-to-Date:
Vistra Energy[96.88%], AppLovin [77.26%], ShockWave Medical[73.23%], EMCOR [65.79%], CAVA [65.46%], Constellation Energy[58.77%], Wingstop [50%], Antero Resources[49.96%], Spotify [49.24%], Tenet [48.59%], Natera [48.36%] Best Midcap Stocks This Week:
Tenet [16.81%], agilon health[10%], Sensata Technologies[9.52%], Woodward [7.83%], Leidos [7.56%], Tandem Diabetes[7.18%], Corning [6.54%], Maravai LifeSciences[6.49%], Domino s[6.05%], 10x Genomics[6.02%], Zebra Technologies[5.76%] Best Midcap Stocks Daily:
Tenet [13.25%], Woodward [7.48%], agilon health[7.21%], Sensata Technologies[7.13%], Leidos [6.53%], Corning [5.03%], Zebra Technologies[4.78%], Maravai LifeSciences[4.46%], Quidel [3.15%], 10x Genomics[2.99%], Timken [2.91%]