
 Login Sign Up


| |||||
 |  | ||||

| 12Stocks.com Market Intelligence |
Best MidCap Stocks
|
| In a hurry? Mid Cap Stocks Lists: Performance Trends Table, Stock Charts
Sort midcap stocks: Daily, Weekly, Year-to-Date, Market Cap & Trends. Filter midcap stocks list by sector: Show all, Tech, Finance, Energy, Staples, Retail, Industrial, Materials, Utilities and HealthCare Filter midcap stocks list by size:All MidCap Large Mid-Range Small |
| 12Stocks.com Mid Cap Stocks Performances & Trends Daily | |||||||||
|
|  The overall Smart Investing & Trading Score is 38 (0-bearish to 100-bullish) which puts Mid Cap index in short term bearish to neutral trend. The Smart Investing & Trading Score from previous trading session is 70 and hence a deterioration of trend.
| ||||||||
Here are the Smart Investing & Trading Scores of the most requested mid cap stocks at 12Stocks.com (click stock name for detailed review):
|


| 12Stocks.com: Top Performing Mid Cap Index Stocks | ||||||||||||||||||||||||||||||||||||||||||||||||
 The top performing Mid Cap Index stocks year to date are
Now, more recently, over last week, the top performing Mid Cap Index stocks on the move are


|
||||||||||||||||||||||||||||||||||||||||||||||||
| 12Stocks.com: Investing in Midcap Index with Stocks | |
|
The following table helps investors and traders sort through current performance and trends (as measured by Smart Investing & Trading Score) of various
stocks in the Midcap Index. Quick View: Move mouse or cursor over stock symbol (ticker) to view short-term technical chart and over stock name to view long term chart. Click on  to add stock symbol to your watchlist and to add stock symbol to your watchlist and  to view watchlist. Click on any ticker or stock name for detailed market intelligence report for that stock. to view watchlist. Click on any ticker or stock name for detailed market intelligence report for that stock. |
12Stocks.com Performance of Stocks in Midcap Index
| Ticker | Stock Name | Watchlist | Category | Recent Price | Smart Investing & Trading Score | Change % | YTD Change% |
| SEB | Seaboard |   | Industrials | 3310.11 | 67 | 0.44% | -7.28% |
| EA | Electronic Arts | | Technology | 126.82 | 25 | -0.84% | -7.30% |
| AWK | American Water | | Utilities | 122.32 | 55 | 0.03% | -7.33% |
| AXTA | Axalta Coating | | Materials | 31.44 | 57 | -0.73% | -7.45% |
| BURL | Burlington Stores | | Services & Goods | 179.94 | 25 | -1.56% | -7.48% |
| LNG | Cheniere Energy | | Energy | 157.82 | 25 | -2.40% | -7.55% |
| GGG | Graco | | Industrials | 80.20 | 0 | -2.20% | -7.56% |
| FFIV | F5 Networks | | Technology | 165.31 | 0 | -9.24% | -7.64% |
| FHB | First Hawaiian | | Financials | 21.09 | 42 | -1.95% | -7.74% |
| VNO | Vornado Realty | | Financials | 26.03 | 5 | -3.56% | -7.86% |
| JBL | Jabil | | Technology | 117.36 | 17 | -2.09% | -7.88% |
| COTY | Coty | | Consumer Staples | 11.44 | 39 | -0.69% | -7.89% |
| FYBR | Frontier | | Services & Goods | 23.16 | 54 | -1.86% | -8.20% |
| M | Macy s | | Services & Goods | 18.43 | 54 | -0.70% | -8.40% |
| HSIC | Henry Schein | | Services & Goods | 69.28 | 0 | -5.13% | -8.49% |
| PB | Prosperity Bancshares | | Financials | 61.97 | 42 | -1.01% | -8.50% |
| NWL | Newell | | Consumer Staples | 7.94 | 67 | -1.37% | -8.53% |
| IT | Gartner | | Technology | 412.59 | 0 | -8.04% | -8.54% |
| WH | Wyndham Hotels | | Services & Goods | 73.51 | 50 | -1.05% | -8.58% |
| BWA | BorgWarner | | Consumer Staples | 32.77 | 25 | -2.85% | -8.59% |
| ARE | Alexandria Real | | Financials | 115.87 | 10 | -2.75% | -8.60% |
| CRI | Carter s | | Consumer Staples | 68.41 | 0 | -2.88% | -8.65% |
| RGEN | Repligen | | Health Care | 164.20 | 20 | -1.17% | -8.68% |
| TTC | Toro | | Industrials | 87.59 | 62 | -0.34% | -8.75% |
| VRSK | Verisk Analytics | | Services & Goods | 217.96 | 10 | -1.75% | -8.75% |
| For chart view version of above stock list: Chart View ➞ 0 - 25 , 25 - 50 , 50 - 75 , 75 - 100 , 100 - 125 , 125 - 150 , 150 - 175 , 175 - 200 , 200 - 225 , 225 - 250 , 250 - 275 , 275 - 300 , 300 - 325 , 325 - 350 , 350 - 375 , 375 - 400 , 400 - 425 , 425 - 450 , 450 - 475 , 475 - 500 , 500 - 525 , 525 - 550 , 550 - 575 , 575 - 600 , 600 - 625 , 625 - 650 , 650 - 675 , 675 - 700 , 700 - 725 , 725 - 750 , 750 - 775 | ||
 | Click To Change The Sort Order: By Market Cap or Company Size Performance: Year-to-date, Week and Day |  |
|
Get the most comprehensive stock market coverage daily at 12Stocks.com ➞ Best Stocks Today ➞ Best Stocks Weekly ➞ Best Stocks Year-to-Date ➞ Best Stocks Trends ➞  Best Stocks Today 12Stocks.com Best Nasdaq Stocks ➞ Best S&P 500 Stocks ➞ Best Tech Stocks ➞ Best Biotech Stocks ➞ |
| Detailed Overview of Midcap Stocks |
| Midcap Technical Overview, Leaders & Laggards, Top Midcap ETF Funds & Detailed Midcap Stocks List, Charts, Trends & More |
| Midcap: Technical Analysis, Trends & YTD Performance | |
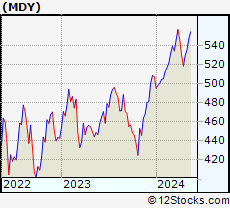
| MidCap segment as represented by
MDY, an exchange-traded fund [ETF], holds basket of about four hundred midcap stocks from across all major sectors of the US stock market. The midcap index (contains stocks like Green Mountain Coffee Roasters and Tractor Supply Company) is up by 3.03% and is currently underperforming the overall market by -1.77% year-to-date. Below is a quick view of technical charts and trends: | |
 MDY Weekly Chart |
|
| Long Term Trend: Good | |
| Medium Term Trend: Not Good | |
 MDY Daily Chart |
|
| Short Term Trend: Not Good | |
| Overall Trend Score: 38 | |
| YTD Performance: 3.03% | |
| **Trend Scores & Views Are Only For Educational Purposes And Not For Investing | |
| 12Stocks.com: Investing in Midcap Index using Exchange Traded Funds | |
|
The following table shows list of key exchange traded funds (ETF) that
help investors track Midcap index. The following list also includes leveraged ETF funds that track twice or thrice the daily returns of Midcap indices. Short or inverse ETF funds move in the opposite direction to the index they track and are useful during market pullbacks or during bear markets. Quick View: Move mouse or cursor over ETF symbol (ticker) to view short-term technical chart and over ETF name to view long term chart. Click on ticker or stock name for detailed view. Click on to add stock symbol to your watchlist and to view watchlist. |
12Stocks.com List of ETFs that track Midcap Index
| Ticker | ETF Name | Watchlist | Recent Price | Smart Investing & Trading Score | Change % | Week % | Year-to-date % |
| IJH | iShares Core S&P Mid-Cap | | 57.13 | 68 | -1.79 | -1.19 | 3.07% |
| MDY | SPDR S&P MidCap 400 ETF | | 522.76 | 38 | -1.79 | -1.25 | 3.03% |
| IWR | iShares Russell Mid-Cap | | 79.62 | 68 | -1.68 | -1.12 | 2.43% |
| IWP | iShares Russell Mid-Cap Growth | | 107.44 | 71 | -1.85 | -1.41 | 2.85% |
| IJK | iShares S&P Mid-Cap 400 Growth | | 85.84 | 63 | -1.91 | -1.33 | 8.36% |
| IWS | iShares Russell Mid-Cap Value | | 118.86 | 68 | -1.57 | -0.94 | 2.21% |
| IJJ | iShares S&P Mid-Cap 400 Value | | 111.06 | 81 | -1.59 | -1.04 | -2.61% |
| XMLV | PowerShares S&P MidCap Low Volatil ETF | | 54.44 | 76 | -0.91 | -0.38 | 2.37% |
| UMDD | ProShares UltraPro MidCap400 | | 23.26 | 31 | -4.36 | -2.92 | 4.21% |
| SMDD | ProShares UltraPro Short MidCap400 | | 12.21 | 57 | 5.08 | 3.21 | -9.31% |
| MVV | ProShares Ultra MidCap400 | | 59.89 | 68 | -3.10 | -2.51 | 3.45% |
| MYY | ProShares Short MidCap400 | | 20.91 | 40 | 1.06 | 0.58 | -2.54% |
| MZZ | ProShares UltraShort MidCap400 | | 11.82 | 27 | 1.98 | 1.2 | -5.97% |
| 12Stocks.com: Charts, Trends, Fundamental Data and Performances of MidCap Stocks | |
|
We now take in-depth look at all MidCap stocks including charts, multi-period performances and overall trends (as measured by Smart Investing & Trading Score). One can sort MidCap stocks (click link to choose) by Daily, Weekly and by Year-to-Date performances. Also, one can sort by size of the company or by market capitalization. |
| Select Your Default Chart Type: | |||||
| |||||
| Click on stock symbol or name for detailed view. Click on to add stock symbol to your watchlist and to view watchlist. Quick View: Move mouse or cursor over "Daily" to quickly view daily technical stock chart and over "Weekly" to view weekly technical stock chart. | |||||

 | SEB Seaboard Corporation |
| Sector: Industrials | |
| SubSector: Conglomerates | |
| MarketCap: 3161.78 Millions | |
| Recent Price: 3310.11 Smart Investing & Trading Score: 67 | |
| Day Percent Change: 0.44% Day Change: 14.62 | |
| Week Change: 3.21% Year-to-date Change: -7.3% | |
| SEB Links: Profile News Message Board | |
| Charts:- Daily , Weekly | |
| Add SEB to Watchlist: View: Get Complete SEB Trend Analysis ➞ | |
 | EA Electronic Arts Inc. |
| Sector: Technology | |
| SubSector: Multimedia & Graphics Software | |
| MarketCap: 27296.5 Millions | |
| Recent Price: 126.82 Smart Investing & Trading Score: 25 | |
| Day Percent Change: -0.84% Day Change: -1.08 | |
| Week Change: -0.84% Year-to-date Change: -7.3% | |
| EA Links: Profile News Message Board | |
| Charts:- Daily , Weekly | |
| Add EA to Watchlist: View: Get Complete EA Trend Analysis ➞ | |
 | AWK American Water Works Company, Inc. |
| Sector: Utilities | |
| SubSector: Water Utilities | |
| MarketCap: 20029.2 Millions | |
| Recent Price: 122.32 Smart Investing & Trading Score: 55 | |
| Day Percent Change: 0.03% Day Change: 0.04 | |
| Week Change: 1.28% Year-to-date Change: -7.3% | |
| AWK Links: Profile News Message Board | |
| Charts:- Daily , Weekly | |
| Add AWK to Watchlist: View: Get Complete AWK Trend Analysis ➞ | |
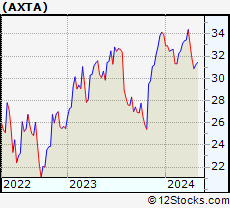 | AXTA Axalta Coating Systems Ltd. |
| Sector: Materials | |
| SubSector: Specialty Chemicals | |
| MarketCap: 3931.17 Millions | |
| Recent Price: 31.44 Smart Investing & Trading Score: 57 | |
| Day Percent Change: -0.73% Day Change: -0.23 | |
| Week Change: 0.7% Year-to-date Change: -7.5% | |
| AXTA Links: Profile News Message Board | |
| Charts:- Daily , Weekly | |
| Add AXTA to Watchlist: View: Get Complete AXTA Trend Analysis ➞ | |
 | BURL Burlington Stores, Inc. |
| Sector: Services & Goods | |
| SubSector: Discount, Variety Stores | |
| MarketCap: 9801.42 Millions | |
| Recent Price: 179.94 Smart Investing & Trading Score: 25 | |
| Day Percent Change: -1.56% Day Change: -2.86 | |
| Week Change: -2.31% Year-to-date Change: -7.5% | |
| BURL Links: Profile News Message Board | |
| Charts:- Daily , Weekly | |
| Add BURL to Watchlist: View: Get Complete BURL Trend Analysis ➞ | |
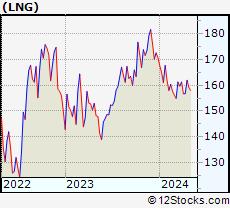 | LNG Cheniere Energy, Inc. |
| Sector: Energy | |
| SubSector: Oil & Gas Pipelines | |
| MarketCap: 9905.15 Millions | |
| Recent Price: 157.82 Smart Investing & Trading Score: 25 | |
| Day Percent Change: -2.40% Day Change: -3.88 | |
| Week Change: -0.83% Year-to-date Change: -7.6% | |
| LNG Links: Profile News Message Board | |
| Charts:- Daily , Weekly | |
| Add LNG to Watchlist: View: Get Complete LNG Trend Analysis ➞ | |
 | GGG Graco Inc. |
| Sector: Industrials | |
| SubSector: Diversified Machinery | |
| MarketCap: 7739.76 Millions | |
| Recent Price: 80.20 Smart Investing & Trading Score: 0 | |
| Day Percent Change: -2.20% Day Change: -1.80 | |
| Week Change: -2.86% Year-to-date Change: -7.6% | |
| GGG Links: Profile News Message Board | |
| Charts:- Daily , Weekly | |
| Add GGG to Watchlist: View: Get Complete GGG Trend Analysis ➞ | |
 | FFIV F5 Networks, Inc. |
| Sector: Technology | |
| SubSector: Business Software & Services | |
| MarketCap: 6675.38 Millions | |
| Recent Price: 165.31 Smart Investing & Trading Score: 0 | |
| Day Percent Change: -9.24% Day Change: -16.82 | |
| Week Change: -9.14% Year-to-date Change: -7.6% | |
| FFIV Links: Profile News Message Board | |
| Charts:- Daily , Weekly | |
| Add FFIV to Watchlist: View: Get Complete FFIV Trend Analysis ➞ | |
 | FHB First Hawaiian, Inc. |
| Sector: Financials | |
| SubSector: Regional - Pacific Banks | |
| MarketCap: 2398.99 Millions | |
| Recent Price: 21.09 Smart Investing & Trading Score: 42 | |
| Day Percent Change: -1.95% Day Change: -0.42 | |
| Week Change: -3.65% Year-to-date Change: -7.7% | |
| FHB Links: Profile News Message Board | |
| Charts:- Daily , Weekly | |
| Add FHB to Watchlist: View: Get Complete FHB Trend Analysis ➞ | |
 | VNO Vornado Realty Trust |
| Sector: Financials | |
| SubSector: REIT - Diversified | |
| MarketCap: 6300.63 Millions | |
| Recent Price: 26.03 Smart Investing & Trading Score: 5 | |
| Day Percent Change: -3.56% Day Change: -0.96 | |
| Week Change: -0.88% Year-to-date Change: -7.9% | |
| VNO Links: Profile News Message Board | |
| Charts:- Daily , Weekly | |
| Add VNO to Watchlist: View: Get Complete VNO Trend Analysis ➞ | |
 | JBL Jabil Inc. |
| Sector: Technology | |
| SubSector: Printed Circuit Boards | |
| MarketCap: 3272.15 Millions | |
| Recent Price: 117.36 Smart Investing & Trading Score: 17 | |
| Day Percent Change: -2.09% Day Change: -2.51 | |
| Week Change: -0.77% Year-to-date Change: -7.9% | |
| JBL Links: Profile News Message Board | |
| Charts:- Daily , Weekly | |
| Add JBL to Watchlist: View: Get Complete JBL Trend Analysis ➞ | |
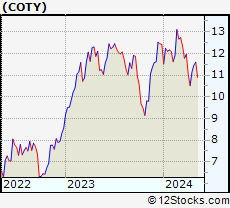 | COTY Coty Inc. |
| Sector: Consumer Staples | |
| SubSector: Personal Products | |
| MarketCap: 4023.65 Millions | |
| Recent Price: 11.44 Smart Investing & Trading Score: 39 | |
| Day Percent Change: -0.69% Day Change: -0.08 | |
| Week Change: -0.17% Year-to-date Change: -7.9% | |
| COTY Links: Profile News Message Board | |
| Charts:- Daily , Weekly | |
| Add COTY to Watchlist: View: Get Complete COTY Trend Analysis ➞ | |
 | FYBR Frontier Communications Parent, Inc. |
| Sector: Services & Goods | |
| SubSector: Telecom Services | |
| MarketCap: 4460 Millions | |
| Recent Price: 23.16 Smart Investing & Trading Score: 54 | |
| Day Percent Change: -1.86% Day Change: -0.44 | |
| Week Change: 0.89% Year-to-date Change: -8.2% | |
| FYBR Links: Profile News Message Board | |
| Charts:- Daily , Weekly | |
| Add FYBR to Watchlist: View: Get Complete FYBR Trend Analysis ➞ | |
 | M Macy s, Inc. |
| Sector: Services & Goods | |
| SubSector: Department Stores | |
| MarketCap: 2391.72 Millions | |
| Recent Price: 18.43 Smart Investing & Trading Score: 54 | |
| Day Percent Change: -0.70% Day Change: -0.13 | |
| Week Change: 0% Year-to-date Change: -8.4% | |
| M Links: Profile News Message Board | |
| Charts:- Daily , Weekly | |
| Add M to Watchlist: View: Get Complete M Trend Analysis ➞ | |
 | HSIC Henry Schein, Inc. |
| Sector: Services & Goods | |
| SubSector: Medical Equipment Wholesale | |
| MarketCap: 6760.9 Millions | |
| Recent Price: 69.28 Smart Investing & Trading Score: 0 | |
| Day Percent Change: -5.13% Day Change: -3.75 | |
| Week Change: -5.26% Year-to-date Change: -8.5% | |
| HSIC Links: Profile News Message Board | |
| Charts:- Daily , Weekly | |
| Add HSIC to Watchlist: View: Get Complete HSIC Trend Analysis ➞ | |
 | PB Prosperity Bancshares, Inc. |
| Sector: Financials | |
| SubSector: Regional - Southwest Banks | |
| MarketCap: 4682.25 Millions | |
| Recent Price: 61.97 Smart Investing & Trading Score: 42 | |
| Day Percent Change: -1.01% Day Change: -0.63 | |
| Week Change: -2.49% Year-to-date Change: -8.5% | |
| PB Links: Profile News Message Board | |
| Charts:- Daily , Weekly | |
| Add PB to Watchlist: View: Get Complete PB Trend Analysis ➞ | |
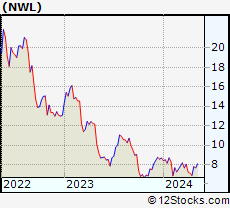 | NWL Newell Brands Inc. |
| Sector: Consumer Staples | |
| SubSector: Housewares & Accessories | |
| MarketCap: 5833.53 Millions | |
| Recent Price: 7.94 Smart Investing & Trading Score: 67 | |
| Day Percent Change: -1.37% Day Change: -0.11 | |
| Week Change: 1.93% Year-to-date Change: -8.5% | |
| NWL Links: Profile News Message Board | |
| Charts:- Daily , Weekly | |
| Add NWL to Watchlist: View: Get Complete NWL Trend Analysis ➞ | |
 | IT Gartner, Inc. |
| Sector: Technology | |
| SubSector: Information Technology Services | |
| MarketCap: 7767.98 Millions | |
| Recent Price: 412.59 Smart Investing & Trading Score: 0 | |
| Day Percent Change: -8.04% Day Change: -36.06 | |
| Week Change: -8.06% Year-to-date Change: -8.5% | |
| IT Links: Profile News Message Board | |
| Charts:- Daily , Weekly | |
| Add IT to Watchlist: View: Get Complete IT Trend Analysis ➞ | |
 | WH Wyndham Hotels & Resorts, Inc. |
| Sector: Services & Goods | |
| SubSector: Lodging | |
| MarketCap: 2656.66 Millions | |
| Recent Price: 73.51 Smart Investing & Trading Score: 50 | |
| Day Percent Change: -1.05% Day Change: -0.78 | |
| Week Change: -0.38% Year-to-date Change: -8.6% | |
| WH Links: Profile News Message Board | |
| Charts:- Daily , Weekly | |
| Add WH to Watchlist: View: Get Complete WH Trend Analysis ➞ | |
 | BWA BorgWarner Inc. |
| Sector: Consumer Staples | |
| SubSector: Auto Parts | |
| MarketCap: 4604.09 Millions | |
| Recent Price: 32.77 Smart Investing & Trading Score: 25 | |
| Day Percent Change: -2.85% Day Change: -0.96 | |
| Week Change: -1.27% Year-to-date Change: -8.6% | |
| BWA Links: Profile News Message Board | |
| Charts:- Daily , Weekly | |
| Add BWA to Watchlist: View: Get Complete BWA Trend Analysis ➞ | |
 | ARE Alexandria Real Estate Equities, Inc. |
| Sector: Financials | |
| SubSector: REIT - Office | |
| MarketCap: 16793.6 Millions | |
| Recent Price: 115.87 Smart Investing & Trading Score: 10 | |
| Day Percent Change: -2.75% Day Change: -3.28 | |
| Week Change: -0.32% Year-to-date Change: -8.6% | |
| ARE Links: Profile News Message Board | |
| Charts:- Daily , Weekly | |
| Add ARE to Watchlist: View: Get Complete ARE Trend Analysis ➞ | |
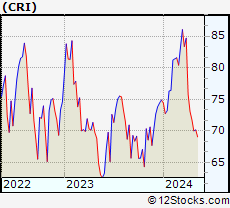 | CRI Carter s, Inc. |
| Sector: Consumer Staples | |
| SubSector: Textile - Apparel Clothing | |
| MarketCap: 3173.55 Millions | |
| Recent Price: 68.41 Smart Investing & Trading Score: 0 | |
| Day Percent Change: -2.88% Day Change: -2.03 | |
| Week Change: -2.29% Year-to-date Change: -8.7% | |
| CRI Links: Profile News Message Board | |
| Charts:- Daily , Weekly | |
| Add CRI to Watchlist: View: Get Complete CRI Trend Analysis ➞ | |
 | RGEN Repligen Corporation |
| Sector: Health Care | |
| SubSector: Biotechnology | |
| MarketCap: 4711.75 Millions | |
| Recent Price: 164.20 Smart Investing & Trading Score: 20 | |
| Day Percent Change: -1.17% Day Change: -1.94 | |
| Week Change: -1.43% Year-to-date Change: -8.7% | |
| RGEN Links: Profile News Message Board | |
| Charts:- Daily , Weekly | |
| Add RGEN to Watchlist: View: Get Complete RGEN Trend Analysis ➞ | |
 | TTC The Toro Company |
| Sector: Industrials | |
| SubSector: Small Tools & Accessories | |
| MarketCap: 6426.96 Millions | |
| Recent Price: 87.59 Smart Investing & Trading Score: 62 | |
| Day Percent Change: -0.34% Day Change: -0.30 | |
| Week Change: 0.1% Year-to-date Change: -8.8% | |
| TTC Links: Profile News Message Board | |
| Charts:- Daily , Weekly | |
| Add TTC to Watchlist: View: Get Complete TTC Trend Analysis ➞ | |
 | VRSK Verisk Analytics, Inc. |
| Sector: Services & Goods | |
| SubSector: Business Services | |
| MarketCap: 22033.2 Millions | |
| Recent Price: 217.96 Smart Investing & Trading Score: 10 | |
| Day Percent Change: -1.75% Day Change: -3.89 | |
| Week Change: -1.44% Year-to-date Change: -8.8% | |
| VRSK Links: Profile News Message Board | |
| Charts:- Daily , Weekly | |
| Add VRSK to Watchlist: View: Get Complete VRSK Trend Analysis ➞ | |
| For tabular summary view of above stock list: Summary View ➞ 0 - 25 , 25 - 50 , 50 - 75 , 75 - 100 , 100 - 125 , 125 - 150 , 150 - 175 , 175 - 200 , 200 - 225 , 225 - 250 , 250 - 275 , 275 - 300 , 300 - 325 , 325 - 350 , 350 - 375 , 375 - 400 , 400 - 425 , 425 - 450 , 450 - 475 , 475 - 500 , 500 - 525 , 525 - 550 , 550 - 575 , 575 - 600 , 600 - 625 , 625 - 650 , 650 - 675 , 675 - 700 , 700 - 725 , 725 - 750 , 750 - 775 | ||
| Click To Change The Sort Order: By Market Cap or Company Size Performance: Year-to-date, Week and Day | |
| Select Chart Type: | ||
|
Best Stocks Today 12Stocks.com |
© 2024 12Stocks.com Terms & Conditions Privacy Contact Us
All Information Provided Only For Education And Not To Be Used For Investing or Trading. See Terms & Conditions


One More Thing ... Get Best Stocks Delivered Daily!
Never Ever Miss A Move With Our Top Ten Stocks Lists
Find Best Stocks In Any Market - Bull or Bear Market
Take A Peek At Our Top Ten Stocks Lists: Daily, Weekly, Year-to-Date & Top Trends
Find Best Stocks In Any Market - Bull or Bear Market
Take A Peek At Our Top Ten Stocks Lists: Daily, Weekly, Year-to-Date & Top Trends
Midcap Stocks With Best Up Trends [0-bearish to 100-bullish]: Tenet [100], Sensata Technologies[100], Leidos [100], Corning [100], Zebra Technologies[100], Timken [100], CAVA [100], Mosaic [100], Federal Realty[100], Public Service[100], DaVita [100]
Best Midcap Stocks Year-to-Date:
Vistra Energy[96.88%], AppLovin [77.26%], ShockWave Medical[73.27%], EMCOR [65.79%], CAVA [65.46%], Constellation Energy[58.77%], Wingstop [49.97%], Antero Resources[49.96%], Spotify [49.24%], Tenet [48.59%], Natera [48.28%] Best Midcap Stocks This Week:
Tenet [16.81%], agilon health[10%], Sensata Technologies[9.52%], Woodward [7.82%], Leidos [7.56%], Corning [6.54%], Maravai LifeSciences[6.49%], 10x Genomics[6.13%], Domino s[6.05%], Zebra Technologies[5.84%], Timken [4.99%] Best Midcap Stocks Daily:
Tenet [13.25%], Woodward [7.47%], agilon health[7.21%], Sensata Technologies[7.13%], Leidos [6.53%], Corning [5.03%], Zebra Technologies[4.85%], Maravai LifeSciences[4.46%], 10x Genomics[3.10%], Quidel [3.02%], Timken [2.91%]