
 Login Sign Up


| |||||
 |  | ||||

| 12Stocks.com Market Intelligence |
Best Industrial Stocks
| In a hurry? Industrial Stocks Lists: Performance Trends Table, Stock Charts
Sort Industrial stocks: Daily, Weekly, Year-to-Date, Market Cap & Trends. Filter Industrial stocks list by size:All Industrial Large Mid-Range Small |
| 12Stocks.com Industrial Stocks Performances & Trends Daily | |||||||||
|
|  The overall Smart Investing & Trading Score is 20 (0-bearish to 100-bullish) which puts Industrial sector in short term bearish trend. The Smart Investing & Trading Score from previous trading session is 38 and hence a deterioration of trend.
| ||||||||
Here are the Smart Investing & Trading Scores of the most requested Industrial stocks at 12Stocks.com (click stock name for detailed review):
|


| 12Stocks.com: Investing in Industrial sector with Stocks | |
|
The following table helps investors and traders sort through current performance and trends (as measured by Smart Investing & Trading Score) of various
stocks in the Industrial sector. Quick View: Move mouse or cursor over stock symbol (ticker) to view short-term Technical chart and over stock name to view long term chart. Click on  to add stock symbol to your watchlist and to add stock symbol to your watchlist and  to view watchlist. Click on any ticker or stock name for detailed market intelligence report for that stock. to view watchlist. Click on any ticker or stock name for detailed market intelligence report for that stock. |
12Stocks.com Performance of Stocks in Industrial Sector
| Ticker | Stock Name | Watchlist | Category | Recent Price | Smart Investing & Trading Score | Change % | YTD Change% |
| RYI | Ryerson Holding |   | Fabrication | 24.78 | 0 | -13.20% | -28.55% |
| HI | Hillenbrand | | Machinery | 41.43 | 0 | -13.18% | -13.42% |
| SWIM | Latham | | Building Products & Equipment | 2.45 | 0 | -12.50% | -7.20% |
| LII | Lennox | | Machinery | 455.15 | 0 | -1.78% | 1.70% |
| BIOX | Bioceres Crop | | Conglomerates | 11.66 | 0 | -1.19% | -15.08% |
| FSS | Federal Signal | | Pollution & Treatment Controls | 80.34 | 0 | -1.18% | 4.69% |
| CAT | Caterpillar | | Machinery | 331.07 | 0 | -1.05% | 11.97% |
| MIDD | Middleby | | Machinery | 137.51 | 0 | -1.05% | -6.56% |
| SRCL | Stericycle | | Waste Mgmt | 44.30 | 0 | -0.96% | -10.61% |
| BOOM | DMC Global | | Fabrication | 15.70 | 0 | -0.95% | -16.58% |
| ITW | Illinois Tool | | Machinery | 242.27 | 0 | -0.75% | -7.51% |
| NNBR | NN | | Machine Tools | 3.54 | 0 | -0.70% | -11.63% |
| TEX | Terex | | Machinery | 55.78 | 0 | -0.48% | -2.92% |
| ROK | Rockwell Automation | | Machinery | 269.75 | 0 | -0.45% | -13.12% |
| PATK | Patrick Industries | | Lumber, Wood | 104.06 | 0 | -0.41% | 3.70% |
| AME | AMETEK | | Machinery | 173.98 | 0 | -0.39% | 5.51% |
| LECO | Loln Electric | | Small Tools & Accessories | 219.33 | 0 | -0.09% | 0.86% |
| WCN | Waste Connections | | Waste Mgmt | 162.06 | 0 | -0.02% | 8.57% |
| For chart view version of above stock list: Chart View ➞ 0 - 25 , 25 - 50 , 50 - 75 , 75 - 100 , 100 - 125 , 125 - 150 , 150 - 175 , 175 - 200 , 200 - 225 , 225 - 250 , 250 - 275 , 275 - 300 | ||
 | Click To Change The Sort Order: By Market Cap or Company Size Performance: Year-to-date, Week and Day |  |
|
Get the most comprehensive stock market coverage daily at 12Stocks.com ➞ Best Stocks Today ➞ Best Stocks Weekly ➞ Best Stocks Year-to-Date ➞ Best Stocks Trends ➞  Best Stocks Today 12Stocks.com Best Nasdaq Stocks ➞ Best S&P 500 Stocks ➞ Best Tech Stocks ➞ Best Biotech Stocks ➞ |
| Detailed Overview of Industrial Stocks |
| Industrial Technical Overview, Leaders & Laggards, Top Industrial ETF Funds & Detailed Industrial Stocks List, Charts, Trends & More |
| Industrial Sector: Technical Analysis, Trends & YTD Performance | |
| Industrial sector is composed of stocks
from industrial machinery, aerospace, defense, farm/construction
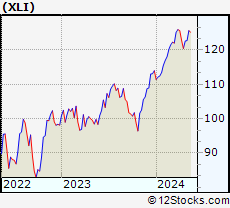
and industrial services subsectors. Industrial sector, as represented by XLI, an exchange-traded fund [ETF] that holds basket of Industrial stocks (e.g, Caterpillar, Boeing) is up by 6.34% and is currently outperforming the overall market by 1.8% year-to-date. Below is a quick view of Technical charts and trends: |
|
 XLI Weekly Chart |
|
| Long Term Trend: Good | |
| Medium Term Trend: Not Good | |
 XLI Daily Chart |
|
| Short Term Trend: Not Good | |
| Overall Trend Score: 20 | |
| YTD Performance: 6.34% | |
| **Trend Scores & Views Are Only For Educational Purposes And Not For Investing | |
| 12Stocks.com: Top Performing Industrial Sector Stocks | ||||||||||||||||||||||||||||||||||||||||||||||||
 The top performing Industrial sector stocks year to date are
Now, more recently, over last week, the top performing Industrial sector stocks on the move are


|
||||||||||||||||||||||||||||||||||||||||||||||||
| 12Stocks.com: Investing in Industrial Sector using Exchange Traded Funds | |
|
The following table shows list of key exchange traded funds (ETF) that
help investors track Industrial Index. For detailed view, check out our ETF Funds section of our website. Quick View: Move mouse or cursor over ETF symbol (ticker) to view short-term Technical chart and over ETF name to view long term chart. Click on ticker or stock name for detailed view. Click on to add stock symbol to your watchlist and to view watchlist. |
12Stocks.com List of ETFs that track Industrial Index
| Ticker | ETF Name | Watchlist | Recent Price | Smart Investing & Trading Score | Change % | Week % | Year-to-date % |
| XLI | Industrial | | 121.22 | 20 | -0.25 | -1.17 | 6.34% |
| UXI | Industrials | | 31.89 | 20 | -1.15 | -2.57 | 10.75% |
| PPA | Aerospace & Defense | | 101.17 | 66 | -0.06 | 0.26 | 9.78% |
| ITA | Aerospace & Defense | | 130.11 | 66 | 0.20 | 0.45 | 2.77% |
| ITB | Home Construction | | 104.07 | 10 | 0.21 | -1.5 | 2.3% |
| XHB | Homebuilders | | 102.19 | 7 | -0.41 | -1.48 | 6.83% |
| SIJ | Short Industrials | | 10.11 | 80 | 1.04 | 3 | -10.81% |
| IYJ | Industrials | | 119.51 | 7 | -0.54 | -1.69 | 4.5% |
| EXI | Global Industrials | | 134.90 | 38 | 0.04 | -0.87 | 5.86% |
| VIS | Industrials | | 233.21 | 20 | -0.36 | -1.39 | 5.8% |
| PSCI | SmallCap Industrials | | 118.80 | 0 | -0.40 | -2.11 | 2.45% |
| XAR | Aerospace & Defense | | 136.87 | 63 | 0.62 | 0.56 | 1.07% |
| ARKQ | ARK Industrial Innovation | | 53.16 | 45 | -0.28 | -0.37 | -7.87% |
| 12Stocks.com: Charts, Trends, Fundamental Data and Performances of Industrial Stocks | |
|
We now take in-depth look at all Industrial stocks including charts, multi-period performances and overall trends (as measured by Smart Investing & Trading Score). One can sort Industrial stocks (click link to choose) by Daily, Weekly and by Year-to-Date performances. Also, one can sort by size of the company or by market capitalization. |
| Select Your Default Chart Type: | |||||
| |||||
| Click on stock symbol or name for detailed view. Click on to add stock symbol to your watchlist and to view watchlist. Quick View: Move mouse or cursor over "Daily" to quickly view daily Technical stock chart and over "Weekly" to view weekly Technical stock chart. | |||||

 | RYI Ryerson Holding Corporation |
| Sector: Industrials | |
| SubSector: Metal Fabrication | |
| MarketCap: 202.55 Millions | |
| Recent Price: 24.78 Smart Investing & Trading Score: 0 | |
| Day Percent Change: -13.20% Day Change: -3.77 | |
| Week Change: -19.18% Year-to-date Change: -28.6% | |
| RYI Links: Profile News Message Board | |
| Charts:- Daily , Weekly | |
| Add RYI to Watchlist: View: Get Complete RYI Trend Analysis ➞ | |
 | HI Hillenbrand, Inc. |
| Sector: Industrials | |
| SubSector: Diversified Machinery | |
| MarketCap: 1389.86 Millions | |
| Recent Price: 41.43 Smart Investing & Trading Score: 0 | |
| Day Percent Change: -13.18% Day Change: -6.29 | |
| Week Change: -16.15% Year-to-date Change: -13.4% | |
| HI Links: Profile News Message Board | |
| Charts:- Daily , Weekly | |
| Add HI to Watchlist: View: Get Complete HI Trend Analysis ➞ | |
 | SWIM Latham Group, Inc. |
| Sector: Industrials | |
| SubSector: Building Products & Equipment | |
| MarketCap: 388 Millions | |
| Recent Price: 2.45 Smart Investing & Trading Score: 0 | |
| Day Percent Change: -12.50% Day Change: -0.35 | |
| Week Change: -19.67% Year-to-date Change: -7.2% | |
| SWIM Links: Profile News Message Board | |
| Charts:- Daily , Weekly | |
| Add SWIM to Watchlist: View: Get Complete SWIM Trend Analysis ➞ | |
 | LII Lennox International Inc. |
| Sector: Industrials | |
| SubSector: Diversified Machinery | |
| MarketCap: 7720.66 Millions | |
| Recent Price: 455.15 Smart Investing & Trading Score: 0 | |
| Day Percent Change: -1.78% Day Change: -8.27 | |
| Week Change: -4.6% Year-to-date Change: 1.7% | |
| LII Links: Profile News Message Board | |
| Charts:- Daily , Weekly | |
| Add LII to Watchlist: View: Get Complete LII Trend Analysis ➞ | |
 | BIOX Bioceres Crop Solutions Corp. |
| Sector: Industrials | |
| SubSector: Conglomerates | |
| MarketCap: 198.348 Millions | |
| Recent Price: 11.66 Smart Investing & Trading Score: 0 | |
| Day Percent Change: -1.19% Day Change: -0.14 | |
| Week Change: -3.24% Year-to-date Change: -15.1% | |
| BIOX Links: Profile News Message Board | |
| Charts:- Daily , Weekly | |
| Add BIOX to Watchlist: View: Get Complete BIOX Trend Analysis ➞ | |
 | FSS Federal Signal Corporation |
| Sector: Industrials | |
| SubSector: Pollution & Treatment Controls | |
| MarketCap: 1694.05 Millions | |
| Recent Price: 80.34 Smart Investing & Trading Score: 0 | |
| Day Percent Change: -1.18% Day Change: -0.96 | |
| Week Change: -4.22% Year-to-date Change: 4.7% | |
| FSS Links: Profile News Message Board | |
| Charts:- Daily , Weekly | |
| Add FSS to Watchlist: View: Get Complete FSS Trend Analysis ➞ | |
 | CAT Caterpillar Inc. |
| Sector: Industrials | |
| SubSector: Farm & Construction Machinery | |
| MarketCap: 58636 Millions | |
| Recent Price: 331.07 Smart Investing & Trading Score: 0 | |
| Day Percent Change: -1.05% Day Change: -3.50 | |
| Week Change: -3.58% Year-to-date Change: 12.0% | |
| CAT Links: Profile News Message Board | |
| Charts:- Daily , Weekly | |
| Add CAT to Watchlist: View: Get Complete CAT Trend Analysis ➞ | |
 | MIDD The Middleby Corporation |
| Sector: Industrials | |
| SubSector: Diversified Machinery | |
| MarketCap: 3070.36 Millions | |
| Recent Price: 137.51 Smart Investing & Trading Score: 0 | |
| Day Percent Change: -1.05% Day Change: -1.46 | |
| Week Change: -2.65% Year-to-date Change: -6.6% | |
| MIDD Links: Profile News Message Board | |
| Charts:- Daily , Weekly | |
| Add MIDD to Watchlist: View: Get Complete MIDD Trend Analysis ➞ | |
 | SRCL Stericycle, Inc. |
| Sector: Industrials | |
| SubSector: Waste Management | |
| MarketCap: 4285.78 Millions | |
| Recent Price: 44.30 Smart Investing & Trading Score: 0 | |
| Day Percent Change: -0.96% Day Change: -0.43 | |
| Week Change: -4.34% Year-to-date Change: -10.6% | |
| SRCL Links: Profile News Message Board | |
| Charts:- Daily , Weekly | |
| Add SRCL to Watchlist: View: Get Complete SRCL Trend Analysis ➞ | |
 | BOOM DMC Global Inc. |
| Sector: Industrials | |
| SubSector: Metal Fabrication | |
| MarketCap: 359.15 Millions | |
| Recent Price: 15.70 Smart Investing & Trading Score: 0 | |
| Day Percent Change: -0.95% Day Change: -0.15 | |
| Week Change: -4.79% Year-to-date Change: -16.6% | |
| BOOM Links: Profile News Message Board | |
| Charts:- Daily , Weekly | |
| Add BOOM to Watchlist: View: Get Complete BOOM Trend Analysis ➞ | |
 | ITW Illinois Tool Works Inc. |
| Sector: Industrials | |
| SubSector: Diversified Machinery | |
| MarketCap: 45324.8 Millions | |
| Recent Price: 242.27 Smart Investing & Trading Score: 0 | |
| Day Percent Change: -0.75% Day Change: -1.84 | |
| Week Change: -2.42% Year-to-date Change: -7.5% | |
| ITW Links: Profile News Message Board | |
| Charts:- Daily , Weekly | |
| Add ITW to Watchlist: View: Get Complete ITW Trend Analysis ➞ | |
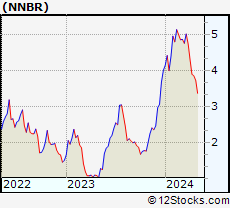 | NNBR NN, Inc. |
| Sector: Industrials | |
| SubSector: Machine Tools & Accessories | |
| MarketCap: 103.348 Millions | |
| Recent Price: 3.54 Smart Investing & Trading Score: 0 | |
| Day Percent Change: -0.70% Day Change: -0.02 | |
| Week Change: -4.97% Year-to-date Change: -11.6% | |
| NNBR Links: Profile News Message Board | |
| Charts:- Daily , Weekly | |
| Add NNBR to Watchlist: View: Get Complete NNBR Trend Analysis ➞ | |
 | TEX Terex Corporation |
| Sector: Industrials | |
| SubSector: Farm & Construction Machinery | |
| MarketCap: 1083.07 Millions | |
| Recent Price: 55.78 Smart Investing & Trading Score: 0 | |
| Day Percent Change: -0.48% Day Change: -0.27 | |
| Week Change: -6.39% Year-to-date Change: -2.9% | |
| TEX Links: Profile News Message Board | |
| Charts:- Daily , Weekly | |
| Add TEX to Watchlist: View: Get Complete TEX Trend Analysis ➞ | |
 | ROK Rockwell Automation, Inc. |
| Sector: Industrials | |
| SubSector: Diversified Machinery | |
| MarketCap: 15666.1 Millions | |
| Recent Price: 269.75 Smart Investing & Trading Score: 0 | |
| Day Percent Change: -0.45% Day Change: -1.21 | |
| Week Change: -3.7% Year-to-date Change: -13.1% | |
| ROK Links: Profile News Message Board | |
| Charts:- Daily , Weekly | |
| Add ROK to Watchlist: View: Get Complete ROK Trend Analysis ➞ | |
 | PATK Patrick Industries, Inc. |
| Sector: Industrials | |
| SubSector: Lumber, Wood Production | |
| MarketCap: 565.838 Millions | |
| Recent Price: 104.06 Smart Investing & Trading Score: 0 | |
| Day Percent Change: -0.41% Day Change: -0.43 | |
| Week Change: -1.36% Year-to-date Change: 3.7% | |
| PATK Links: Profile News Message Board | |
| Charts:- Daily , Weekly | |
| Add PATK to Watchlist: View: Get Complete PATK Trend Analysis ➞ | |
 | AME AMETEK, Inc. |
| Sector: Industrials | |
| SubSector: Diversified Machinery | |
| MarketCap: 16611.8 Millions | |
| Recent Price: 173.98 Smart Investing & Trading Score: 0 | |
| Day Percent Change: -0.39% Day Change: -0.68 | |
| Week Change: -1.99% Year-to-date Change: 5.5% | |
| AME Links: Profile News Message Board | |
| Charts:- Daily , Weekly | |
| Add AME to Watchlist: View: Get Complete AME Trend Analysis ➞ | |
 | LECO Lincoln Electric Holdings, Inc. |
| Sector: Industrials | |
| SubSector: Small Tools & Accessories | |
| MarketCap: 4085.06 Millions | |
| Recent Price: 219.33 Smart Investing & Trading Score: 0 | |
| Day Percent Change: -0.09% Day Change: -0.20 | |
| Week Change: -4.61% Year-to-date Change: 0.9% | |
| LECO Links: Profile News Message Board | |
| Charts:- Daily , Weekly | |
| Add LECO to Watchlist: View: Get Complete LECO Trend Analysis ➞ | |
 | WCN Waste Connections, Inc. |
| Sector: Industrials | |
| SubSector: Waste Management | |
| MarketCap: 23055.8 Millions | |
| Recent Price: 162.06 Smart Investing & Trading Score: 0 | |
| Day Percent Change: -0.02% Day Change: -0.03 | |
| Week Change: -0.87% Year-to-date Change: 8.6% | |
| WCN Links: Profile News Message Board | |
| Charts:- Daily , Weekly | |
| Add WCN to Watchlist: View: Get Complete WCN Trend Analysis ➞ | |
| For tabular summary view of above stock list: Summary View ➞ 0 - 25 , 25 - 50 , 50 - 75 , 75 - 100 , 100 - 125 , 125 - 150 , 150 - 175 , 175 - 200 , 200 - 225 , 225 - 250 , 250 - 275 , 275 - 300 | ||
| Click To Change The Sort Order: By Market Cap or Company Size Performance: Year-to-date, Week and Day | |
| Select Chart Type: | ||
|
Best Stocks Today 12Stocks.com |
© 2024 12Stocks.com Terms & Conditions Privacy Contact Us
All Information Provided Only For Education And Not To Be Used For Investing or Trading. See Terms & Conditions


One More Thing ... Get Best Stocks Delivered Daily!
Never Ever Miss A Move With Our Top Ten Stocks Lists
Find Best Stocks In Any Market - Bull or Bear Market
Take A Peek At Our Top Ten Stocks Lists: Daily, Weekly, Year-to-Date & Top Trends
Find Best Stocks In Any Market - Bull or Bear Market
Take A Peek At Our Top Ten Stocks Lists: Daily, Weekly, Year-to-Date & Top Trends
Industrial Stocks With Best Up Trends [0-bearish to 100-bullish]: Pinterest [100], Carpenter Technology[100], Clean Harbors[100], TPI Composites[100], United States[100], CAE [100], Woodward [100], 3M [100], AeroVironment [100], AMN Healthcare[100], Allegheny Technologies[100]
Best Industrial Stocks Year-to-Date:
Intuitive Machines[111.93%], Powell Industries[92.32%], Tutor Perini[84.29%], FTAI Infrastructure[82.78%], NuScale Power[77.67%], Caesarstone [68.72%], IES [67.31%], EMCOR [64.9%], BiomX [58.79%], Masonite [56.65%], ADS-TEC Energy[52.59%] Best Industrial Stocks This Week:
BiomX [27.03%], TPI Composites[19.78%], Pinterest [19.2%], Carpenter Technology[17.06%], Amprius Technologies[15.52%], Powell Industries[14.24%], Allegheny Technologies[13.72%], Woodward [10.15%], Lilium N.V[9.6%], Luxfer [8.74%], Hydrofarm [8.51%] Best Industrial Stocks Daily:
Pinterest [21.02%], Powell Industries[18.89%], Carpenter Technology[14.74%], LanzaTech Global[9.93%], Luxfer [9.87%], Amprius Technologies[7.49%], Lilium N.V[7.32%], Clean Harbors[6.81%], Virgin Galactic[6.57%], Sky Harbour[5.44%], TPI Composites[4.72%]