
 Login Sign Up


| |||||
 |  | ||||

| 12Stocks.com Market Intelligence |
Best Industrial Stocks
| In a hurry? Industrial Stocks Lists: Performance Trends Table, Stock Charts
Sort Industrial stocks: Daily, Weekly, Year-to-Date, Market Cap & Trends. Filter Industrial stocks list by size:All Industrial Large Mid-Range Small |
| 12Stocks.com Industrial Stocks Performances & Trends Daily | |||||||||
|
|  The overall Smart Investing & Trading Score is 31 (0-bearish to 100-bullish) which puts Industrial sector in short term bearish to neutral trend. The Smart Investing & Trading Score from previous trading session is 26 and an improvement of trend continues.
| ||||||||
Here are the Smart Investing & Trading Scores of the most requested Industrial stocks at 12Stocks.com (click stock name for detailed review):
|


| 12Stocks.com: Investing in Industrial sector with Stocks | |
|
The following table helps investors and traders sort through current performance and trends (as measured by Smart Investing & Trading Score) of various
stocks in the Industrial sector. Quick View: Move mouse or cursor over stock symbol (ticker) to view short-term Technical chart and over stock name to view long term chart. Click on  to add stock symbol to your watchlist and to add stock symbol to your watchlist and  to view watchlist. Click on any ticker or stock name for detailed market intelligence report for that stock. to view watchlist. Click on any ticker or stock name for detailed market intelligence report for that stock. |
12Stocks.com Performance of Stocks in Industrial Sector
| Ticker | Stock Name | Watchlist | Category | Recent Price | Smart Investing & Trading Score | Change % | YTD Change% |
| B | Barnes |   | Equipment | 36.08 | 68 | 8.06% | 10.57% |
| ULCC | Frontier | | Airlines | 7.17 | 68 | 3.99% | 31.95% |
| LUNR | Intuitive Machines | | Aerospace & Defense | 5.15 | 68 | 2.18% | 111.93% |
| MEG | Montrose Environmental | | Waste Mgmt | 41.92 | 68 | 12.84% | 30.35% |
| CNM | Core & Main | | Industrial Distribution | 55.60 | 68 | 1.52% | 37.23% |
| DE | Deere & | | Machinery | 400.60 | 68 | 0.94% | 0.18% |
| MLI | Mueller Industries | | Fabrication | 52.32 | 68 | 0.67% | 10.97% |
| HRT | HireRight | | Staffing & Employment | 14.25 | 68 | 0.07% | 5.95% |
| USLM | United States | | Building Materials | 295.01 | 68 | 0.84% | 28.07% |
| XYL | Xylem | | Machinery | 127.16 | 68 | 0.74% | 11.19% |
| MIR | Mirion Technologies | | Specialty Industrial Machinery | 10.86 | 63 | 2.74% | 5.85% |
| NPK | National Presto | | Aerospace/Defense | 79.99 | 63 | 0.78% | -0.36% |
| RSG | Republic Services | | Waste Mgmt | 188.97 | 63 | 0.01% | 14.59% |
| TGLS | Tecnoglass | | Building Materials | 56.54 | 63 | -1.07% | 23.69% |
| EAF | GrafTech | | Machinery | 1.48 | 63 | -0.67% | -32.42% |
| SMR | NuScale Power | | Specialty Industrial Machinery | 4.99 | 61 | 1.12% | 54.57% |
| PCT | PureCycle Technologies | | Pollution & Treatment Controls | 5.31 | 61 | 3.51% | 30.95% |
| HI | Hillenbrand | | Machinery | 47.30 | 61 | 1.20% | -1.15% |
| WTTR | Select Energy | | Pollution & Treatment Controls | 9.05 | 61 | 0.78% | 19.24% |
| ATI | Allegheny Technologies | | Fabrication | 51.10 | 61 | 0.73% | 12.38% |
| AVAV | AeroVironment | | Aerospace/Defense | 146.70 | 61 | 0.05% | 16.39% |
| EVTL | Vertical Aerospace | | Aerospace & Defense | 0.75 | 61 | -1.19% | 10.19% |
| FIP | FTAI Infrastructure | | Industrials | 6.70 | 60 | 2.37% | 72.11% |
| LLAP | Terran Orbital | | Aerospace & Defense | 1.35 | 59 | -6.90% | 17.90% |
| POWL | Powell Industries | | Machinery | 128.14 | 58 | 3.81% | 44.95% |
| For chart view version of above stock list: Chart View ➞ 0 - 25 , 25 - 50 , 50 - 75 , 75 - 100 , 100 - 125 , 125 - 150 , 150 - 175 , 175 - 200 , 200 - 225 , 225 - 250 , 250 - 275 , 275 - 300 | ||
 | Click To Change The Sort Order: By Market Cap or Company Size Performance: Year-to-date, Week and Day |  |
|
Get the most comprehensive stock market coverage daily at 12Stocks.com ➞ Best Stocks Today ➞ Best Stocks Weekly ➞ Best Stocks Year-to-Date ➞ Best Stocks Trends ➞  Best Stocks Today 12Stocks.com Best Nasdaq Stocks ➞ Best S&P 500 Stocks ➞ Best Tech Stocks ➞ Best Biotech Stocks ➞ |
| Detailed Overview of Industrial Stocks |
| Industrial Technical Overview, Leaders & Laggards, Top Industrial ETF Funds & Detailed Industrial Stocks List, Charts, Trends & More |
| Industrial Sector: Technical Analysis, Trends & YTD Performance | |
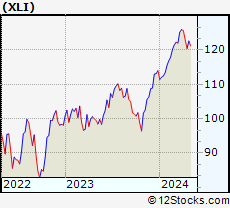
| Industrial sector is composed of stocks
from industrial machinery, aerospace, defense, farm/construction
and industrial services subsectors. Industrial sector, as represented by XLI, an exchange-traded fund [ETF] that holds basket of Industrial stocks (e.g, Caterpillar, Boeing) is up by 5.88% and is currently outperforming the overall market by 1.69% year-to-date. Below is a quick view of Technical charts and trends: |
|
 XLI Weekly Chart |
|
| Long Term Trend: Good | |
| Medium Term Trend: Not Good | |
 XLI Daily Chart |
|
| Short Term Trend: Not Good | |
| Overall Trend Score: 31 | |
| YTD Performance: 5.88% | |
| **Trend Scores & Views Are Only For Educational Purposes And Not For Investing | |
| 12Stocks.com: Top Performing Industrial Sector Stocks | ||||||||||||||||||||||||||||||||||||||||||||||||
 The top performing Industrial sector stocks year to date are
Now, more recently, over last week, the top performing Industrial sector stocks on the move are


|
||||||||||||||||||||||||||||||||||||||||||||||||
| 12Stocks.com: Investing in Industrial Sector using Exchange Traded Funds | |
|
The following table shows list of key exchange traded funds (ETF) that
help investors track Industrial Index. For detailed view, check out our ETF Funds section of our website. Quick View: Move mouse or cursor over ETF symbol (ticker) to view short-term Technical chart and over ETF name to view long term chart. Click on ticker or stock name for detailed view. Click on to add stock symbol to your watchlist and to view watchlist. |
12Stocks.com List of ETFs that track Industrial Index
| Ticker | ETF Name | Watchlist | Recent Price | Smart Investing & Trading Score | Change % | Week % | Year-to-date % |
| XLI | Industrial | | 120.69 | 31 | -0.35 | -1.8 | 5.88% |
| UXI | Industrials | | 31.66 | 31 | -0.38 | -3.67 | 9.95% |
| PPA | Aerospace & Defense | | 98.11 | 56 | -0.17 | -0.98 | 6.46% |
| ITA | Aerospace & Defense | | 127.46 | 51 | -0.04 | -0.2 | 0.68% |
| ITB | Home Construction | | 103.00 | 43 | 0.07 | -3.97 | 1.25% |
| XHB | Homebuilders | | 100.70 | 43 | -0.08 | -3.4 | 5.27% |
| SIJ | Short Industrials | | 10.23 | 64 | 0.94 | 4.22 | -9.79% |
| IYJ | Industrials | | 119.30 | 26 | -0.39 | -2 | 4.32% |
| EXI | Global Industrials | | 133.63 | 36 | -0.14 | -1.64 | 4.87% |
| VIS | Industrials | | 232.29 | 31 | -0.34 | -2.17 | 5.38% |
| PSCI | SmallCap Industrials | | 118.23 | 26 | -0.29 | -2.51 | 1.96% |
| XAR | Aerospace & Defense | | 132.10 | 51 | -0.01 | -1.23 | -2.45% |
| ARKQ | ARK Industrial Innovation | | 50.21 | 0 | -0.30 | -4.36 | -12.98% |
| 12Stocks.com: Charts, Trends, Fundamental Data and Performances of Industrial Stocks | |
|
We now take in-depth look at all Industrial stocks including charts, multi-period performances and overall trends (as measured by Smart Investing & Trading Score). One can sort Industrial stocks (click link to choose) by Daily, Weekly and by Year-to-Date performances. Also, one can sort by size of the company or by market capitalization. |
| Select Your Default Chart Type: | |||||
| |||||
| Click on stock symbol or name for detailed view. Click on to add stock symbol to your watchlist and to view watchlist. Quick View: Move mouse or cursor over "Daily" to quickly view daily Technical stock chart and over "Weekly" to view weekly Technical stock chart. | |||||

 | B Barnes Group Inc. |
| Sector: Industrials | |
| SubSector: Industrial Equipment & Components | |
| MarketCap: 2189.79 Millions | |
| Recent Price: 36.08 Smart Investing & Trading Score: 68 | |
| Day Percent Change: 8.06% Day Change: 2.69 | |
| Week Change: 2.79% Year-to-date Change: 10.6% | |
| B Links: Profile News Message Board | |
| Charts:- Daily , Weekly | |
| Add B to Watchlist: View: Get Complete B Trend Analysis ➞ | |
 | ULCC Frontier Group Holdings, Inc. |
| Sector: Industrials | |
| SubSector: Airlines | |
| MarketCap: 2160 Millions | |
| Recent Price: 7.17 Smart Investing & Trading Score: 68 | |
| Day Percent Change: 3.99% Day Change: 0.28 | |
| Week Change: 6.62% Year-to-date Change: 32.0% | |
| ULCC Links: Profile News Message Board | |
| Charts:- Daily , Weekly | |
| Add ULCC to Watchlist: View: Get Complete ULCC Trend Analysis ➞ | |
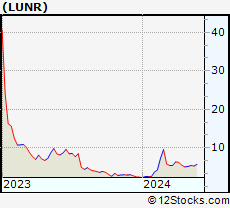 | LUNR Intuitive Machines, Inc. |
| Sector: Industrials | |
| SubSector: Aerospace & Defense | |
| MarketCap: 714 Millions | |
| Recent Price: 5.15 Smart Investing & Trading Score: 68 | |
| Day Percent Change: 2.18% Day Change: 0.11 | |
| Week Change: 1.38% Year-to-date Change: 111.9% | |
| LUNR Links: Profile News Message Board | |
| Charts:- Daily , Weekly | |
| Add LUNR to Watchlist: View: Get Complete LUNR Trend Analysis ➞ | |
 | MEG Montrose Environmental Group, Inc. |
| Sector: Industrials | |
| SubSector: Waste Management | |
| MarketCap: 71627 Millions | |
| Recent Price: 41.92 Smart Investing & Trading Score: 68 | |
| Day Percent Change: 12.84% Day Change: 4.77 | |
| Week Change: -6.14% Year-to-date Change: 30.4% | |
| MEG Links: Profile News Message Board | |
| Charts:- Daily , Weekly | |
| Add MEG to Watchlist: View: Get Complete MEG Trend Analysis ➞ | |
 | CNM Core & Main, Inc. |
| Sector: Industrials | |
| SubSector: Industrial Distribution | |
| MarketCap: 7150 Millions | |
| Recent Price: 55.60 Smart Investing & Trading Score: 68 | |
| Day Percent Change: 1.52% Day Change: 0.83 | |
| Week Change: -1.3% Year-to-date Change: 37.2% | |
| CNM Links: Profile News Message Board | |
| Charts:- Daily , Weekly | |
| Add CNM to Watchlist: View: Get Complete CNM Trend Analysis ➞ | |
 | DE Deere & Company |
| Sector: Industrials | |
| SubSector: Farm & Construction Machinery | |
| MarketCap: 39168.7 Millions | |
| Recent Price: 400.60 Smart Investing & Trading Score: 68 | |
| Day Percent Change: 0.94% Day Change: 3.72 | |
| Week Change: 0.84% Year-to-date Change: 0.2% | |
| DE Links: Profile News Message Board | |
| Charts:- Daily , Weekly | |
| Add DE to Watchlist: View: Get Complete DE Trend Analysis ➞ | |
 | MLI Mueller Industries, Inc. |
| Sector: Industrials | |
| SubSector: Metal Fabrication | |
| MarketCap: 1259.5 Millions | |
| Recent Price: 52.32 Smart Investing & Trading Score: 68 | |
| Day Percent Change: 0.67% Day Change: 0.35 | |
| Week Change: 1.16% Year-to-date Change: 11.0% | |
| MLI Links: Profile News Message Board | |
| Charts:- Daily , Weekly | |
| Add MLI to Watchlist: View: Get Complete MLI Trend Analysis ➞ | |
 | HRT HireRight Holdings Corporation |
| Sector: Industrials | |
| SubSector: Staffing & Employment Services | |
| MarketCap: 823 Millions | |
| Recent Price: 14.25 Smart Investing & Trading Score: 68 | |
| Day Percent Change: 0.07% Day Change: 0.01 | |
| Week Change: 0.07% Year-to-date Change: 6.0% | |
| HRT Links: Profile News Message Board | |
| Charts:- Daily , Weekly | |
| Add HRT to Watchlist: View: Get Complete HRT Trend Analysis ➞ | |
 | USLM United States Lime & Minerals, Inc. |
| Sector: Industrials | |
| SubSector: General Building Materials | |
| MarketCap: 427.653 Millions | |
| Recent Price: 295.01 Smart Investing & Trading Score: 68 | |
| Day Percent Change: 0.84% Day Change: 2.46 | |
| Week Change: 0.79% Year-to-date Change: 28.1% | |
| USLM Links: Profile News Message Board | |
| Charts:- Daily , Weekly | |
| Add USLM to Watchlist: View: Get Complete USLM Trend Analysis ➞ | |
 | XYL Xylem Inc. |
| Sector: Industrials | |
| SubSector: Diversified Machinery | |
| MarketCap: 12195.1 Millions | |
| Recent Price: 127.16 Smart Investing & Trading Score: 68 | |
| Day Percent Change: 0.74% Day Change: 0.94 | |
| Week Change: -0.74% Year-to-date Change: 11.2% | |
| XYL Links: Profile News Message Board | |
| Charts:- Daily , Weekly | |
| Add XYL to Watchlist: View: Get Complete XYL Trend Analysis ➞ | |
 | MIR Mirion Technologies, Inc. |
| Sector: Industrials | |
| SubSector: Specialty Industrial Machinery | |
| MarketCap: 1920 Millions | |
| Recent Price: 10.86 Smart Investing & Trading Score: 63 | |
| Day Percent Change: 2.74% Day Change: 0.29 | |
| Week Change: 1.5% Year-to-date Change: 5.9% | |
| MIR Links: Profile News Message Board | |
| Charts:- Daily , Weekly | |
| Add MIR to Watchlist: View: Get Complete MIR Trend Analysis ➞ | |
 | NPK National Presto Industries, Inc. |
| Sector: Industrials | |
| SubSector: Aerospace/Defense Products & Services | |
| MarketCap: 540.401 Millions | |
| Recent Price: 79.99 Smart Investing & Trading Score: 63 | |
| Day Percent Change: 0.78% Day Change: 0.62 | |
| Week Change: 0.5% Year-to-date Change: -0.4% | |
| NPK Links: Profile News Message Board | |
| Charts:- Daily , Weekly | |
| Add NPK to Watchlist: View: Get Complete NPK Trend Analysis ➞ | |
 | RSG Republic Services, Inc. |
| Sector: Industrials | |
| SubSector: Waste Management | |
| MarketCap: 26178.6 Millions | |
| Recent Price: 188.97 Smart Investing & Trading Score: 63 | |
| Day Percent Change: 0.01% Day Change: 0.02 | |
| Week Change: 0.61% Year-to-date Change: 14.6% | |
| RSG Links: Profile News Message Board | |
| Charts:- Daily , Weekly | |
| Add RSG to Watchlist: View: Get Complete RSG Trend Analysis ➞ | |
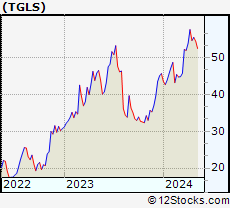 | TGLS Tecnoglass Inc. |
| Sector: Industrials | |
| SubSector: General Building Materials | |
| MarketCap: 135.853 Millions | |
| Recent Price: 56.54 Smart Investing & Trading Score: 63 | |
| Day Percent Change: -1.07% Day Change: -0.61 | |
| Week Change: -1.96% Year-to-date Change: 23.7% | |
| TGLS Links: Profile News Message Board | |
| Charts:- Daily , Weekly | |
| Add TGLS to Watchlist: View: Get Complete TGLS Trend Analysis ➞ | |
 | EAF GrafTech International Ltd. |
| Sector: Industrials | |
| SubSector: Diversified Machinery | |
| MarketCap: 2084.36 Millions | |
| Recent Price: 1.48 Smart Investing & Trading Score: 63 | |
| Day Percent Change: -0.67% Day Change: -0.01 | |
| Week Change: -17.78% Year-to-date Change: -32.4% | |
| EAF Links: Profile News Message Board | |
| Charts:- Daily , Weekly | |
| Add EAF to Watchlist: View: Get Complete EAF Trend Analysis ➞ | |
 | SMR NuScale Power Corporation |
| Sector: Industrials | |
| SubSector: Specialty Industrial Machinery | |
| MarketCap: 1510 Millions | |
| Recent Price: 4.99 Smart Investing & Trading Score: 61 | |
| Day Percent Change: 1.12% Day Change: 0.06 | |
| Week Change: -5.41% Year-to-date Change: 54.6% | |
| SMR Links: Profile News Message Board | |
| Charts:- Daily , Weekly | |
| Add SMR to Watchlist: View: Get Complete SMR Trend Analysis ➞ | |
 | PCT PureCycle Technologies, Inc. |
| Sector: Industrials | |
| SubSector: Pollution & Treatment Controls | |
| MarketCap: 1610 Millions | |
| Recent Price: 5.31 Smart Investing & Trading Score: 61 | |
| Day Percent Change: 3.51% Day Change: 0.18 | |
| Week Change: -6.35% Year-to-date Change: 31.0% | |
| PCT Links: Profile News Message Board | |
| Charts:- Daily , Weekly | |
| Add PCT to Watchlist: View: Get Complete PCT Trend Analysis ➞ | |
 | HI Hillenbrand, Inc. |
| Sector: Industrials | |
| SubSector: Diversified Machinery | |
| MarketCap: 1389.86 Millions | |
| Recent Price: 47.30 Smart Investing & Trading Score: 61 | |
| Day Percent Change: 1.20% Day Change: 0.56 | |
| Week Change: 0.98% Year-to-date Change: -1.2% | |
| HI Links: Profile News Message Board | |
| Charts:- Daily , Weekly | |
| Add HI to Watchlist: View: Get Complete HI Trend Analysis ➞ | |
 | WTTR Select Energy Services, Inc. |
| Sector: Industrials | |
| SubSector: Pollution & Treatment Controls | |
| MarketCap: 347.075 Millions | |
| Recent Price: 9.05 Smart Investing & Trading Score: 61 | |
| Day Percent Change: 0.78% Day Change: 0.07 | |
| Week Change: -1.63% Year-to-date Change: 19.2% | |
| WTTR Links: Profile News Message Board | |
| Charts:- Daily , Weekly | |
| Add WTTR to Watchlist: View: Get Complete WTTR Trend Analysis ➞ | |
 | ATI Allegheny Technologies Incorporated |
| Sector: Industrials | |
| SubSector: Metal Fabrication | |
| MarketCap: 913.35 Millions | |
| Recent Price: 51.10 Smart Investing & Trading Score: 61 | |
| Day Percent Change: 0.73% Day Change: 0.37 | |
| Week Change: -1.05% Year-to-date Change: 12.4% | |
| ATI Links: Profile News Message Board | |
| Charts:- Daily , Weekly | |
| Add ATI to Watchlist: View: Get Complete ATI Trend Analysis ➞ | |
 | AVAV AeroVironment, Inc. |
| Sector: Industrials | |
| SubSector: Aerospace/Defense Products & Services | |
| MarketCap: 1502.41 Millions | |
| Recent Price: 146.70 Smart Investing & Trading Score: 61 | |
| Day Percent Change: 0.05% Day Change: 0.08 | |
| Week Change: -0.29% Year-to-date Change: 16.4% | |
| AVAV Links: Profile News Message Board | |
| Charts:- Daily , Weekly | |
| Add AVAV to Watchlist: View: Get Complete AVAV Trend Analysis ➞ | |
 | EVTL Vertical Aerospace Ltd. |
| Sector: Industrials | |
| SubSector: Aerospace & Defense | |
| MarketCap: 403 Millions | |
| Recent Price: 0.75 Smart Investing & Trading Score: 61 | |
| Day Percent Change: -1.19% Day Change: -0.01 | |
| Week Change: -7.94% Year-to-date Change: 10.2% | |
| EVTL Links: Profile News Message Board | |
| Charts:- Daily , Weekly | |
| Add EVTL to Watchlist: View: Get Complete EVTL Trend Analysis ➞ | |
 | FIP FTAI Infrastructure Inc. |
| Sector: Industrials | |
| SubSector: Industrials | |
| MarketCap: 368 Millions | |
| Recent Price: 6.70 Smart Investing & Trading Score: 60 | |
| Day Percent Change: 2.37% Day Change: 0.16 | |
| Week Change: 4.12% Year-to-date Change: 72.1% | |
| FIP Links: Profile News Message Board | |
| Charts:- Daily , Weekly | |
| Add FIP to Watchlist: View: Get Complete FIP Trend Analysis ➞ | |
 | LLAP Terran Orbital Corporation |
| Sector: Industrials | |
| SubSector: Aerospace & Defense | |
| MarketCap: 206 Millions | |
| Recent Price: 1.35 Smart Investing & Trading Score: 59 | |
| Day Percent Change: -6.90% Day Change: -0.10 | |
| Week Change: -8.16% Year-to-date Change: 17.9% | |
| LLAP Links: Profile News Message Board | |
| Charts:- Daily , Weekly | |
| Add LLAP to Watchlist: View: Get Complete LLAP Trend Analysis ➞ | |
 | POWL Powell Industries, Inc. |
| Sector: Industrials | |
| SubSector: Diversified Machinery | |
| MarketCap: 257.216 Millions | |
| Recent Price: 128.14 Smart Investing & Trading Score: 58 | |
| Day Percent Change: 3.81% Day Change: 4.70 | |
| Week Change: 1.74% Year-to-date Change: 45.0% | |
| POWL Links: Profile News Message Board | |
| Charts:- Daily , Weekly | |
| Add POWL to Watchlist: View: Get Complete POWL Trend Analysis ➞ | |
| For tabular summary view of above stock list: Summary View ➞ 0 - 25 , 25 - 50 , 50 - 75 , 75 - 100 , 100 - 125 , 125 - 150 , 150 - 175 , 175 - 200 , 200 - 225 , 225 - 250 , 250 - 275 , 275 - 300 | ||
| Click To Change The Sort Order: By Market Cap or Company Size Performance: Year-to-date, Week and Day | |
| Select Chart Type: | ||
|
Best Stocks Today 12Stocks.com |
© 2024 12Stocks.com Terms & Conditions Privacy Contact Us
All Information Provided Only For Education And Not To Be Used For Investing or Trading. See Terms & Conditions


One More Thing ... Get Best Stocks Delivered Daily!
Never Ever Miss A Move With Our Top Ten Stocks Lists
Find Best Stocks In Any Market - Bull or Bear Market
Take A Peek At Our Top Ten Stocks Lists: Daily, Weekly, Year-to-Date & Top Trends
Find Best Stocks In Any Market - Bull or Bear Market
Take A Peek At Our Top Ten Stocks Lists: Daily, Weekly, Year-to-Date & Top Trends
Industrial Stocks With Best Up Trends [0-bearish to 100-bullish]: VCI Global[100], Argan [95], HEICO [95], Apogee Enterprises[93], Generac [93], Carpenter Technology[93], AAR [90], ADS-TEC Energy[90], Lockheed Martin[85], System1 [83], L.S. Starrett[83]
Best Industrial Stocks Year-to-Date:
Tritium DCFC[1502.54%], Intuitive Machines[111.93%], Kaman [92.03%], FTAI Infrastructure[72.11%], EMCOR [55.99%], Masonite [55.2%], NuScale Power[54.57%], ADS-TEC Energy[51.47%], TDCX [48.18%], Graham [47.5%], Tutor Perini[47.03%] Best Industrial Stocks This Week:
EHang [8.29%], Frontier [6.62%], MingZhu Logistics[6.5%], Sun Country[5.82%], NET Power[5.42%], Apogee Enterprises[5%], Mueller Water[4.75%], FTAI Infrastructure[4.12%], ADS-TEC Energy[3.85%], AAR [3.68%], TPI Composites[3.07%] Best Industrial Stocks Daily:
Montrose Environmental[12.84%], MingZhu Logistics[9.54%], Barnes [8.06%], Apogee Enterprises[7.01%], Amprius Technologies[6.07%], VCI Global[5.73%], EHang [5.66%], System1 [5.14%], BiomX [4.86%], Redwire [4.69%], Planet Labs[4.57%]