
 Login Sign Up


| |||||
 |  | ||||

| 12Stocks.com Market Intelligence |
Best Industrial Stocks
| In a hurry? Industrial Stocks Lists: Performance Trends Table, Stock Charts
Sort Industrial stocks: Daily, Weekly, Year-to-Date, Market Cap & Trends. Filter Industrial stocks list by size:All Industrial Large Mid-Range Small |
| 12Stocks.com Industrial Stocks Performances & Trends Daily | |||||||||
|
|  The overall Smart Investing & Trading Score is 56 (0-bearish to 100-bullish) which puts Industrial sector in short term neutral trend. The Smart Investing & Trading Score from previous trading session is 56 and hence a deterioration of trend.
| ||||||||
Here are the Smart Investing & Trading Scores of the most requested Industrial stocks at 12Stocks.com (click stock name for detailed review):
|


| 12Stocks.com: Investing in Industrial sector with Stocks | |
|
The following table helps investors and traders sort through current performance and trends (as measured by Smart Investing & Trading Score) of various
stocks in the Industrial sector. Quick View: Move mouse or cursor over stock symbol (ticker) to view short-term Technical chart and over stock name to view long term chart. Click on  to add stock symbol to your watchlist and to add stock symbol to your watchlist and  to view watchlist. Click on any ticker or stock name for detailed market intelligence report for that stock. to view watchlist. Click on any ticker or stock name for detailed market intelligence report for that stock. |
12Stocks.com Performance of Stocks in Industrial Sector
| Ticker | Stock Name | Watchlist | Category | Recent Price | Smart Investing & Trading Score | Change % | YTD Change% |
| TPC | Tutor Perini |   | Heavy Construction | 17.78 | 75 | 28.01 | 95.38% |
| TPIC | TPI Composites | | Machinery | 2.78 | 27 | 16.32 | -32.85% |
| ZIM | ZIM Integrated | | Marine Shipping | 13.22 | 74 | 16.07 | 36.78% |
| ENVX | Enovix | | Electrical Equipment & Parts | 6.47 | 42 | 10.79 | -48.61% |
| EOSE | Eos Energy | | Electrical Equipment & Parts | 0.78 | 22 | 10.38 | -28.32% |
| AMPX | Amprius Technologies | | Electrical Equipment & Parts | 1.74 | 27 | 8.07 | -65.27% |
| CRGO | Freightos | | Integrated Freight & Logistics | 2.84 | 74 | 7.79 | -19.57% |
| LNZA | LanzaTech Global | | Waste Mgmt | 2.23 | 0 | 7.49 | -55.01% |
| SFWL | Shengfeng Development | | Integrated Freight & Logistics | 1.65 | 17 | 7.14 | -40.00% |
| EVEX | Eve Holding | | Aerospace & Defense | 5.36 | 59 | 6.99 | -27.17% |
| HSHP | Himalaya Shipping | | Marine Shipping | 8.24 | 50 | 6.87 | 22.07% |
| MEG | Montrose Environmental | | Waste Mgmt | 43.01 | 68 | 6.21 | 33.72% |
| GRC | Gorman-Rupp | | Machinery | 33.38 | 56 | 6.14 | -6.05% |
| VCIG | VCI Global | | Consulting | 1.17 | 68 | 5.88 | -47.77% |
| MEC | Mayville Engineering | | Fabrication | 14.06 | 60 | 4.93 | -2.50% |
| JOBY | Joby Aviation | | Airports & Air | 5.35 | 64 | 4.90 | -19.43% |
| BLDP | Ballard Power | | Electrical Equipment | 2.59 | 27 | 4.86 | -30.00% |
| EVLV | Evolv Technologies | | Security & Protection | 4.12 | 60 | 4.57 | -12.71% |
| KRNT | Kornit Digital | | Machinery | 15.86 | 42 | 4.27 | -17.22% |
| CMPO | CompoSecure | | Fabrication | 6.97 | 68 | 4.19 | 27.42% |
| BLD | TopBuild | | Building Materials | 407.08 | 58 | 4.05 | 8.77% |
| PINS | | Conglomerates | 33.96 | 34 | 4.04 | -8.32% | |
| ERJ | Embraer S.A | | Aerospace/Defense | 25.99 | 90 | 3.96 | 40.87% |
| ATI | Allegheny Technologies | | Fabrication | 51.75 | 76 | 3.83 | 13.81% |
| STRL | Sterling Construction | | Heavy Construction | 105.84 | 58 | 3.56 | 20.37% |
| For chart view version of above stock list: Chart View ➞ 0 - 25 , 25 - 50 , 50 - 75 , 75 - 100 , 100 - 125 , 125 - 150 , 150 - 175 , 175 - 200 , 200 - 225 , 225 - 250 , 250 - 275 , 275 - 300 | ||
 | Click To Change The Sort Order: By Market Cap or Company Size Performance: Year-to-date, Week and Day |  |
|
Get the most comprehensive stock market coverage daily at 12Stocks.com ➞ Best Stocks Today ➞ Best Stocks Weekly ➞ Best Stocks Year-to-Date ➞ Best Stocks Trends ➞  Best Stocks Today 12Stocks.com Best Nasdaq Stocks ➞ Best S&P 500 Stocks ➞ Best Tech Stocks ➞ Best Biotech Stocks ➞ |
| Detailed Overview of Industrial Stocks |
| Industrial Technical Overview, Leaders & Laggards, Top Industrial ETF Funds & Detailed Industrial Stocks List, Charts, Trends & More |
| Industrial Sector: Technical Analysis, Trends & YTD Performance | |
| Industrial sector is composed of stocks
from industrial machinery, aerospace, defense, farm/construction
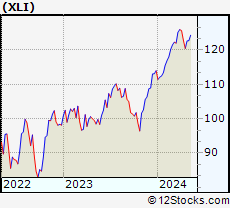
and industrial services subsectors. Industrial sector, as represented by XLI, an exchange-traded fund [ETF] that holds basket of Industrial stocks (e.g, Caterpillar, Boeing) is up by 7.61% and is currently outperforming the overall market by 1.47% year-to-date. Below is a quick view of Technical charts and trends: |
|
 XLI Weekly Chart |
|
| Long Term Trend: Very Good | |
| Medium Term Trend: Not Good | |
 XLI Daily Chart |
|
| Short Term Trend: Deteriorating | |
| Overall Trend Score: 56 | |
| YTD Performance: 7.61% | |
| **Trend Scores & Views Are Only For Educational Purposes And Not For Investing | |
| 12Stocks.com: Top Performing Industrial Sector Stocks | ||||||||||||||||||||||||||||||||||||||||||||||||
 The top performing Industrial sector stocks year to date are
Now, more recently, over last week, the top performing Industrial sector stocks on the move are


|
||||||||||||||||||||||||||||||||||||||||||||||||
| 12Stocks.com: Investing in Industrial Sector using Exchange Traded Funds | |
|
The following table shows list of key exchange traded funds (ETF) that
help investors track Industrial Index. For detailed view, check out our ETF Funds section of our website. Quick View: Move mouse or cursor over ETF symbol (ticker) to view short-term Technical chart and over ETF name to view long term chart. Click on ticker or stock name for detailed view. Click on to add stock symbol to your watchlist and to view watchlist. |
12Stocks.com List of ETFs that track Industrial Index
| Ticker | ETF Name | Watchlist | Recent Price | Smart Investing & Trading Score | Change % | Week % | Year-to-date % |
| XLI | Industrial | | 122.66 | 56 | 0.16 | 1.82 | 7.61% |
| UXI | Industrials | | 32.55 | 53 | 2.97 | 3.17 | 13.04% |
| PPA | Aerospace & Defense | | 100.91 | 83 | 0.56 | 2.64 | 9.49% |
| ITA | Aerospace & Defense | | 129.53 | 63 | 0.40 | 1.2 | 2.31% |
| ITB | Home Construction | | 105.65 | 51 | 1.19 | 3.21 | 3.85% |
| XHB | Homebuilders | | 103.72 | 51 | 1.22 | 3.55 | 8.43% |
| SIJ | Short Industrials | | 9.82 | 32 | -1.01 | -4.04 | -13.4% |
| IYJ | Industrials | | 121.66 | 48 | 0.30 | 1.88 | 6.38% |
| EXI | Global Industrials | | 136.13 | 48 | 0.96 | 2.33 | 6.82% |
| VIS | Industrials | | 236.50 | 63 | 0.12 | 1.85 | 7.29% |
| PSCI | SmallCap Industrials | | 120.84 | 56 | -0.18 | 1.68 | 4.21% |
| XAR | Aerospace & Defense | | 136.11 | 65 | 1.12 | 2.93 | 0.51% |
| ARKQ | ARK Industrial Innovation | | 53.36 | 24 | 2.52 | 7.02 | -7.52% |
| 12Stocks.com: Charts, Trends, Fundamental Data and Performances of Industrial Stocks | |
|
We now take in-depth look at all Industrial stocks including charts, multi-period performances and overall trends (as measured by Smart Investing & Trading Score). One can sort Industrial stocks (click link to choose) by Daily, Weekly and by Year-to-Date performances. Also, one can sort by size of the company or by market capitalization. |
| Select Your Default Chart Type: | |||||
| |||||
| Click on stock symbol or name for detailed view. Click on to add stock symbol to your watchlist and to view watchlist. Quick View: Move mouse or cursor over "Daily" to quickly view daily Technical stock chart and over "Weekly" to view weekly Technical stock chart. | |||||

 | TPC Tutor Perini Corporation |
| Sector: Industrials | |
| SubSector: Heavy Construction | |
| MarketCap: 382.595 Millions | |
| Recent Price: 17.78 Smart Investing & Trading Score: 75 | |
| Day Percent Change: 28.01% Day Change: 3.89 | |
| Week Change: 33.89% Year-to-date Change: 95.4% | |
| TPC Links: Profile News Message Board | |
| Charts:- Daily , Weekly | |
| Add TPC to Watchlist: View: Get Complete TPC Trend Analysis ➞ | |
 | TPIC TPI Composites, Inc. |
| Sector: Industrials | |
| SubSector: Diversified Machinery | |
| MarketCap: 451.016 Millions | |
| Recent Price: 2.78 Smart Investing & Trading Score: 27 | |
| Day Percent Change: 16.32% Day Change: 0.39 | |
| Week Change: 3.73% Year-to-date Change: -32.9% | |
| TPIC Links: Profile News Message Board | |
| Charts:- Daily , Weekly | |
| Add TPIC to Watchlist: View: Get Complete TPIC Trend Analysis ➞ | |
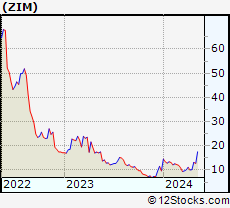 | ZIM ZIM Integrated Shipping Services Ltd. |
| Sector: Industrials | |
| SubSector: Marine Shipping | |
| MarketCap: 1500 Millions | |
| Recent Price: 13.22 Smart Investing & Trading Score: 74 | |
| Day Percent Change: 16.07% Day Change: 1.83 | |
| Week Change: 29.99% Year-to-date Change: 36.8% | |
| ZIM Links: Profile News Message Board | |
| Charts:- Daily , Weekly | |
| Add ZIM to Watchlist: View: Get Complete ZIM Trend Analysis ➞ | |
 | ENVX Enovix Corporation |
| Sector: Industrials | |
| SubSector: Electrical Equipment & Parts | |
| MarketCap: 2740 Millions | |
| Recent Price: 6.47 Smart Investing & Trading Score: 42 | |
| Day Percent Change: 10.79% Day Change: 0.63 | |
| Week Change: 3.35% Year-to-date Change: -48.6% | |
| ENVX Links: Profile News Message Board | |
| Charts:- Daily , Weekly | |
| Add ENVX to Watchlist: View: Get Complete ENVX Trend Analysis ➞ | |
 | EOSE Eos Energy Enterprises, Inc. |
| Sector: Industrials | |
| SubSector: Electrical Equipment & Parts | |
| MarketCap: 76627 Millions | |
| Recent Price: 0.78 Smart Investing & Trading Score: 22 | |
| Day Percent Change: 10.38% Day Change: 0.07 | |
| Week Change: 1.12% Year-to-date Change: -28.3% | |
| EOSE Links: Profile News Message Board | |
| Charts:- Daily , Weekly | |
| Add EOSE to Watchlist: View: Get Complete EOSE Trend Analysis ➞ | |
 | AMPX Amprius Technologies, Inc. |
| Sector: Industrials | |
| SubSector: Electrical Equipment & Parts | |
| MarketCap: 608 Millions | |
| Recent Price: 1.74 Smart Investing & Trading Score: 27 | |
| Day Percent Change: 8.07% Day Change: 0.13 | |
| Week Change: -1.14% Year-to-date Change: -65.3% | |
| AMPX Links: Profile News Message Board | |
| Charts:- Daily , Weekly | |
| Add AMPX to Watchlist: View: Get Complete AMPX Trend Analysis ➞ | |
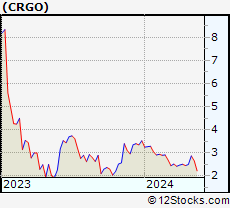 | CRGO Freightos Limited |
| Sector: Industrials | |
| SubSector: Integrated Freight & Logistics | |
| MarketCap: 149 Millions | |
| Recent Price: 2.84 Smart Investing & Trading Score: 74 | |
| Day Percent Change: 7.79% Day Change: 0.21 | |
| Week Change: 13.4% Year-to-date Change: -19.6% | |
| CRGO Links: Profile News Message Board | |
| Charts:- Daily , Weekly | |
| Add CRGO to Watchlist: View: Get Complete CRGO Trend Analysis ➞ | |
 | LNZA LanzaTech Global, Inc. |
| Sector: Industrials | |
| SubSector: Waste Management | |
| MarketCap: 1340 Millions | |
| Recent Price: 2.23 Smart Investing & Trading Score: 0 | |
| Day Percent Change: 7.49% Day Change: 0.16 | |
| Week Change: -22.2% Year-to-date Change: -55.0% | |
| LNZA Links: Profile News Message Board | |
| Charts:- Daily , Weekly | |
| Add LNZA to Watchlist: View: Get Complete LNZA Trend Analysis ➞ | |
 | SFWL Shengfeng Development Limited |
| Sector: Industrials | |
| SubSector: Integrated Freight & Logistics | |
| MarketCap: 747 Millions | |
| Recent Price: 1.65 Smart Investing & Trading Score: 17 | |
| Day Percent Change: 7.14% Day Change: 0.11 | |
| Week Change: 1.23% Year-to-date Change: -40.0% | |
| SFWL Links: Profile News Message Board | |
| Charts:- Daily , Weekly | |
| Add SFWL to Watchlist: View: Get Complete SFWL Trend Analysis ➞ | |
 | EVEX Eve Holding, Inc. |
| Sector: Industrials | |
| SubSector: Aerospace & Defense | |
| MarketCap: 2830 Millions | |
| Recent Price: 5.36 Smart Investing & Trading Score: 59 | |
| Day Percent Change: 6.99% Day Change: 0.35 | |
| Week Change: 1.13% Year-to-date Change: -27.2% | |
| EVEX Links: Profile News Message Board | |
| Charts:- Daily , Weekly | |
| Add EVEX to Watchlist: View: Get Complete EVEX Trend Analysis ➞ | |
 | HSHP Himalaya Shipping Ltd. |
| Sector: Industrials | |
| SubSector: Marine Shipping | |
| MarketCap: 179 Millions | |
| Recent Price: 8.24 Smart Investing & Trading Score: 50 | |
| Day Percent Change: 6.87% Day Change: 0.53 | |
| Week Change: 2.23% Year-to-date Change: 22.1% | |
| HSHP Links: Profile News Message Board | |
| Charts:- Daily , Weekly | |
| Add HSHP to Watchlist: View: Get Complete HSHP Trend Analysis ➞ | |
 | MEG Montrose Environmental Group, Inc. |
| Sector: Industrials | |
| SubSector: Waste Management | |
| MarketCap: 71627 Millions | |
| Recent Price: 43.01 Smart Investing & Trading Score: 68 | |
| Day Percent Change: 6.21% Day Change: 2.52 | |
| Week Change: 6.5% Year-to-date Change: 33.7% | |
| MEG Links: Profile News Message Board | |
| Charts:- Daily , Weekly | |
| Add MEG to Watchlist: View: Get Complete MEG Trend Analysis ➞ | |
 | GRC The Gorman-Rupp Company |
| Sector: Industrials | |
| SubSector: Diversified Machinery | |
| MarketCap: 729.616 Millions | |
| Recent Price: 33.38 Smart Investing & Trading Score: 56 | |
| Day Percent Change: 6.14% Day Change: 1.93 | |
| Week Change: -7.33% Year-to-date Change: -6.1% | |
| GRC Links: Profile News Message Board | |
| Charts:- Daily , Weekly | |
| Add GRC to Watchlist: View: Get Complete GRC Trend Analysis ➞ | |
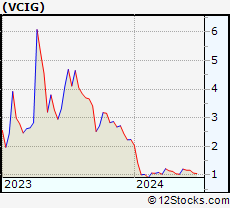 | VCIG VCI Global Limited |
| Sector: Industrials | |
| SubSector: Consulting Services | |
| MarketCap: 197 Millions | |
| Recent Price: 1.17 Smart Investing & Trading Score: 68 | |
| Day Percent Change: 5.88% Day Change: 0.06 | |
| Week Change: 0% Year-to-date Change: -47.8% | |
| VCIG Links: Profile News Message Board | |
| Charts:- Daily , Weekly | |
| Add VCIG to Watchlist: View: Get Complete VCIG Trend Analysis ➞ | |
 | MEC Mayville Engineering Company, Inc. |
| Sector: Industrials | |
| SubSector: Metal Fabrication | |
| MarketCap: 143.55 Millions | |
| Recent Price: 14.06 Smart Investing & Trading Score: 60 | |
| Day Percent Change: 4.93% Day Change: 0.66 | |
| Week Change: 1.3% Year-to-date Change: -2.5% | |
| MEC Links: Profile News Message Board | |
| Charts:- Daily , Weekly | |
| Add MEC to Watchlist: View: Get Complete MEC Trend Analysis ➞ | |
 | JOBY Joby Aviation, Inc. |
| Sector: Industrials | |
| SubSector: Airports & Air Services | |
| MarketCap: 5810 Millions | |
| Recent Price: 5.35 Smart Investing & Trading Score: 64 | |
| Day Percent Change: 4.90% Day Change: 0.25 | |
| Week Change: 17.84% Year-to-date Change: -19.4% | |
| JOBY Links: Profile News Message Board | |
| Charts:- Daily , Weekly | |
| Add JOBY to Watchlist: View: Get Complete JOBY Trend Analysis ➞ | |
 | BLDP Ballard Power Systems Inc. |
| Sector: Industrials | |
| SubSector: Industrial Electrical Equipment | |
| MarketCap: 2124.79 Millions | |
| Recent Price: 2.59 Smart Investing & Trading Score: 27 | |
| Day Percent Change: 4.86% Day Change: 0.12 | |
| Week Change: -1.52% Year-to-date Change: -30.0% | |
| BLDP Links: Profile News Message Board | |
| Charts:- Daily , Weekly | |
| Add BLDP to Watchlist: View: Get Complete BLDP Trend Analysis ➞ | |
 | EVLV Evolv Technologies Holdings, Inc. |
| Sector: Industrials | |
| SubSector: Security & Protection Services | |
| MarketCap: 853 Millions | |
| Recent Price: 4.12 Smart Investing & Trading Score: 60 | |
| Day Percent Change: 4.57% Day Change: 0.18 | |
| Week Change: 7.57% Year-to-date Change: -12.7% | |
| EVLV Links: Profile News Message Board | |
| Charts:- Daily , Weekly | |
| Add EVLV to Watchlist: View: Get Complete EVLV Trend Analysis ➞ | |
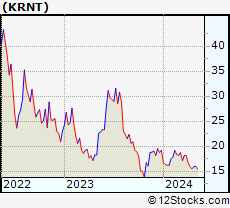 | KRNT Kornit Digital Ltd. |
| Sector: Industrials | |
| SubSector: Diversified Machinery | |
| MarketCap: 1101.86 Millions | |
| Recent Price: 15.86 Smart Investing & Trading Score: 42 | |
| Day Percent Change: 4.27% Day Change: 0.65 | |
| Week Change: 2.45% Year-to-date Change: -17.2% | |
| KRNT Links: Profile News Message Board | |
| Charts:- Daily , Weekly | |
| Add KRNT to Watchlist: View: Get Complete KRNT Trend Analysis ➞ | |
 | CMPO CompoSecure, Inc. |
| Sector: Industrials | |
| SubSector: Metal Fabrication | |
| MarketCap: 535 Millions | |
| Recent Price: 6.97 Smart Investing & Trading Score: 68 | |
| Day Percent Change: 4.19% Day Change: 0.28 | |
| Week Change: 6.74% Year-to-date Change: 27.4% | |
| CMPO Links: Profile News Message Board | |
| Charts:- Daily , Weekly | |
| Add CMPO to Watchlist: View: Get Complete CMPO Trend Analysis ➞ | |
 | BLD TopBuild Corp. |
| Sector: Industrials | |
| SubSector: General Building Materials | |
| MarketCap: 2534.53 Millions | |
| Recent Price: 407.08 Smart Investing & Trading Score: 58 | |
| Day Percent Change: 4.05% Day Change: 15.83 | |
| Week Change: 5.92% Year-to-date Change: 8.8% | |
| BLD Links: Profile News Message Board | |
| Charts:- Daily , Weekly | |
| Add BLD to Watchlist: View: Get Complete BLD Trend Analysis ➞ | |
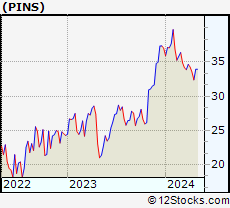 | PINS Pinterest, Inc. |
| Sector: Industrials | |
| SubSector: Conglomerates | |
| MarketCap: 8115.78 Millions | |
| Recent Price: 33.96 Smart Investing & Trading Score: 34 | |
| Day Percent Change: 4.04% Day Change: 1.32 | |
| Week Change: 4.81% Year-to-date Change: -8.3% | |
| PINS Links: Profile News Message Board | |
| Charts:- Daily , Weekly | |
| Add PINS to Watchlist: View: Get Complete PINS Trend Analysis ➞ | |
 | ERJ Embraer S.A. |
| Sector: Industrials | |
| SubSector: Aerospace/Defense Products & Services | |
| MarketCap: 1623.71 Millions | |
| Recent Price: 25.99 Smart Investing & Trading Score: 90 | |
| Day Percent Change: 3.96% Day Change: 0.99 | |
| Week Change: 9.25% Year-to-date Change: 40.9% | |
| ERJ Links: Profile News Message Board | |
| Charts:- Daily , Weekly | |
| Add ERJ to Watchlist: View: Get Complete ERJ Trend Analysis ➞ | |
 | ATI Allegheny Technologies Incorporated |
| Sector: Industrials | |
| SubSector: Metal Fabrication | |
| MarketCap: 913.35 Millions | |
| Recent Price: 51.75 Smart Investing & Trading Score: 76 | |
| Day Percent Change: 3.83% Day Change: 1.91 | |
| Week Change: 2.35% Year-to-date Change: 13.8% | |
| ATI Links: Profile News Message Board | |
| Charts:- Daily , Weekly | |
| Add ATI to Watchlist: View: Get Complete ATI Trend Analysis ➞ | |
 | STRL Sterling Construction Company, Inc. |
| Sector: Industrials | |
| SubSector: Heavy Construction | |
| MarketCap: 237.395 Millions | |
| Recent Price: 105.84 Smart Investing & Trading Score: 58 | |
| Day Percent Change: 3.56% Day Change: 3.64 | |
| Week Change: 9.61% Year-to-date Change: 20.4% | |
| STRL Links: Profile News Message Board | |
| Charts:- Daily , Weekly | |
| Add STRL to Watchlist: View: Get Complete STRL Trend Analysis ➞ | |
| For tabular summary view of above stock list: Summary View ➞ 0 - 25 , 25 - 50 , 50 - 75 , 75 - 100 , 100 - 125 , 125 - 150 , 150 - 175 , 175 - 200 , 200 - 225 , 225 - 250 , 250 - 275 , 275 - 300 | ||
| Click To Change The Sort Order: By Market Cap or Company Size Performance: Year-to-date, Week and Day | |
| Select Chart Type: | ||
|
Best Stocks Today 12Stocks.com |
© 2024 12Stocks.com Terms & Conditions Privacy Contact Us
All Information Provided Only For Education And Not To Be Used For Investing or Trading. See Terms & Conditions


One More Thing ... Get Best Stocks Delivered Daily!
Never Ever Miss A Move With Our Top Ten Stocks Lists
Find Best Stocks In Any Market - Bull or Bear Market
Take A Peek At Our Top Ten Stocks Lists: Daily, Weekly, Year-to-Date & Top Trends
Find Best Stocks In Any Market - Bull or Bear Market
Take A Peek At Our Top Ten Stocks Lists: Daily, Weekly, Year-to-Date & Top Trends
Industrial Stocks With Best Up Trends [0-bearish to 100-bullish]: Carrier Global[100], Carpenter Technology[100], Kanzhun [100], AeroVironment [100], AAR [100], Generac [100], Dover [100], Crane Co[100], HEICO [100], NET Power[95], Powell Industries[95]
Best Industrial Stocks Year-to-Date:
Intuitive Machines[124.28%], Tutor Perini[95.38%], NuScale Power[87.91%], FTAI Infrastructure[85.99%], Powell Industries[68.33%], IES [65.12%], Caesarstone [65.11%], EMCOR [64.33%], Masonite [55.46%], ADS-TEC Energy[52.66%], Graham [49.5%] Best Industrial Stocks This Week:
Tutor Perini[33.89%], ZIM Integrated[29.99%], NuScale Power[24.95%], Joby Aviation[17.84%], BiomX [17.81%], JELD-WEN Holding[17%], Powell Industries[14.16%], Freightos [13.4%], IES [13.24%], Kanzhun [12.67%], Meritage Homes[12.66%] Best Industrial Stocks Daily:
Tutor Perini[28.01%], TPI Composites[16.32%], ZIM Integrated[16.07%], Enovix [10.79%], Eos Energy[10.38%], Amprius Technologies[8.07%], Freightos [7.79%], LanzaTech Global[7.49%], Shengfeng Development[7.14%], Eve Holding[6.99%], Himalaya Shipping[6.87%]