
 Login Sign Up


| |||||
 |  | ||||

| 12Stocks.com Market Intelligence |
Best Industrial Stocks
| In a hurry? Industrial Stocks Lists: Performance Trends Table, Stock Charts
Sort Industrial stocks: Daily, Weekly, Year-to-Date, Market Cap & Trends. Filter Industrial stocks list by size:All Industrial Large Mid-Range Small |
| 12Stocks.com Industrial Stocks Performances & Trends Daily | |||||||||
|
|  The overall Smart Investing & Trading Score is 20 (0-bearish to 100-bullish) which puts Industrial sector in short term bearish trend. The Smart Investing & Trading Score from previous trading session is 38 and hence a deterioration of trend.
| ||||||||
Here are the Smart Investing & Trading Scores of the most requested Industrial stocks at 12Stocks.com (click stock name for detailed review):
|


| 12Stocks.com: Investing in Industrial sector with Stocks | |
|
The following table helps investors and traders sort through current performance and trends (as measured by Smart Investing & Trading Score) of various
stocks in the Industrial sector. Quick View: Move mouse or cursor over stock symbol (ticker) to view short-term Technical chart and over stock name to view long term chart. Click on  to add stock symbol to your watchlist and to add stock symbol to your watchlist and  to view watchlist. Click on any ticker or stock name for detailed market intelligence report for that stock. to view watchlist. Click on any ticker or stock name for detailed market intelligence report for that stock. |
12Stocks.com Performance of Stocks in Industrial Sector
| Ticker | Stock Name | Watchlist | Category | Recent Price | Smart Investing & Trading Score | Change % | YTD Change% |
| SYM | Symbotic |   | Specialty Industrial Machinery | 38.58 | 17 | -0.03% | -24.19% |
| WTS | Watts Water | | Equipment | 199.95 | 15 | 0.75% | -4.03% |
| FIX | Comfort Systems | | Contractors | 301.94 | 15 | -2.41% | 46.81% |
| CVCO | Cavco Industries | | Residential | 365.00 | 14 | 0.22% | 5.30% |
| EMR | Emerson Electric | | Electrical Equipment | 106.45 | 13 | -1.23% | 9.37% |
| GLDD | Great Lakes | | Heavy Construction | 6.84 | 10 | 3.64% | -10.94% |
| TWI | Titan | | Machinery | 11.17 | 10 | 1.36% | -24.93% |
| OFLX | Omega Flex | | Equipment | 67.08 | 10 | 1.24% | -4.86% |
| TS | Tenaris S.A | | Fabrication | 33.24 | 10 | 0.76% | -4.37% |
| LEN | Lennar | | Residential | 152.47 | 10 | 0.56% | 2.30% |
| RXO | RXO | | Trucking | 19.00 | 10 | 0.48% | -18.70% |
| RYN | Rayonier | | Lumber, Wood | 29.79 | 10 | 0.44% | -10.84% |
| SKY | Skyline Champion | | Manufactured Housing | 75.24 | 10 | 0.33% | 1.32% |
| OTIS | Otis Worldwide | | Specialty Industrial Machinery | 91.43 | 10 | 0.25% | 2.19% |
| TXT | Textron | | Aerospace/Defense | 84.77 | 10 | 0.21% | 5.41% |
| MAS | Masco | | Building Materials | 68.58 | 10 | 0.19% | 2.39% |
| GGG | Graco | | Machinery | 80.32 | 10 | 0.15% | -7.42% |
| WY | Weyerhaeuser | | Lumber, Wood | 30.20 | 10 | 0.10% | -13.14% |
| ULCC | Frontier | | Airlines | 5.84 | 10 | -3.23% | 7.55% |
| JBT | John Bean | | Machinery | 88.84 | 10 | -0.28% | -10.67% |
| ALG | Alamo | | Machinery | 193.93 | 10 | -0.23% | -7.74% |
| BCC | Boise Cascade | | Lumber, Wood | 132.01 | 10 | -0.20% | 2.05% |
| SNA | Snap-on | | Small Tools & Accessories | 267.74 | 10 | -0.08% | -7.31% |
| DHI | D.R. Horton | | Residential | 142.48 | 10 | -0.01% | -6.25% |
| KMT | Kennametal | | Machine Tools | 23.70 | 8 | 0.72% | -8.10% |
| For chart view version of above stock list: Chart View ➞ 0 - 25 , 25 - 50 , 50 - 75 , 75 - 100 , 100 - 125 , 125 - 150 , 150 - 175 , 175 - 200 , 200 - 225 , 225 - 250 , 250 - 275 , 275 - 300 | ||
 | Click To Change The Sort Order: By Market Cap or Company Size Performance: Year-to-date, Week and Day |  |
|
Get the most comprehensive stock market coverage daily at 12Stocks.com ➞ Best Stocks Today ➞ Best Stocks Weekly ➞ Best Stocks Year-to-Date ➞ Best Stocks Trends ➞  Best Stocks Today 12Stocks.com Best Nasdaq Stocks ➞ Best S&P 500 Stocks ➞ Best Tech Stocks ➞ Best Biotech Stocks ➞ |
| Detailed Overview of Industrial Stocks |
| Industrial Technical Overview, Leaders & Laggards, Top Industrial ETF Funds & Detailed Industrial Stocks List, Charts, Trends & More |
| Industrial Sector: Technical Analysis, Trends & YTD Performance | |
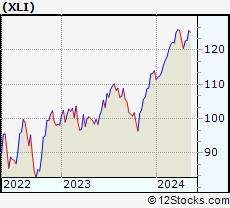
| Industrial sector is composed of stocks
from industrial machinery, aerospace, defense, farm/construction
and industrial services subsectors. Industrial sector, as represented by XLI, an exchange-traded fund [ETF] that holds basket of Industrial stocks (e.g, Caterpillar, Boeing) is up by 6.34% and is currently outperforming the overall market by 1.8% year-to-date. Below is a quick view of Technical charts and trends: |
|
 XLI Weekly Chart |
|
| Long Term Trend: Good | |
| Medium Term Trend: Not Good | |
 XLI Daily Chart |
|
| Short Term Trend: Not Good | |
| Overall Trend Score: 20 | |
| YTD Performance: 6.34% | |
| **Trend Scores & Views Are Only For Educational Purposes And Not For Investing | |
| 12Stocks.com: Top Performing Industrial Sector Stocks | ||||||||||||||||||||||||||||||||||||||||||||||||
 The top performing Industrial sector stocks year to date are
Now, more recently, over last week, the top performing Industrial sector stocks on the move are


|
||||||||||||||||||||||||||||||||||||||||||||||||
| 12Stocks.com: Investing in Industrial Sector using Exchange Traded Funds | |
|
The following table shows list of key exchange traded funds (ETF) that
help investors track Industrial Index. For detailed view, check out our ETF Funds section of our website. Quick View: Move mouse or cursor over ETF symbol (ticker) to view short-term Technical chart and over ETF name to view long term chart. Click on ticker or stock name for detailed view. Click on to add stock symbol to your watchlist and to view watchlist. |
12Stocks.com List of ETFs that track Industrial Index
| Ticker | ETF Name | Watchlist | Recent Price | Smart Investing & Trading Score | Change % | Week % | Year-to-date % |
| XLI | Industrial | | 121.22 | 20 | -0.25 | -1.17 | 6.34% |
| UXI | Industrials | | 31.89 | 30 | -1.15 | -2.57 | 10.75% |
| PPA | Aerospace & Defense | | 101.17 | 66 | -0.06 | 0.26 | 9.78% |
| ITA | Aerospace & Defense | | 130.11 | 66 | 0.20 | 0.45 | 2.77% |
| ITB | Home Construction | | 104.07 | 10 | 0.21 | -1.5 | 2.3% |
| XHB | Homebuilders | | 102.19 | 7 | -0.41 | -1.48 | 6.83% |
| SIJ | Short Industrials | | 10.11 | 57 | 1.04 | 3 | -10.81% |
| IYJ | Industrials | | 119.51 | 7 | -0.54 | -1.69 | 4.5% |
| EXI | Global Industrials | | 134.90 | 17 | 0.04 | -0.87 | 5.86% |
| VIS | Industrials | | 233.21 | 20 | -0.36 | -1.39 | 5.8% |
| PSCI | SmallCap Industrials | | 118.80 | 0 | -0.40 | -2.11 | 2.45% |
| XAR | Aerospace & Defense | | 136.87 | 63 | 0.62 | 0.56 | 1.07% |
| ARKQ | ARK Industrial Innovation | | 53.16 | 45 | -0.28 | -0.37 | -7.87% |
| 12Stocks.com: Charts, Trends, Fundamental Data and Performances of Industrial Stocks | |
|
We now take in-depth look at all Industrial stocks including charts, multi-period performances and overall trends (as measured by Smart Investing & Trading Score). One can sort Industrial stocks (click link to choose) by Daily, Weekly and by Year-to-Date performances. Also, one can sort by size of the company or by market capitalization. |
| Select Your Default Chart Type: | |||||
| |||||
| Click on stock symbol or name for detailed view. Click on to add stock symbol to your watchlist and to view watchlist. Quick View: Move mouse or cursor over "Daily" to quickly view daily Technical stock chart and over "Weekly" to view weekly Technical stock chart. | |||||

 | SYM Symbotic Inc. |
| Sector: Industrials | |
| SubSector: Specialty Industrial Machinery | |
| MarketCap: 24000 Millions | |
| Recent Price: 38.58 Smart Investing & Trading Score: 17 | |
| Day Percent Change: -0.03% Day Change: -0.01 | |
| Week Change: -3.98% Year-to-date Change: -24.2% | |
| SYM Links: Profile News Message Board | |
| Charts:- Daily , Weekly | |
| Add SYM to Watchlist: View: Get Complete SYM Trend Analysis ➞ | |
 | WTS Watts Water Technologies, Inc. |
| Sector: Industrials | |
| SubSector: Industrial Equipment & Components | |
| MarketCap: 2903.29 Millions | |
| Recent Price: 199.95 Smart Investing & Trading Score: 15 | |
| Day Percent Change: 0.75% Day Change: 1.49 | |
| Week Change: -0.77% Year-to-date Change: -4.0% | |
| WTS Links: Profile News Message Board | |
| Charts:- Daily , Weekly | |
| Add WTS to Watchlist: View: Get Complete WTS Trend Analysis ➞ | |
 | FIX Comfort Systems USA, Inc. |
| Sector: Industrials | |
| SubSector: General Contractors | |
| MarketCap: 1440.63 Millions | |
| Recent Price: 301.94 Smart Investing & Trading Score: 15 | |
| Day Percent Change: -2.41% Day Change: -7.47 | |
| Week Change: -0.02% Year-to-date Change: 46.8% | |
| FIX Links: Profile News Message Board | |
| Charts:- Daily , Weekly | |
| Add FIX to Watchlist: View: Get Complete FIX Trend Analysis ➞ | |
 | CVCO Cavco Industries, Inc. |
| Sector: Industrials | |
| SubSector: Residential Construction | |
| MarketCap: 1375.86 Millions | |
| Recent Price: 365.00 Smart Investing & Trading Score: 14 | |
| Day Percent Change: 0.22% Day Change: 0.79 | |
| Week Change: -2.04% Year-to-date Change: 5.3% | |
| CVCO Links: Profile News Message Board | |
| Charts:- Daily , Weekly | |
| Add CVCO to Watchlist: View: Get Complete CVCO Trend Analysis ➞ | |
 | EMR Emerson Electric Co. |
| Sector: Industrials | |
| SubSector: Industrial Electrical Equipment | |
| MarketCap: 30457.9 Millions | |
| Recent Price: 106.45 Smart Investing & Trading Score: 13 | |
| Day Percent Change: -1.23% Day Change: -1.33 | |
| Week Change: -3.13% Year-to-date Change: 9.4% | |
| EMR Links: Profile News Message Board | |
| Charts:- Daily , Weekly | |
| Add EMR to Watchlist: View: Get Complete EMR Trend Analysis ➞ | |
 | GLDD Great Lakes Dredge & Dock Corporation |
| Sector: Industrials | |
| SubSector: Heavy Construction | |
| MarketCap: 619.095 Millions | |
| Recent Price: 6.84 Smart Investing & Trading Score: 10 | |
| Day Percent Change: 3.64% Day Change: 0.24 | |
| Week Change: -4.2% Year-to-date Change: -10.9% | |
| GLDD Links: Profile News Message Board | |
| Charts:- Daily , Weekly | |
| Add GLDD to Watchlist: View: Get Complete GLDD Trend Analysis ➞ | |
 | TWI Titan International, Inc. |
| Sector: Industrials | |
| SubSector: Farm & Construction Machinery | |
| MarketCap: 104.607 Millions | |
| Recent Price: 11.17 Smart Investing & Trading Score: 10 | |
| Day Percent Change: 1.36% Day Change: 0.15 | |
| Week Change: -3.29% Year-to-date Change: -24.9% | |
| TWI Links: Profile News Message Board | |
| Charts:- Daily , Weekly | |
| Add TWI to Watchlist: View: Get Complete TWI Trend Analysis ➞ | |
 | OFLX Omega Flex, Inc. |
| Sector: Industrials | |
| SubSector: Industrial Equipment & Components | |
| MarketCap: 590.609 Millions | |
| Recent Price: 67.08 Smart Investing & Trading Score: 10 | |
| Day Percent Change: 1.24% Day Change: 0.82 | |
| Week Change: 0.34% Year-to-date Change: -4.9% | |
| OFLX Links: Profile News Message Board | |
| Charts:- Daily , Weekly | |
| Add OFLX to Watchlist: View: Get Complete OFLX Trend Analysis ➞ | |
 | TS Tenaris S.A. |
| Sector: Industrials | |
| SubSector: Metal Fabrication | |
| MarketCap: 7426.8 Millions | |
| Recent Price: 33.24 Smart Investing & Trading Score: 10 | |
| Day Percent Change: 0.76% Day Change: 0.25 | |
| Week Change: -3.96% Year-to-date Change: -4.4% | |
| TS Links: Profile News Message Board | |
| Charts:- Daily , Weekly | |
| Add TS to Watchlist: View: Get Complete TS Trend Analysis ➞ | |
 | LEN Lennar Corporation |
| Sector: Industrials | |
| SubSector: Residential Construction | |
| MarketCap: 11926.6 Millions | |
| Recent Price: 152.47 Smart Investing & Trading Score: 10 | |
| Day Percent Change: 0.56% Day Change: 0.85 | |
| Week Change: -1.18% Year-to-date Change: 2.3% | |
| LEN Links: Profile News Message Board | |
| Charts:- Daily , Weekly | |
| Add LEN to Watchlist: View: Get Complete LEN Trend Analysis ➞ | |
 | RXO RXO, Inc. |
| Sector: Industrials | |
| SubSector: Trucking | |
| MarketCap: 2550 Millions | |
| Recent Price: 19.00 Smart Investing & Trading Score: 10 | |
| Day Percent Change: 0.48% Day Change: 0.09 | |
| Week Change: -1.86% Year-to-date Change: -18.7% | |
| RXO Links: Profile News Message Board | |
| Charts:- Daily , Weekly | |
| Add RXO to Watchlist: View: Get Complete RXO Trend Analysis ➞ | |
 | RYN Rayonier Inc. |
| Sector: Industrials | |
| SubSector: Lumber, Wood Production | |
| MarketCap: 3143 Millions | |
| Recent Price: 29.79 Smart Investing & Trading Score: 10 | |
| Day Percent Change: 0.44% Day Change: 0.13 | |
| Week Change: -1.23% Year-to-date Change: -10.8% | |
| RYN Links: Profile News Message Board | |
| Charts:- Daily , Weekly | |
| Add RYN to Watchlist: View: Get Complete RYN Trend Analysis ➞ | |
 | SKY Skyline Champion Corporation |
| Sector: Industrials | |
| SubSector: Manufactured Housing | |
| MarketCap: 915.145 Millions | |
| Recent Price: 75.24 Smart Investing & Trading Score: 10 | |
| Day Percent Change: 0.33% Day Change: 0.25 | |
| Week Change: -1.45% Year-to-date Change: 1.3% | |
| SKY Links: Profile News Message Board | |
| Charts:- Daily , Weekly | |
| Add SKY to Watchlist: View: Get Complete SKY Trend Analysis ➞ | |
 | OTIS Otis Worldwide Corporation |
| Sector: Industrials | |
| SubSector: Specialty Industrial Machinery | |
| MarketCap: 27727 Millions | |
| Recent Price: 91.43 Smart Investing & Trading Score: 10 | |
| Day Percent Change: 0.25% Day Change: 0.23 | |
| Week Change: -0.84% Year-to-date Change: 2.2% | |
| OTIS Links: Profile News Message Board | |
| Charts:- Daily , Weekly | |
| Add OTIS to Watchlist: View: Get Complete OTIS Trend Analysis ➞ | |
 | TXT Textron Inc. |
| Sector: Industrials | |
| SubSector: Aerospace/Defense - Major Diversified | |
| MarketCap: 6123.09 Millions | |
| Recent Price: 84.77 Smart Investing & Trading Score: 10 | |
| Day Percent Change: 0.21% Day Change: 0.18 | |
| Week Change: -2.01% Year-to-date Change: 5.4% | |
| TXT Links: Profile News Message Board | |
| Charts:- Daily , Weekly | |
| Add TXT to Watchlist: View: Get Complete TXT Trend Analysis ➞ | |
 | MAS Masco Corporation |
| Sector: Industrials | |
| SubSector: General Building Materials | |
| MarketCap: 8655.63 Millions | |
| Recent Price: 68.58 Smart Investing & Trading Score: 10 | |
| Day Percent Change: 0.19% Day Change: 0.13 | |
| Week Change: -1.82% Year-to-date Change: 2.4% | |
| MAS Links: Profile News Message Board | |
| Charts:- Daily , Weekly | |
| Add MAS to Watchlist: View: Get Complete MAS Trend Analysis ➞ | |
 | GGG Graco Inc. |
| Sector: Industrials | |
| SubSector: Diversified Machinery | |
| MarketCap: 7739.76 Millions | |
| Recent Price: 80.32 Smart Investing & Trading Score: 10 | |
| Day Percent Change: 0.15% Day Change: 0.12 | |
| Week Change: -2.71% Year-to-date Change: -7.4% | |
| GGG Links: Profile News Message Board | |
| Charts:- Daily , Weekly | |
| Add GGG to Watchlist: View: Get Complete GGG Trend Analysis ➞ | |
 | WY Weyerhaeuser Company |
| Sector: Industrials | |
| SubSector: Lumber, Wood Production | |
| MarketCap: 13244.8 Millions | |
| Recent Price: 30.20 Smart Investing & Trading Score: 10 | |
| Day Percent Change: 0.10% Day Change: 0.03 | |
| Week Change: -2.74% Year-to-date Change: -13.1% | |
| WY Links: Profile News Message Board | |
| Charts:- Daily , Weekly | |
| Add WY to Watchlist: View: Get Complete WY Trend Analysis ➞ | |
 | ULCC Frontier Group Holdings, Inc. |
| Sector: Industrials | |
| SubSector: Airlines | |
| MarketCap: 2160 Millions | |
| Recent Price: 5.84 Smart Investing & Trading Score: 10 | |
| Day Percent Change: -3.23% Day Change: -0.20 | |
| Week Change: -4.58% Year-to-date Change: 7.6% | |
| ULCC Links: Profile News Message Board | |
| Charts:- Daily , Weekly | |
| Add ULCC to Watchlist: View: Get Complete ULCC Trend Analysis ➞ | |
 | JBT John Bean Technologies Corporation |
| Sector: Industrials | |
| SubSector: Diversified Machinery | |
| MarketCap: 2197.36 Millions | |
| Recent Price: 88.84 Smart Investing & Trading Score: 10 | |
| Day Percent Change: -0.28% Day Change: -0.25 | |
| Week Change: -2.16% Year-to-date Change: -10.7% | |
| JBT Links: Profile News Message Board | |
| Charts:- Daily , Weekly | |
| Add JBT to Watchlist: View: Get Complete JBT Trend Analysis ➞ | |
 | ALG Alamo Group Inc. |
| Sector: Industrials | |
| SubSector: Farm & Construction Machinery | |
| MarketCap: 964.107 Millions | |
| Recent Price: 193.93 Smart Investing & Trading Score: 10 | |
| Day Percent Change: -0.23% Day Change: -0.45 | |
| Week Change: -2.31% Year-to-date Change: -7.7% | |
| ALG Links: Profile News Message Board | |
| Charts:- Daily , Weekly | |
| Add ALG to Watchlist: View: Get Complete ALG Trend Analysis ➞ | |
 | BCC Boise Cascade Company |
| Sector: Industrials | |
| SubSector: Lumber, Wood Production | |
| MarketCap: 963.938 Millions | |
| Recent Price: 132.01 Smart Investing & Trading Score: 10 | |
| Day Percent Change: -0.20% Day Change: -0.26 | |
| Week Change: -5.31% Year-to-date Change: 2.1% | |
| BCC Links: Profile News Message Board | |
| Charts:- Daily , Weekly | |
| Add BCC to Watchlist: View: Get Complete BCC Trend Analysis ➞ | |
 | SNA Snap-on Incorporated |
| Sector: Industrials | |
| SubSector: Small Tools & Accessories | |
| MarketCap: 5947.26 Millions | |
| Recent Price: 267.74 Smart Investing & Trading Score: 10 | |
| Day Percent Change: -0.08% Day Change: -0.22 | |
| Week Change: -1.09% Year-to-date Change: -7.3% | |
| SNA Links: Profile News Message Board | |
| Charts:- Daily , Weekly | |
| Add SNA to Watchlist: View: Get Complete SNA Trend Analysis ➞ | |
 | DHI D.R. Horton, Inc. |
| Sector: Industrials | |
| SubSector: Residential Construction | |
| MarketCap: 13372.6 Millions | |
| Recent Price: 142.48 Smart Investing & Trading Score: 10 | |
| Day Percent Change: -0.01% Day Change: -0.01 | |
| Week Change: -1.96% Year-to-date Change: -6.3% | |
| DHI Links: Profile News Message Board | |
| Charts:- Daily , Weekly | |
| Add DHI to Watchlist: View: Get Complete DHI Trend Analysis ➞ | |
 | KMT Kennametal Inc. |
| Sector: Industrials | |
| SubSector: Machine Tools & Accessories | |
| MarketCap: 1486.48 Millions | |
| Recent Price: 23.70 Smart Investing & Trading Score: 8 | |
| Day Percent Change: 0.72% Day Change: 0.17 | |
| Week Change: -1.41% Year-to-date Change: -8.1% | |
| KMT Links: Profile News Message Board | |
| Charts:- Daily , Weekly | |
| Add KMT to Watchlist: View: Get Complete KMT Trend Analysis ➞ | |
| For tabular summary view of above stock list: Summary View ➞ 0 - 25 , 25 - 50 , 50 - 75 , 75 - 100 , 100 - 125 , 125 - 150 , 150 - 175 , 175 - 200 , 200 - 225 , 225 - 250 , 250 - 275 , 275 - 300 | ||
| Click To Change The Sort Order: By Market Cap or Company Size Performance: Year-to-date, Week and Day | |
| Select Chart Type: | ||
|
Best Stocks Today 12Stocks.com |
© 2024 12Stocks.com Terms & Conditions Privacy Contact Us
All Information Provided Only For Education And Not To Be Used For Investing or Trading. See Terms & Conditions


One More Thing ... Get Best Stocks Delivered Daily!
Never Ever Miss A Move With Our Top Ten Stocks Lists
Find Best Stocks In Any Market - Bull or Bear Market
Take A Peek At Our Top Ten Stocks Lists: Daily, Weekly, Year-to-Date & Top Trends
Find Best Stocks In Any Market - Bull or Bear Market
Take A Peek At Our Top Ten Stocks Lists: Daily, Weekly, Year-to-Date & Top Trends
Industrial Stocks With Best Up Trends [0-bearish to 100-bullish]: Pinterest [100], Carpenter Technology[100], Clean Harbors[100], TPI Composites[100], United States[100], CAE [100], Woodward [100], 3M [100], AeroVironment [100], AMN Healthcare[100], Allegheny Technologies[100]
Best Industrial Stocks Year-to-Date:
Intuitive Machines[111.93%], Powell Industries[92.32%], Tutor Perini[84.29%], FTAI Infrastructure[82.78%], NuScale Power[77.67%], Caesarstone [68.72%], IES [67.31%], EMCOR [64.9%], BiomX [58.79%], Masonite [56.65%], ADS-TEC Energy[52.59%] Best Industrial Stocks This Week:
BiomX [27.03%], TPI Composites[19.78%], Pinterest [19.2%], Carpenter Technology[17.06%], Amprius Technologies[15.52%], Powell Industries[14.24%], Allegheny Technologies[13.72%], Woodward [10.15%], Lilium N.V[9.6%], Luxfer [8.74%], Hydrofarm [8.51%] Best Industrial Stocks Daily:
Pinterest [21.02%], Powell Industries[18.89%], Carpenter Technology[14.74%], LanzaTech Global[9.93%], Luxfer [9.87%], Amprius Technologies[7.49%], Lilium N.V[7.32%], Clean Harbors[6.81%], Virgin Galactic[6.57%], Sky Harbour[5.44%], TPI Composites[4.72%]