
 Login Sign Up


| |||||
 |  | ||||

| 12Stocks.com Market Intelligence |
Best Financial Stocks
| In a hurry? Financial Stocks Lists: Performance Trends Table, Stock Charts
Sort Financial stocks: Daily, Weekly, Year-to-Date, Market Cap & Trends. Filter Financial stocks list by size:All Financial Large Mid-Range Small & MicroCap |
| 12Stocks.com Financial Stocks Performances & Trends Daily | |||||||||
|
|  The overall Smart Investing & Trading Score is 53 (0-bearish to 100-bullish) which puts Financial sector in short term neutral trend. The Smart Investing & Trading Score from previous trading session is 36 and hence an improvement of trend.
| ||||||||
Here are the Smart Investing & Trading Scores of the most requested Financial stocks at 12Stocks.com (click stock name for detailed review):
|


| 12Stocks.com: Investing in Financial sector with Stocks | |
|
The following table helps investors and traders sort through current performance and trends (as measured by Smart Investing & Trading Score) of various
stocks in the Financial sector. Quick View: Move mouse or cursor over stock symbol (ticker) to view short-term Technical chart and over stock name to view long term chart. Click on  to add stock symbol to your watchlist and to add stock symbol to your watchlist and  to view watchlist. Click on any ticker or stock name for detailed market intelligence report for that stock. to view watchlist. Click on any ticker or stock name for detailed market intelligence report for that stock. |
12Stocks.com Performance of Stocks in Financial Sector
| Ticker | Stock Name | Watchlist | Category | Recent Price | Smart Investing & Trading Score | Change % | YTD Change% |
| ITUB | Itau Unibanco |   | Foreign Banks | 6.34 | 49 | 1.44% | -8.78% |
| NMRK | Newmark | | Property Mgmt | 9.99 | 49 | 0.10% | -8.85% |
| SAR | Saratoga | | Investments | 23.57 | 63 | -0.21% | -8.86% |
| RQI | Cohen & Steers Quality ome Realty Fund | | Closed-End Fund - Equity | 11.15 | 49 | 1.18% | -8.91% |
| NRDS | NerdWallet | | Credit Services | 13.61 | 42 | 2.99% | -8.94% |
| VTMX | Vesta s | | REIT - Industrial | 36.15 | 83 | 0.08% | -9.09% |
| SFNC | Simmons First | | Banks | 17.98 | 44 | 1.58% | -9.38% |
| GSBC | Great Southern | | Regional - Southwest Banks | 53.76 | 100 | 1.34% | -9.42% |
| PEB | Pebblebrook Hotel | | REIT | 14.46 | 25 | 1.54% | -9.51% |
| UBSI | United Bankshares | | Regional Banks | 33.96 | 67 | 0.41% | -9.56% |
| TFSL | TFS | | Regional Banks | 13.28 | 100 | 1.84% | -9.60% |
| SMBK | Smart | | Regional Banks | 22.13 | 100 | 2.69% | -9.64% |
| VICI | VICI Properties | | REIT - | 28.80 | 69 | 0.00% | -9.66% |
| AC | Associated Capital | | Asset Mgmt | 32.23 | 20 | 0.03% | -9.75% |
| ORRF | Orrstown | | Regional Banks | 26.60 | 52 | 0.99% | -9.83% |
| WSBC | WesBanco | | Regional Banks | 28.28 | 67 | 1.14% | -9.85% |
| BX | Blackstone | | Asset Mgmt | 117.99 | 32 | -0.84% | -9.88% |
| CUBE | CubeSmart | | REIT - Industrial | 41.75 | 32 | 0.72% | -9.92% |
| BHLB | Berkshire Hills | | S&L | 22.36 | 100 | 0.31% | -9.95% |
| TRST | TrustCo Bank | | Regional Banks | 27.93 | 93 | 1.16% | -10.05% |
| UCBI | United Community | | Regional Banks | 26.32 | 100 | 1.04% | -10.05% |
| FIBK | First Interstate | | Regional Banks | 27.64 | 83 | -0.90% | -10.11% |
| FPI | Farmland Partners | | REIT - | 11.21 | 74 | 0.81% | -10.18% |
| ELS | Equity LifeStyle | | REIT | 63.33 | 67 | 0.27% | -10.22% |
| OPRT | Oportun | | Credit Services | 3.51 | 69 | 9.01% | -10.23% |
| For chart view version of above stock list: Chart View ➞ 0 - 25 , 25 - 50 , 50 - 75 , 75 - 100 , 100 - 125 , 125 - 150 , 150 - 175 , 175 - 200 , 200 - 225 , 225 - 250 , 250 - 275 , 275 - 300 , 300 - 325 , 325 - 350 , 350 - 375 , 375 - 400 , 400 - 425 , 425 - 450 , 450 - 475 , 475 - 500 , 500 - 525 , 525 - 550 , 550 - 575 , 575 - 600 , 600 - 625 , 625 - 650 , 650 - 675 , 675 - 700 , 700 - 725 , 725 - 750 , 750 - 775 , 775 - 800 , 800 - 825 , 825 - 850 , 850 - 875 , 875 - 900 , 900 - 925 , 925 - 950 , 950 - 975 , 975 - 1000 , 1000 - 1025 , 1025 - 1050 , 1050 - 1075 , 1075 - 1100 , 1100 - 1125 , 1125 - 1150 , 1150 - 1175 , 1175 - 1200 , 1200 - 1225 , 1225 - 1250 | ||
 | Click To Change The Sort Order: By Market Cap or Company Size Performance: Year-to-date, Week and Day |  |
|
Get the most comprehensive stock market coverage daily at 12Stocks.com ➞ Best Stocks Today ➞ Best Stocks Weekly ➞ Best Stocks Year-to-Date ➞ Best Stocks Trends ➞  Best Stocks Today 12Stocks.com Best Nasdaq Stocks ➞ Best S&P 500 Stocks ➞ Best Tech Stocks ➞ Best Biotech Stocks ➞ |
| Detailed Overview of Financial Stocks |
| Financial Technical Overview, Leaders & Laggards, Top Financial ETF Funds & Detailed Financial Stocks List, Charts, Trends & More |
| Financial Sector: Technical Analysis, Trends & YTD Performance | |
| Financial sector is composed of stocks
from banks, brokers, insurance, REITs
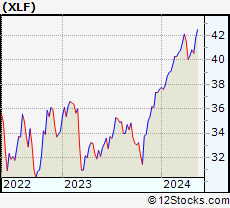
and services subsectors. Financial sector, as represented by XLF, an exchange-traded fund [ETF] that holds basket of Financial stocks (e.g, Bank of America, Goldman Sachs) is up by 7.85% and is currently outperforming the overall market by 0.97% year-to-date. Below is a quick view of Technical charts and trends: |
|
 XLF Weekly Chart |
|
| Long Term Trend: Good | |
| Medium Term Trend: Good | |
 XLF Daily Chart |
|
| Short Term Trend: Very Good | |
| Overall Trend Score: 53 | |
| YTD Performance: 7.85% | |
| **Trend Scores & Views Are Only For Educational Purposes And Not For Investing | |
| 12Stocks.com: Top Performing Financial Sector Stocks | ||||||||||||||||||||||||||||||||||||||||||||||||
 The top performing Financial sector stocks year to date are
Now, more recently, over last week, the top performing Financial sector stocks on the move are


|
||||||||||||||||||||||||||||||||||||||||||||||||
| 12Stocks.com: Investing in Financial Sector using Exchange Traded Funds | |
|
The following table shows list of key exchange traded funds (ETF) that
help investors track Financial Index. For detailed view, check out our ETF Funds section of our website. Quick View: Move mouse or cursor over ETF symbol (ticker) to view short-term Technical chart and over ETF name to view long term chart. Click on ticker or stock name for detailed view. Click on to add stock symbol to your watchlist and to view watchlist. |
12Stocks.com List of ETFs that track Financial Index
| Ticker | ETF Name | Watchlist | Recent Price | Smart Investing & Trading Score | Change % | Week % | Year-to-date % |
| XLF | Financial | | 40.55 | 53 | 0.22 | -0.66 | 7.85% |
| IAI | Broker-Dealers & Secs | | 114.27 | 95 | 0.98 | 1.11 | 5.29% |
| IYF | Financials | | 92.47 | 78 | 0.38 | 0.33 | 8.27% |
| IYG | Financial Services | | 64.09 | 60 | 0.31 | -0.8 | 7.29% |
| KRE | Regional Banking | | 49.65 | 100 | 1.29 | 3.03 | -5.3% |
| IXG | Global Financials | | 84.84 | 85 | 0.87 | 0.77 | 7.97% |
| VFH | Financials | | 98.70 | 73 | 0.34 | -0.23 | 6.98% |
| KBE | Bank | | 46.39 | 100 | 1.16 | 2.34 | 0.8% |
| FAS | Financial Bull 3X | | 98.83 | 60 | 0.95 | -1.79 | 19.58% |
| FAZ | Financial Bear 3X | | 11.08 | 17 | -0.89 | 2.03 | -18.95% |
| UYG | Financials | | 62.79 | 60 | 0.56 | -1.35 | 13.75% |
| IAT | Regional Banks | | 42.29 | 100 | 0.93 | 1.37 | 1.08% |
| KIE | Insurance | | 49.48 | 60 | 0.39 | 1.96 | 9.42% |
| PSCF | SmallCap Financials | | 47.28 | 100 | 0.77 | 1.98 | -3.86% |
| EUFN | Europe Financials | | 22.65 | 85 | 0.24 | 0.82 | 8.04% |
| PGF | Financial Preferred | | 14.85 | 64 | 1.43 | 1.92 | 1.85% |
| 12Stocks.com: Charts, Trends, Fundamental Data and Performances of Financial Stocks | |
|
We now take in-depth look at all Financial stocks including charts, multi-period performances and overall trends (as measured by Smart Investing & Trading Score). One can sort Financial stocks (click link to choose) by Daily, Weekly and by Year-to-Date performances. Also, one can sort by size of the company or by market capitalization. |
| Select Your Default Chart Type: | |||||
| |||||
| Click on stock symbol or name for detailed view. Click on to add stock symbol to your watchlist and to view watchlist. Quick View: Move mouse or cursor over "Daily" to quickly view daily Technical stock chart and over "Weekly" to view weekly Technical stock chart. | |||||

 | ITUB Itau Unibanco Holding S.A. |
| Sector: Financials | |
| SubSector: Foreign Regional Banks | |
| MarketCap: 48121 Millions | |
| Recent Price: 6.34 Smart Investing & Trading Score: 49 | |
| Day Percent Change: 1.44% Day Change: 0.09 | |
| Week Change: 0.63% Year-to-date Change: -8.8% | |
| ITUB Links: Profile News Message Board | |
| Charts:- Daily , Weekly | |
| Add ITUB to Watchlist: View: Get Complete ITUB Trend Analysis ➞ | |
 | NMRK Newmark Group, Inc. |
| Sector: Financials | |
| SubSector: Property Management | |
| MarketCap: 767.542 Millions | |
| Recent Price: 9.99 Smart Investing & Trading Score: 49 | |
| Day Percent Change: 0.10% Day Change: 0.01 | |
| Week Change: 2.36% Year-to-date Change: -8.9% | |
| NMRK Links: Profile News Message Board | |
| Charts:- Daily , Weekly | |
| Add NMRK to Watchlist: View: Get Complete NMRK Trend Analysis ➞ | |
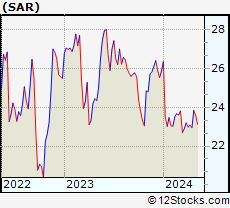 | SAR Saratoga Investment Corp. |
| Sector: Financials | |
| SubSector: Diversified Investments | |
| MarketCap: 132.67 Millions | |
| Recent Price: 23.57 Smart Investing & Trading Score: 63 | |
| Day Percent Change: -0.21% Day Change: -0.05 | |
| Week Change: -1.13% Year-to-date Change: -8.9% | |
| SAR Links: Profile News Message Board | |
| Charts:- Daily , Weekly | |
| Add SAR to Watchlist: View: Get Complete SAR Trend Analysis ➞ | |
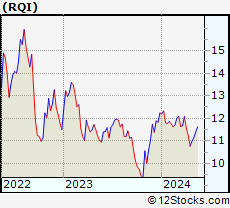 | RQI Cohen & Steers Quality Income Realty Fund, Inc. |
| Sector: Financials | |
| SubSector: Closed-End Fund - Equity | |
| MarketCap: 811.847 Millions | |
| Recent Price: 11.15 Smart Investing & Trading Score: 49 | |
| Day Percent Change: 1.18% Day Change: 0.13 | |
| Week Change: 1.46% Year-to-date Change: -8.9% | |
| RQI Links: Profile News Message Board | |
| Charts:- Daily , Weekly | |
| Add RQI to Watchlist: View: Get Complete RQI Trend Analysis ➞ | |
 | NRDS NerdWallet, Inc. |
| Sector: Financials | |
| SubSector: Credit Services | |
| MarketCap: 759 Millions | |
| Recent Price: 13.61 Smart Investing & Trading Score: 42 | |
| Day Percent Change: 2.99% Day Change: 0.39 | |
| Week Change: 5.47% Year-to-date Change: -8.9% | |
| NRDS Links: Profile News Message Board | |
| Charts:- Daily , Weekly | |
| Add NRDS to Watchlist: View: Get Complete NRDS Trend Analysis ➞ | |
 | VTMX Vesta Financials Corp SAB de CV |
| Sector: Financials | |
| SubSector: REIT - Industrial | |
| MarketCap: 2270 Millions | |
| Recent Price: 36.15 Smart Investing & Trading Score: 83 | |
| Day Percent Change: 0.08% Day Change: 0.03 | |
| Week Change: -0.17% Year-to-date Change: -9.1% | |
| VTMX Links: Profile News Message Board | |
| Charts:- Daily , Weekly | |
| Add VTMX to Watchlist: View: Get Complete VTMX Trend Analysis ➞ | |
 | SFNC Simmons First National Corporation |
| Sector: Financials | |
| SubSector: Money Center Banks | |
| MarketCap: 2125.49 Millions | |
| Recent Price: 17.98 Smart Investing & Trading Score: 44 | |
| Day Percent Change: 1.58% Day Change: 0.28 | |
| Week Change: 2.74% Year-to-date Change: -9.4% | |
| SFNC Links: Profile News Message Board | |
| Charts:- Daily , Weekly | |
| Add SFNC to Watchlist: View: Get Complete SFNC Trend Analysis ➞ | |
 | GSBC Great Southern Bancorp, Inc. |
| Sector: Financials | |
| SubSector: Regional - Southwest Banks | |
| MarketCap: 524.765 Millions | |
| Recent Price: 53.76 Smart Investing & Trading Score: 100 | |
| Day Percent Change: 1.34% Day Change: 0.71 | |
| Week Change: 1.99% Year-to-date Change: -9.4% | |
| GSBC Links: Profile News Message Board | |
| Charts:- Daily , Weekly | |
| Add GSBC to Watchlist: View: Get Complete GSBC Trend Analysis ➞ | |
 | PEB Pebblebrook Hotel Trust |
| Sector: Financials | |
| SubSector: REIT - Hotel/Motel | |
| MarketCap: 1472.84 Millions | |
| Recent Price: 14.46 Smart Investing & Trading Score: 25 | |
| Day Percent Change: 1.54% Day Change: 0.22 | |
| Week Change: -3.34% Year-to-date Change: -9.5% | |
| PEB Links: Profile News Message Board | |
| Charts:- Daily , Weekly | |
| Add PEB to Watchlist: View: Get Complete PEB Trend Analysis ➞ | |
 | UBSI United Bankshares, Inc. |
| Sector: Financials | |
| SubSector: Regional - Mid-Atlantic Banks | |
| MarketCap: 2286.79 Millions | |
| Recent Price: 33.96 Smart Investing & Trading Score: 67 | |
| Day Percent Change: 0.41% Day Change: 0.14 | |
| Week Change: 1.83% Year-to-date Change: -9.6% | |
| UBSI Links: Profile News Message Board | |
| Charts:- Daily , Weekly | |
| Add UBSI to Watchlist: View: Get Complete UBSI Trend Analysis ➞ | |
 | TFSL TFS Financial Corporation |
| Sector: Financials | |
| SubSector: Regional - Midwest Banks | |
| MarketCap: 4539.1 Millions | |
| Recent Price: 13.28 Smart Investing & Trading Score: 100 | |
| Day Percent Change: 1.84% Day Change: 0.24 | |
| Week Change: 8.85% Year-to-date Change: -9.6% | |
| TFSL Links: Profile News Message Board | |
| Charts:- Daily , Weekly | |
| Add TFSL to Watchlist: View: Get Complete TFSL Trend Analysis ➞ | |
 | SMBK SmartFinancial, Inc. |
| Sector: Financials | |
| SubSector: Regional - Southeast Banks | |
| MarketCap: 174.035 Millions | |
| Recent Price: 22.13 Smart Investing & Trading Score: 100 | |
| Day Percent Change: 2.69% Day Change: 0.58 | |
| Week Change: 7.12% Year-to-date Change: -9.6% | |
| SMBK Links: Profile News Message Board | |
| Charts:- Daily , Weekly | |
| Add SMBK to Watchlist: View: Get Complete SMBK Trend Analysis ➞ | |
 | VICI VICI Properties Inc. |
| Sector: Financials | |
| SubSector: REIT - Diversified | |
| MarketCap: 7327.03 Millions | |
| Recent Price: 28.80 Smart Investing & Trading Score: 69 | |
| Day Percent Change: 0.00% Day Change: 0.00 | |
| Week Change: 1.16% Year-to-date Change: -9.7% | |
| VICI Links: Profile News Message Board | |
| Charts:- Daily , Weekly | |
| Add VICI to Watchlist: View: Get Complete VICI Trend Analysis ➞ | |
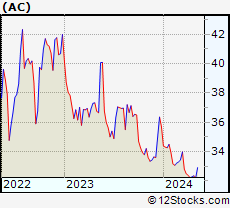 | AC Associated Capital Group, Inc. |
| Sector: Financials | |
| SubSector: Asset Management | |
| MarketCap: 657.503 Millions | |
| Recent Price: 32.23 Smart Investing & Trading Score: 20 | |
| Day Percent Change: 0.03% Day Change: 0.01 | |
| Week Change: -0.37% Year-to-date Change: -9.8% | |
| AC Links: Profile News Message Board | |
| Charts:- Daily , Weekly | |
| Add AC to Watchlist: View: Get Complete AC Trend Analysis ➞ | |
 | ORRF Orrstown Financial Services, Inc. |
| Sector: Financials | |
| SubSector: Regional - Northeast Banks | |
| MarketCap: 159.999 Millions | |
| Recent Price: 26.60 Smart Investing & Trading Score: 52 | |
| Day Percent Change: 0.99% Day Change: 0.26 | |
| Week Change: 0.45% Year-to-date Change: -9.8% | |
| ORRF Links: Profile News Message Board | |
| Charts:- Daily , Weekly | |
| Add ORRF to Watchlist: View: Get Complete ORRF Trend Analysis ➞ | |
 | WSBC WesBanco, Inc. |
| Sector: Financials | |
| SubSector: Regional - Mid-Atlantic Banks | |
| MarketCap: 1575.79 Millions | |
| Recent Price: 28.28 Smart Investing & Trading Score: 67 | |
| Day Percent Change: 1.14% Day Change: 0.32 | |
| Week Change: 2.76% Year-to-date Change: -9.9% | |
| WSBC Links: Profile News Message Board | |
| Charts:- Daily , Weekly | |
| Add WSBC to Watchlist: View: Get Complete WSBC Trend Analysis ➞ | |
 | BX The Blackstone Group Inc. |
| Sector: Financials | |
| SubSector: Asset Management | |
| MarketCap: 50957.7 Millions | |
| Recent Price: 117.99 Smart Investing & Trading Score: 32 | |
| Day Percent Change: -0.84% Day Change: -1.00 | |
| Week Change: -3.67% Year-to-date Change: -9.9% | |
| BX Links: Profile News Message Board | |
| Charts:- Daily , Weekly | |
| Add BX to Watchlist: View: Get Complete BX Trend Analysis ➞ | |
 | CUBE CubeSmart |
| Sector: Financials | |
| SubSector: REIT - Industrial | |
| MarketCap: 4562.99 Millions | |
| Recent Price: 41.75 Smart Investing & Trading Score: 32 | |
| Day Percent Change: 0.72% Day Change: 0.30 | |
| Week Change: 2.43% Year-to-date Change: -9.9% | |
| CUBE Links: Profile News Message Board | |
| Charts:- Daily , Weekly | |
| Add CUBE to Watchlist: View: Get Complete CUBE Trend Analysis ➞ | |
 | BHLB Berkshire Hills Bancorp, Inc. |
| Sector: Financials | |
| SubSector: Savings & Loans | |
| MarketCap: 686.33 Millions | |
| Recent Price: 22.36 Smart Investing & Trading Score: 100 | |
| Day Percent Change: 0.31% Day Change: 0.07 | |
| Week Change: 1.18% Year-to-date Change: -10.0% | |
| BHLB Links: Profile News Message Board | |
| Charts:- Daily , Weekly | |
| Add BHLB to Watchlist: View: Get Complete BHLB Trend Analysis ➞ | |
 | TRST TrustCo Bank Corp NY |
| Sector: Financials | |
| SubSector: Regional - Northeast Banks | |
| MarketCap: 543.999 Millions | |
| Recent Price: 27.93 Smart Investing & Trading Score: 93 | |
| Day Percent Change: 1.16% Day Change: 0.32 | |
| Week Change: 3.14% Year-to-date Change: -10.1% | |
| TRST Links: Profile News Message Board | |
| Charts:- Daily , Weekly | |
| Add TRST to Watchlist: View: Get Complete TRST Trend Analysis ➞ | |
 | UCBI United Community Banks, Inc. |
| Sector: Financials | |
| SubSector: Regional - Mid-Atlantic Banks | |
| MarketCap: 1593.99 Millions | |
| Recent Price: 26.32 Smart Investing & Trading Score: 100 | |
| Day Percent Change: 1.04% Day Change: 0.27 | |
| Week Change: 1.31% Year-to-date Change: -10.1% | |
| UCBI Links: Profile News Message Board | |
| Charts:- Daily , Weekly | |
| Add UCBI to Watchlist: View: Get Complete UCBI Trend Analysis ➞ | |
 | FIBK First Interstate BancSystem, Inc. |
| Sector: Financials | |
| SubSector: Regional - Pacific Banks | |
| MarketCap: 1797.69 Millions | |
| Recent Price: 27.64 Smart Investing & Trading Score: 83 | |
| Day Percent Change: -0.90% Day Change: -0.25 | |
| Week Change: 2.37% Year-to-date Change: -10.1% | |
| FIBK Links: Profile News Message Board | |
| Charts:- Daily , Weekly | |
| Add FIBK to Watchlist: View: Get Complete FIBK Trend Analysis ➞ | |
 | FPI Farmland Partners Inc. |
| Sector: Financials | |
| SubSector: REIT - Diversified | |
| MarketCap: 182.653 Millions | |
| Recent Price: 11.21 Smart Investing & Trading Score: 74 | |
| Day Percent Change: 0.81% Day Change: 0.09 | |
| Week Change: 3.41% Year-to-date Change: -10.2% | |
| FPI Links: Profile News Message Board | |
| Charts:- Daily , Weekly | |
| Add FPI to Watchlist: View: Get Complete FPI Trend Analysis ➞ | |
 | ELS Equity LifeStyle Properties, Inc. |
| Sector: Financials | |
| SubSector: REIT - Residential | |
| MarketCap: 9570.61 Millions | |
| Recent Price: 63.33 Smart Investing & Trading Score: 67 | |
| Day Percent Change: 0.27% Day Change: 0.17 | |
| Week Change: 4.63% Year-to-date Change: -10.2% | |
| ELS Links: Profile News Message Board | |
| Charts:- Daily , Weekly | |
| Add ELS to Watchlist: View: Get Complete ELS Trend Analysis ➞ | |
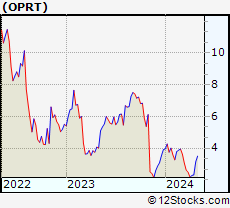 | OPRT Oportun Financial Corporation |
| Sector: Financials | |
| SubSector: Credit Services | |
| MarketCap: 360.208 Millions | |
| Recent Price: 3.51 Smart Investing & Trading Score: 69 | |
| Day Percent Change: 9.01% Day Change: 0.29 | |
| Week Change: 11.43% Year-to-date Change: -10.2% | |
| OPRT Links: Profile News Message Board | |
| Charts:- Daily , Weekly | |
| Add OPRT to Watchlist: View: Get Complete OPRT Trend Analysis ➞ | |
| For tabular summary view of above stock list: Summary View ➞ 0 - 25 , 25 - 50 , 50 - 75 , 75 - 100 , 100 - 125 , 125 - 150 , 150 - 175 , 175 - 200 , 200 - 225 , 225 - 250 , 250 - 275 , 275 - 300 , 300 - 325 , 325 - 350 , 350 - 375 , 375 - 400 , 400 - 425 , 425 - 450 , 450 - 475 , 475 - 500 , 500 - 525 , 525 - 550 , 550 - 575 , 575 - 600 , 600 - 625 , 625 - 650 , 650 - 675 , 675 - 700 , 700 - 725 , 725 - 750 , 750 - 775 , 775 - 800 , 800 - 825 , 825 - 850 , 850 - 875 , 875 - 900 , 900 - 925 , 925 - 950 , 950 - 975 , 975 - 1000 , 1000 - 1025 , 1025 - 1050 , 1050 - 1075 , 1075 - 1100 , 1100 - 1125 , 1125 - 1150 , 1150 - 1175 , 1175 - 1200 , 1200 - 1225 , 1225 - 1250 | ||
| Click To Change The Sort Order: By Market Cap or Company Size Performance: Year-to-date, Week and Day | |
| Select Chart Type: | ||
|
Best Stocks Today 12Stocks.com |
© 2024 12Stocks.com Terms & Conditions Privacy Contact Us
All Information Provided Only For Education And Not To Be Used For Investing or Trading. See Terms & Conditions


One More Thing ... Get Best Stocks Delivered Daily!
Never Ever Miss A Move With Our Top Ten Stocks Lists
Find Best Stocks In Any Market - Bull or Bear Market
Take A Peek At Our Top Ten Stocks Lists: Daily, Weekly, Year-to-Date & Top Trends
Find Best Stocks In Any Market - Bull or Bear Market
Take A Peek At Our Top Ten Stocks Lists: Daily, Weekly, Year-to-Date & Top Trends
Financial Stocks With Best Up Trends [0-bearish to 100-bullish]: Siebert [100], Office Properties[100], Banco BBVA[100], AG Mortgage[100], Grupo Financiero[100], Banco Macro[100], Global X[100], Grupo Supervielle[100], Reinsurance [100], Camden Property[100], Noah [100]
Best Financial Stocks Year-to-Date:
Root [436.68%], Banco Macro[109.83%], Hippo [103.4%], Gladstone Capital[100.28%], Grupo Financiero[98.78%], Banco BBVA[92.83%], EverQuote [77.7%], Grupo Supervielle[69.21%], Yiren Digital[66.99%], LendingTree [62.96%], Lufax Holding[53.09%] Best Financial Stocks This Week:
Office Properties[42.79%], LendingTree [30.37%], SelectQuote [26.71%], Heartland [23.01%], Industrial Logistics[20.39%], New York[18.86%], KE [17.8%], Banco Macro[17.21%], Douglas Elliman[16.39%], Siebert [14.85%], eXp World[14.82%] Best Financial Stocks Daily:
Siebert [17.17%], SelectQuote [13.33%], Office Properties[12.11%], Banco BBVA[9.27%], Oportun [9.01%], AG Mortgage[8.85%], Diversified Healthcare[8.26%], RE/MAX [7.68%], Grupo Financiero[7.62%], Banco Macro[7.32%], Xenia Hotels[7.01%]