
 Login Sign Up


| |||||
 |  | ||||

| 12Stocks.com Market Intelligence |
Best Financial Stocks
| In a hurry? Financial Stocks Lists: Performance Trends Table, Stock Charts
Sort Financial stocks: Daily, Weekly, Year-to-Date, Market Cap & Trends. Filter Financial stocks list by size:All Financial Large Mid-Range Small & MicroCap |
| 12Stocks.com Financial Stocks Performances & Trends Daily | |||||||||
|
|  The overall Smart Investing & Trading Score is 53 (0-bearish to 100-bullish) which puts Financial sector in short term neutral trend. The Smart Investing & Trading Score from previous trading session is 36 and hence an improvement of trend.
| ||||||||
Here are the Smart Investing & Trading Scores of the most requested Financial stocks at 12Stocks.com (click stock name for detailed review):
|


| 12Stocks.com: Investing in Financial sector with Stocks | |
|
The following table helps investors and traders sort through current performance and trends (as measured by Smart Investing & Trading Score) of various
stocks in the Financial sector. Quick View: Move mouse or cursor over stock symbol (ticker) to view short-term Technical chart and over stock name to view long term chart. Click on  to add stock symbol to your watchlist and to add stock symbol to your watchlist and  to view watchlist. Click on any ticker or stock name for detailed market intelligence report for that stock. to view watchlist. Click on any ticker or stock name for detailed market intelligence report for that stock. |
12Stocks.com Performance of Stocks in Financial Sector
| Ticker | Stock Name | Watchlist | Category | Recent Price | Smart Investing & Trading Score | Change % | YTD Change% |
| SBR | Sabine Royalty |   | Investments | 62.95 | 75 | 0.25% | -7.24% |
| STWD | Starwood Property | | Mortgage | 19.49 | 57 | 0.62% | -7.28% |
| MAC | Macerich | | REIT - Retail | 14.29 | 32 | 3.55% | -7.39% |
| BHF | Brighthouse | | Life Insurance | 48.99 | 83 | 1.01% | -7.43% |
| KRBN | KraneShares Trust | | Exchange Traded Fund | 33.70 | 100 | -0.44% | -7.52% |
| BSRR | Sierra Bancorp | | Regional Banks | 20.85 | 90 | -0.33% | -7.54% |
| IGR | CBRE Clarion | | Closed-End Fund - Foreign | 5.01 | 87 | 1.42% | -7.73% |
| FSV | FirstService | | Property Mgmt | 149.54 | 42 | -0.82% | -7.74% |
| BMO | Bank of Montreal | | Banks | 91.23 | 63 | 1.49% | -7.79% |
| KRG | Kite Realty | | REIT - Retail | 21.07 | 32 | -1.50% | -7.83% |
| AMTB | Amerant Bancorp | | Regional Banks | 22.61 | 100 | -0.13% | -7.98% |
| MC | Moelis & | | Asset Mgmt | 51.58 | 42 | -0.54% | -8.11% |
| RKT | Rocket | | Mortgage Finance | 13.30 | 90 | 4.48% | -8.15% |
| EFX | Equifax | | Credit Services | 227.05 | 39 | 1.14% | -8.18% |
| BBU | Brookfield Business | | Real Estatet | 18.89 | 18 | -0.21% | -8.21% |
| GBCI | Glacier Bancorp | | Regional Banks | 37.91 | 100 | 0.69% | -8.25% |
| EFC | Ellington | | Mortgage | 11.66 | 95 | 0.09% | -8.26% |
| DHIL | Diamond Hill | | Asset Mgmt | 151.90 | 100 | -0.01% | -8.27% |
| TOWN | TowneBank | | Regional Banks | 27.30 | 93 | 1.00% | -8.27% |
| AUB | Atlantic Union | | Regional Banks | 33.48 | 82 | 0.42% | -8.37% |
| BFS | Saul Centers | | REIT - Retail | 35.98 | 38 | -3.07% | -8.38% |
| RLJ | RLJ Lodging | | REIT | 10.73 | 0 | 0.28% | -8.45% |
| CHCT | Community Healthcare | | REIT | 24.37 | 10 | -2.21% | -8.52% |
| HIFS | Hingham Institution | | S&L | 177.63 | 93 | 0.53% | -8.63% |
| SYBT | Stock Yards | | Regional Banks | 46.97 | 93 | 0.73% | -8.78% |
| For chart view version of above stock list: Chart View ➞ 0 - 25 , 25 - 50 , 50 - 75 , 75 - 100 , 100 - 125 , 125 - 150 , 150 - 175 , 175 - 200 , 200 - 225 , 225 - 250 , 250 - 275 , 275 - 300 , 300 - 325 , 325 - 350 , 350 - 375 , 375 - 400 , 400 - 425 , 425 - 450 , 450 - 475 , 475 - 500 , 500 - 525 , 525 - 550 , 550 - 575 , 575 - 600 , 600 - 625 , 625 - 650 , 650 - 675 , 675 - 700 , 700 - 725 , 725 - 750 , 750 - 775 , 775 - 800 , 800 - 825 , 825 - 850 , 850 - 875 , 875 - 900 , 900 - 925 , 925 - 950 , 950 - 975 , 975 - 1000 , 1000 - 1025 , 1025 - 1050 , 1050 - 1075 , 1075 - 1100 , 1100 - 1125 , 1125 - 1150 , 1150 - 1175 , 1175 - 1200 , 1200 - 1225 , 1225 - 1250 | ||
 | Click To Change The Sort Order: By Market Cap or Company Size Performance: Year-to-date, Week and Day |  |
|
Get the most comprehensive stock market coverage daily at 12Stocks.com ➞ Best Stocks Today ➞ Best Stocks Weekly ➞ Best Stocks Year-to-Date ➞ Best Stocks Trends ➞  Best Stocks Today 12Stocks.com Best Nasdaq Stocks ➞ Best S&P 500 Stocks ➞ Best Tech Stocks ➞ Best Biotech Stocks ➞ |
| Detailed Overview of Financial Stocks |
| Financial Technical Overview, Leaders & Laggards, Top Financial ETF Funds & Detailed Financial Stocks List, Charts, Trends & More |
| Financial Sector: Technical Analysis, Trends & YTD Performance | |
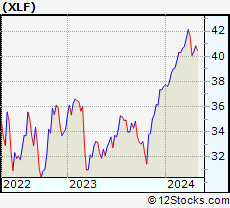
| Financial sector is composed of stocks
from banks, brokers, insurance, REITs
and services subsectors. Financial sector, as represented by XLF, an exchange-traded fund [ETF] that holds basket of Financial stocks (e.g, Bank of America, Goldman Sachs) is up by 7.85% and is currently outperforming the overall market by 0.97% year-to-date. Below is a quick view of Technical charts and trends: |
|
 XLF Weekly Chart |
|
| Long Term Trend: Good | |
| Medium Term Trend: Good | |
 XLF Daily Chart |
|
| Short Term Trend: Very Good | |
| Overall Trend Score: 53 | |
| YTD Performance: 7.85% | |
| **Trend Scores & Views Are Only For Educational Purposes And Not For Investing | |
| 12Stocks.com: Top Performing Financial Sector Stocks | ||||||||||||||||||||||||||||||||||||||||||||||||
 The top performing Financial sector stocks year to date are
Now, more recently, over last week, the top performing Financial sector stocks on the move are


|
||||||||||||||||||||||||||||||||||||||||||||||||
| 12Stocks.com: Investing in Financial Sector using Exchange Traded Funds | |
|
The following table shows list of key exchange traded funds (ETF) that
help investors track Financial Index. For detailed view, check out our ETF Funds section of our website. Quick View: Move mouse or cursor over ETF symbol (ticker) to view short-term Technical chart and over ETF name to view long term chart. Click on ticker or stock name for detailed view. Click on to add stock symbol to your watchlist and to view watchlist. |
12Stocks.com List of ETFs that track Financial Index
| Ticker | ETF Name | Watchlist | Recent Price | Smart Investing & Trading Score | Change % | Week % | Year-to-date % |
| XLF | Financial | | 40.55 | 53 | 0.22 | -0.66 | 7.85% |
| IAI | Broker-Dealers & Secs | | 114.27 | 95 | 0.98 | 1.11 | 5.29% |
| IYF | Financials | | 92.47 | 78 | 0.38 | 0.33 | 8.27% |
| IYG | Financial Services | | 64.09 | 60 | 0.31 | -0.8 | 7.29% |
| KRE | Regional Banking | | 49.65 | 100 | 1.29 | 3.03 | -5.3% |
| IXG | Global Financials | | 84.84 | 85 | 0.87 | 0.77 | 7.97% |
| VFH | Financials | | 98.70 | 73 | 0.34 | -0.23 | 6.98% |
| KBE | Bank | | 46.39 | 100 | 1.16 | 2.34 | 0.8% |
| FAS | Financial Bull 3X | | 98.83 | 60 | 0.95 | -1.79 | 19.58% |
| FAZ | Financial Bear 3X | | 11.08 | 17 | -0.89 | 2.03 | -18.95% |
| UYG | Financials | | 62.79 | 60 | 0.56 | -1.35 | 13.75% |
| IAT | Regional Banks | | 42.29 | 100 | 0.93 | 1.37 | 1.08% |
| KIE | Insurance | | 49.48 | 60 | 0.39 | 1.96 | 9.42% |
| PSCF | SmallCap Financials | | 47.28 | 100 | 0.77 | 1.98 | -3.86% |
| EUFN | Europe Financials | | 22.65 | 85 | 0.24 | 0.82 | 8.04% |
| PGF | Financial Preferred | | 14.85 | 64 | 1.43 | 1.92 | 1.85% |
| 12Stocks.com: Charts, Trends, Fundamental Data and Performances of Financial Stocks | |
|
We now take in-depth look at all Financial stocks including charts, multi-period performances and overall trends (as measured by Smart Investing & Trading Score). One can sort Financial stocks (click link to choose) by Daily, Weekly and by Year-to-Date performances. Also, one can sort by size of the company or by market capitalization. |
| Select Your Default Chart Type: | |||||
| |||||
| Click on stock symbol or name for detailed view. Click on to add stock symbol to your watchlist and to view watchlist. Quick View: Move mouse or cursor over "Daily" to quickly view daily Technical stock chart and over "Weekly" to view weekly Technical stock chart. | |||||

 | SBR Sabine Royalty Trust |
| Sector: Financials | |
| SubSector: Diversified Investments | |
| MarketCap: 381.27 Millions | |
| Recent Price: 62.95 Smart Investing & Trading Score: 75 | |
| Day Percent Change: 0.25% Day Change: 0.16 | |
| Week Change: 0.48% Year-to-date Change: -7.2% | |
| SBR Links: Profile News Message Board | |
| Charts:- Daily , Weekly | |
| Add SBR to Watchlist: View: Get Complete SBR Trend Analysis ➞ | |
 | STWD Starwood Property Trust, Inc. |
| Sector: Financials | |
| SubSector: Mortgage Investment | |
| MarketCap: 3447.09 Millions | |
| Recent Price: 19.49 Smart Investing & Trading Score: 57 | |
| Day Percent Change: 0.62% Day Change: 0.12 | |
| Week Change: -0.05% Year-to-date Change: -7.3% | |
| STWD Links: Profile News Message Board | |
| Charts:- Daily , Weekly | |
| Add STWD to Watchlist: View: Get Complete STWD Trend Analysis ➞ | |
 | MAC The Macerich Company |
| Sector: Financials | |
| SubSector: REIT - Retail | |
| MarketCap: 1172.54 Millions | |
| Recent Price: 14.29 Smart Investing & Trading Score: 32 | |
| Day Percent Change: 3.55% Day Change: 0.49 | |
| Week Change: -8.81% Year-to-date Change: -7.4% | |
| MAC Links: Profile News Message Board | |
| Charts:- Daily , Weekly | |
| Add MAC to Watchlist: View: Get Complete MAC Trend Analysis ➞ | |
 | BHF Brighthouse Financial, Inc. |
| Sector: Financials | |
| SubSector: Life Insurance | |
| MarketCap: 2045.06 Millions | |
| Recent Price: 48.99 Smart Investing & Trading Score: 83 | |
| Day Percent Change: 1.01% Day Change: 0.49 | |
| Week Change: 0.53% Year-to-date Change: -7.4% | |
| BHF Links: Profile News Message Board | |
| Charts:- Daily , Weekly | |
| Add BHF to Watchlist: View: Get Complete BHF Trend Analysis ➞ | |
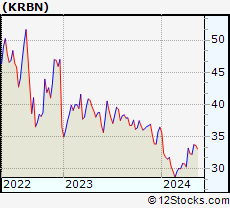 | KRBN KraneShares Trust KFA Global Carbon ETF |
| Sector: Financials | |
| SubSector: Exchange Traded Fund | |
| MarketCap: 60157 Millions | |
| Recent Price: 33.70 Smart Investing & Trading Score: 100 | |
| Day Percent Change: -0.44% Day Change: -0.15 | |
| Week Change: 4.63% Year-to-date Change: -7.5% | |
| KRBN Links: Profile News Message Board | |
| Charts:- Daily , Weekly | |
| Add KRBN to Watchlist: View: Get Complete KRBN Trend Analysis ➞ | |
 | BSRR Sierra Bancorp |
| Sector: Financials | |
| SubSector: Regional - Pacific Banks | |
| MarketCap: 256.929 Millions | |
| Recent Price: 20.85 Smart Investing & Trading Score: 90 | |
| Day Percent Change: -0.33% Day Change: -0.07 | |
| Week Change: 1.71% Year-to-date Change: -7.5% | |
| BSRR Links: Profile News Message Board | |
| Charts:- Daily , Weekly | |
| Add BSRR to Watchlist: View: Get Complete BSRR Trend Analysis ➞ | |
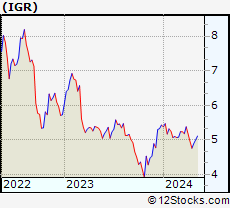 | IGR CBRE Clarion Global Real Estate Income Fund |
| Sector: Financials | |
| SubSector: Closed-End Fund - Foreign | |
| MarketCap: 494.347 Millions | |
| Recent Price: 5.01 Smart Investing & Trading Score: 87 | |
| Day Percent Change: 1.42% Day Change: 0.07 | |
| Week Change: 2.24% Year-to-date Change: -7.7% | |
| IGR Links: Profile News Message Board | |
| Charts:- Daily , Weekly | |
| Add IGR to Watchlist: View: Get Complete IGR Trend Analysis ➞ | |
 | FSV FirstService Corporation |
| Sector: Financials | |
| SubSector: Property Management | |
| MarketCap: 2793.92 Millions | |
| Recent Price: 149.54 Smart Investing & Trading Score: 42 | |
| Day Percent Change: -0.82% Day Change: -1.23 | |
| Week Change: -0.17% Year-to-date Change: -7.7% | |
| FSV Links: Profile News Message Board | |
| Charts:- Daily , Weekly | |
| Add FSV to Watchlist: View: Get Complete FSV Trend Analysis ➞ | |
 | BMO Bank of Montreal |
| Sector: Financials | |
| SubSector: Money Center Banks | |
| MarketCap: 32830.2 Millions | |
| Recent Price: 91.23 Smart Investing & Trading Score: 63 | |
| Day Percent Change: 1.49% Day Change: 1.34 | |
| Week Change: 0.35% Year-to-date Change: -7.8% | |
| BMO Links: Profile News Message Board | |
| Charts:- Daily , Weekly | |
| Add BMO to Watchlist: View: Get Complete BMO Trend Analysis ➞ | |
 | KRG Kite Realty Group Trust |
| Sector: Financials | |
| SubSector: REIT - Retail | |
| MarketCap: 1030.14 Millions | |
| Recent Price: 21.07 Smart Investing & Trading Score: 32 | |
| Day Percent Change: -1.50% Day Change: -0.32 | |
| Week Change: -0.89% Year-to-date Change: -7.8% | |
| KRG Links: Profile News Message Board | |
| Charts:- Daily , Weekly | |
| Add KRG to Watchlist: View: Get Complete KRG Trend Analysis ➞ | |
 | AMTB Amerant Bancorp Inc. |
| Sector: Financials | |
| SubSector: Regional - Midwest Banks | |
| MarketCap: 653.87 Millions | |
| Recent Price: 22.61 Smart Investing & Trading Score: 100 | |
| Day Percent Change: -0.13% Day Change: -0.03 | |
| Week Change: 4.77% Year-to-date Change: -8.0% | |
| AMTB Links: Profile News Message Board | |
| Charts:- Daily , Weekly | |
| Add AMTB to Watchlist: View: Get Complete AMTB Trend Analysis ➞ | |
 | MC Moelis & Company |
| Sector: Financials | |
| SubSector: Asset Management | |
| MarketCap: 1675.93 Millions | |
| Recent Price: 51.58 Smart Investing & Trading Score: 42 | |
| Day Percent Change: -0.54% Day Change: -0.28 | |
| Week Change: 3.68% Year-to-date Change: -8.1% | |
| MC Links: Profile News Message Board | |
| Charts:- Daily , Weekly | |
| Add MC to Watchlist: View: Get Complete MC Trend Analysis ➞ | |
 | RKT Rocket Companies, Inc. |
| Sector: Financials | |
| SubSector: Mortgage Finance | |
| MarketCap: 41287 Millions | |
| Recent Price: 13.30 Smart Investing & Trading Score: 90 | |
| Day Percent Change: 4.48% Day Change: 0.57 | |
| Week Change: 7.69% Year-to-date Change: -8.2% | |
| RKT Links: Profile News Message Board | |
| Charts:- Daily , Weekly | |
| Add RKT to Watchlist: View: Get Complete RKT Trend Analysis ➞ | |
 | EFX Equifax Inc. |
| Sector: Financials | |
| SubSector: Credit Services | |
| MarketCap: 13754.6 Millions | |
| Recent Price: 227.05 Smart Investing & Trading Score: 39 | |
| Day Percent Change: 1.14% Day Change: 2.55 | |
| Week Change: 1.62% Year-to-date Change: -8.2% | |
| EFX Links: Profile News Message Board | |
| Charts:- Daily , Weekly | |
| Add EFX to Watchlist: View: Get Complete EFX Trend Analysis ➞ | |
 | BBU Brookfield Business Partners L.P. |
| Sector: Financials | |
| SubSector: Real Estate Development | |
| MarketCap: 1612.19 Millions | |
| Recent Price: 18.89 Smart Investing & Trading Score: 18 | |
| Day Percent Change: -0.21% Day Change: -0.04 | |
| Week Change: -1.36% Year-to-date Change: -8.2% | |
| BBU Links: Profile News Message Board | |
| Charts:- Daily , Weekly | |
| Add BBU to Watchlist: View: Get Complete BBU Trend Analysis ➞ | |
 | GBCI Glacier Bancorp, Inc. |
| Sector: Financials | |
| SubSector: Regional - Pacific Banks | |
| MarketCap: 3142.89 Millions | |
| Recent Price: 37.91 Smart Investing & Trading Score: 100 | |
| Day Percent Change: 0.69% Day Change: 0.26 | |
| Week Change: 2.13% Year-to-date Change: -8.3% | |
| GBCI Links: Profile News Message Board | |
| Charts:- Daily , Weekly | |
| Add GBCI to Watchlist: View: Get Complete GBCI Trend Analysis ➞ | |
 | EFC Ellington Financial Inc. |
| Sector: Financials | |
| SubSector: Mortgage Investment | |
| MarketCap: 380.239 Millions | |
| Recent Price: 11.66 Smart Investing & Trading Score: 95 | |
| Day Percent Change: 0.09% Day Change: 0.01 | |
| Week Change: -0.43% Year-to-date Change: -8.3% | |
| EFC Links: Profile News Message Board | |
| Charts:- Daily , Weekly | |
| Add EFC to Watchlist: View: Get Complete EFC Trend Analysis ➞ | |
 | DHIL Diamond Hill Investment Group, Inc. |
| Sector: Financials | |
| SubSector: Asset Management | |
| MarketCap: 316.203 Millions | |
| Recent Price: 151.90 Smart Investing & Trading Score: 100 | |
| Day Percent Change: -0.01% Day Change: -0.02 | |
| Week Change: 0.27% Year-to-date Change: -8.3% | |
| DHIL Links: Profile News Message Board | |
| Charts:- Daily , Weekly | |
| Add DHIL to Watchlist: View: Get Complete DHIL Trend Analysis ➞ | |
 | TOWN TowneBank |
| Sector: Financials | |
| SubSector: Regional - Mid-Atlantic Banks | |
| MarketCap: 1344.09 Millions | |
| Recent Price: 27.30 Smart Investing & Trading Score: 93 | |
| Day Percent Change: 1.00% Day Change: 0.27 | |
| Week Change: 1.41% Year-to-date Change: -8.3% | |
| TOWN Links: Profile News Message Board | |
| Charts:- Daily , Weekly | |
| Add TOWN to Watchlist: View: Get Complete TOWN Trend Analysis ➞ | |
 | AUB Atlantic Union Bankshares Corporation |
| Sector: Financials | |
| SubSector: Regional - Mid-Atlantic Banks | |
| MarketCap: 1728.79 Millions | |
| Recent Price: 33.48 Smart Investing & Trading Score: 82 | |
| Day Percent Change: 0.42% Day Change: 0.14 | |
| Week Change: 3.72% Year-to-date Change: -8.4% | |
| AUB Links: Profile News Message Board | |
| Charts:- Daily , Weekly | |
| Add AUB to Watchlist: View: Get Complete AUB Trend Analysis ➞ | |
 | BFS Saul Centers, Inc. |
| Sector: Financials | |
| SubSector: REIT - Retail | |
| MarketCap: 689.914 Millions | |
| Recent Price: 35.98 Smart Investing & Trading Score: 38 | |
| Day Percent Change: -3.07% Day Change: -1.14 | |
| Week Change: 1.27% Year-to-date Change: -8.4% | |
| BFS Links: Profile News Message Board | |
| Charts:- Daily , Weekly | |
| Add BFS to Watchlist: View: Get Complete BFS Trend Analysis ➞ | |
 | RLJ RLJ Lodging Trust |
| Sector: Financials | |
| SubSector: REIT - Hotel/Motel | |
| MarketCap: 1019.34 Millions | |
| Recent Price: 10.73 Smart Investing & Trading Score: 0 | |
| Day Percent Change: 0.28% Day Change: 0.03 | |
| Week Change: -3.42% Year-to-date Change: -8.5% | |
| RLJ Links: Profile News Message Board | |
| Charts:- Daily , Weekly | |
| Add RLJ to Watchlist: View: Get Complete RLJ Trend Analysis ➞ | |
 | CHCT Community Healthcare Trust Incorporated |
| Sector: Financials | |
| SubSector: REIT - Healthcare Facilities | |
| MarketCap: 698.614 Millions | |
| Recent Price: 24.37 Smart Investing & Trading Score: 10 | |
| Day Percent Change: -2.21% Day Change: -0.55 | |
| Week Change: -7.44% Year-to-date Change: -8.5% | |
| CHCT Links: Profile News Message Board | |
| Charts:- Daily , Weekly | |
| Add CHCT to Watchlist: View: Get Complete CHCT Trend Analysis ➞ | |
 | HIFS Hingham Institution for Savings |
| Sector: Financials | |
| SubSector: Savings & Loans | |
| MarketCap: 341.93 Millions | |
| Recent Price: 177.63 Smart Investing & Trading Score: 93 | |
| Day Percent Change: 0.53% Day Change: 0.93 | |
| Week Change: 2.77% Year-to-date Change: -8.6% | |
| HIFS Links: Profile News Message Board | |
| Charts:- Daily , Weekly | |
| Add HIFS to Watchlist: View: Get Complete HIFS Trend Analysis ➞ | |
 | SYBT Stock Yards Bancorp, Inc. |
| Sector: Financials | |
| SubSector: Regional - Southeast Banks | |
| MarketCap: 629.235 Millions | |
| Recent Price: 46.97 Smart Investing & Trading Score: 93 | |
| Day Percent Change: 0.73% Day Change: 0.34 | |
| Week Change: 1.78% Year-to-date Change: -8.8% | |
| SYBT Links: Profile News Message Board | |
| Charts:- Daily , Weekly | |
| Add SYBT to Watchlist: View: Get Complete SYBT Trend Analysis ➞ | |
| For tabular summary view of above stock list: Summary View ➞ 0 - 25 , 25 - 50 , 50 - 75 , 75 - 100 , 100 - 125 , 125 - 150 , 150 - 175 , 175 - 200 , 200 - 225 , 225 - 250 , 250 - 275 , 275 - 300 , 300 - 325 , 325 - 350 , 350 - 375 , 375 - 400 , 400 - 425 , 425 - 450 , 450 - 475 , 475 - 500 , 500 - 525 , 525 - 550 , 550 - 575 , 575 - 600 , 600 - 625 , 625 - 650 , 650 - 675 , 675 - 700 , 700 - 725 , 725 - 750 , 750 - 775 , 775 - 800 , 800 - 825 , 825 - 850 , 850 - 875 , 875 - 900 , 900 - 925 , 925 - 950 , 950 - 975 , 975 - 1000 , 1000 - 1025 , 1025 - 1050 , 1050 - 1075 , 1075 - 1100 , 1100 - 1125 , 1125 - 1150 , 1150 - 1175 , 1175 - 1200 , 1200 - 1225 , 1225 - 1250 | ||
| Click To Change The Sort Order: By Market Cap or Company Size Performance: Year-to-date, Week and Day | |
| Select Chart Type: | ||
|
Best Stocks Today 12Stocks.com |
© 2024 12Stocks.com Terms & Conditions Privacy Contact Us
All Information Provided Only For Education And Not To Be Used For Investing or Trading. See Terms & Conditions


One More Thing ... Get Best Stocks Delivered Daily!
Never Ever Miss A Move With Our Top Ten Stocks Lists
Find Best Stocks In Any Market - Bull or Bear Market
Take A Peek At Our Top Ten Stocks Lists: Daily, Weekly, Year-to-Date & Top Trends
Find Best Stocks In Any Market - Bull or Bear Market
Take A Peek At Our Top Ten Stocks Lists: Daily, Weekly, Year-to-Date & Top Trends
Financial Stocks With Best Up Trends [0-bearish to 100-bullish]: Siebert [100], Office Properties[100], Banco BBVA[100], AG Mortgage[100], Grupo Financiero[100], Banco Macro[100], Global X[100], Grupo Supervielle[100], Reinsurance [100], Camden Property[100], Noah [100]
Best Financial Stocks Year-to-Date:
Root [436.68%], Banco Macro[109.83%], Hippo [103.4%], Gladstone Capital[100.28%], Grupo Financiero[98.78%], Banco BBVA[92.83%], EverQuote [77.7%], Grupo Supervielle[69.21%], Yiren Digital[66.99%], LendingTree [62.96%], Lufax Holding[53.09%] Best Financial Stocks This Week:
Office Properties[42.79%], LendingTree [30.37%], SelectQuote [26.71%], Heartland [23.01%], Industrial Logistics[20.39%], New York[18.86%], KE [17.8%], Banco Macro[17.21%], Douglas Elliman[16.39%], Siebert [14.85%], eXp World[14.82%] Best Financial Stocks Daily:
Siebert [17.17%], SelectQuote [13.33%], Office Properties[12.11%], Banco BBVA[9.27%], Oportun [9.01%], AG Mortgage[8.85%], Diversified Healthcare[8.26%], RE/MAX [7.68%], Grupo Financiero[7.62%], Banco Macro[7.32%], Xenia Hotels[7.01%]