
 Login Sign Up


| |||||
 |  | ||||

| 12Stocks.com Market Intelligence |
Best Financial Stocks
| In a hurry? Financial Stocks Lists: Performance Trends Table, Stock Charts
Sort Financial stocks: Daily, Weekly, Year-to-Date, Market Cap & Trends. Filter Financial stocks list by size:All Financial Large Mid-Range Small & MicroCap |
| 12Stocks.com Financial Stocks Performances & Trends Daily | |||||||||
|
|  The overall Smart Investing & Trading Score is 53 (0-bearish to 100-bullish) which puts Financial sector in short term neutral trend. The Smart Investing & Trading Score from previous trading session is 36 and hence an improvement of trend.
| ||||||||
Here are the Smart Investing & Trading Scores of the most requested Financial stocks at 12Stocks.com (click stock name for detailed review):
|


| 12Stocks.com: Investing in Financial sector with Stocks | |
|
The following table helps investors and traders sort through current performance and trends (as measured by Smart Investing & Trading Score) of various
stocks in the Financial sector. Quick View: Move mouse or cursor over stock symbol (ticker) to view short-term Technical chart and over stock name to view long term chart. Click on  to add stock symbol to your watchlist and to add stock symbol to your watchlist and  to view watchlist. Click on any ticker or stock name for detailed market intelligence report for that stock. to view watchlist. Click on any ticker or stock name for detailed market intelligence report for that stock. |
12Stocks.com Performance of Stocks in Financial Sector
| Ticker | Stock Name | Watchlist | Category | Recent Price | Smart Investing & Trading Score | Change % | YTD Change% |
| GTY | Getty Realty |   | REIT - Retail | 27.65 | 100 | 0.00% | -5.37% |
| FBRT | Franklin BSP | | REIT - Mortgage | 12.89 | 77 | 0.62% | -5.42% |
| OCSL | Oaktree Specialty | | Credit Services | 19.30 | 22 | 0.05% | -5.48% |
| GDO | Western Asset | | Asset Mgmt | 12.06 | 50 | 0.84% | -5.56% |
| STBA | S&T Bancorp | | Regional Banks | 31.55 | 93 | 0.06% | -5.60% |
| SFBS | ServisFirst Bancshares | | Foreign Banks | 62.83 | 80 | 2.00% | -5.70% |
| PNFP | Pinnacle | | Regional Banks | 82.19 | 70 | 1.66% | -5.77% |
| WSR | Whitestone REIT | | REIT - Retail | 11.58 | 40 | -1.70% | -5.78% |
| AMAL | Amalgamated Bank | | Regional Banks | 25.38 | 90 | 0.75% | -5.79% |
| HASI | Hannon Armstrong | | REIT - | 25.98 | 83 | 3.01% | -5.80% |
| BKT | BlackRock ome | | Closed-End Fund - Debt | 11.47 | 64 | 0.97% | -5.83% |
| BANF | BancFirst | | Regional - Southwest Banks | 91.62 | 88 | -0.27% | -5.87% |
| NBB | Nuveen Taxable | | Asset Mgmt | 14.86 | 62 | 0.81% | -5.89% |
| BLK | BlackRock | | Asset Mgmt | 763.91 | 57 | 0.91% | -5.90% |
| BTO | John Hancock | | Closed-End Fund - Equity | 28.30 | 67 | 1.14% | -5.92% |
| PFLT | PennantPark Floating | | Asset Mgmt | 11.38 | 38 | 0.71% | -5.95% |
| DRH | DiamondRock Hospitality | | REIT | 8.83 | 25 | 0.68% | -5.96% |
| LKFN | Lakeland | | Regional Banks | 61.23 | 62 | -0.10% | -6.03% |
| TWO | Two Harbors | | Mortgage | 13.09 | 100 | 1.63% | -6.03% |
| ABCB | Ameris Bancorp | | Regional Banks | 49.82 | 100 | 2.34% | -6.09% |
| VTR | Ventas | | REIT | 46.79 | 100 | 1.23% | -6.12% |
| OZK | Bank OZK | | Regional Banks | 46.75 | 100 | 1.08% | -6.18% |
| TCBI | Texas Capital | | Regional - Southwest Banks | 60.58 | 100 | 1.15% | -6.27% |
| VRTS | Virtus | | Asset Mgmt | 226.60 | 47 | 1.49% | -6.27% |
| SRCE | 1st Source | | Regional Banks | 51.45 | 95 | -0.37% | -6.37% |
| For chart view version of above stock list: Chart View ➞ 0 - 25 , 25 - 50 , 50 - 75 , 75 - 100 , 100 - 125 , 125 - 150 , 150 - 175 , 175 - 200 , 200 - 225 , 225 - 250 , 250 - 275 , 275 - 300 , 300 - 325 , 325 - 350 , 350 - 375 , 375 - 400 , 400 - 425 , 425 - 450 , 450 - 475 , 475 - 500 , 500 - 525 , 525 - 550 , 550 - 575 , 575 - 600 , 600 - 625 , 625 - 650 , 650 - 675 , 675 - 700 , 700 - 725 , 725 - 750 , 750 - 775 , 775 - 800 , 800 - 825 , 825 - 850 , 850 - 875 , 875 - 900 , 900 - 925 , 925 - 950 , 950 - 975 , 975 - 1000 , 1000 - 1025 , 1025 - 1050 , 1050 - 1075 , 1075 - 1100 , 1100 - 1125 , 1125 - 1150 , 1150 - 1175 , 1175 - 1200 , 1200 - 1225 , 1225 - 1250 | ||
 | Click To Change The Sort Order: By Market Cap or Company Size Performance: Year-to-date, Week and Day |  |
|
Get the most comprehensive stock market coverage daily at 12Stocks.com ➞ Best Stocks Today ➞ Best Stocks Weekly ➞ Best Stocks Year-to-Date ➞ Best Stocks Trends ➞  Best Stocks Today 12Stocks.com Best Nasdaq Stocks ➞ Best S&P 500 Stocks ➞ Best Tech Stocks ➞ Best Biotech Stocks ➞ |
| Detailed Overview of Financial Stocks |
| Financial Technical Overview, Leaders & Laggards, Top Financial ETF Funds & Detailed Financial Stocks List, Charts, Trends & More |
| Financial Sector: Technical Analysis, Trends & YTD Performance | |
| Financial sector is composed of stocks
from banks, brokers, insurance, REITs
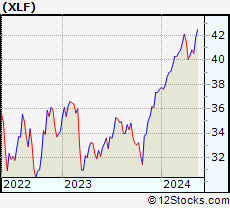
and services subsectors. Financial sector, as represented by XLF, an exchange-traded fund [ETF] that holds basket of Financial stocks (e.g, Bank of America, Goldman Sachs) is up by 7.85% and is currently outperforming the overall market by 0.97% year-to-date. Below is a quick view of Technical charts and trends: |
|
 XLF Weekly Chart |
|
| Long Term Trend: Good | |
| Medium Term Trend: Good | |
 XLF Daily Chart |
|
| Short Term Trend: Very Good | |
| Overall Trend Score: 53 | |
| YTD Performance: 7.85% | |
| **Trend Scores & Views Are Only For Educational Purposes And Not For Investing | |
| 12Stocks.com: Top Performing Financial Sector Stocks | ||||||||||||||||||||||||||||||||||||||||||||||||
 The top performing Financial sector stocks year to date are
Now, more recently, over last week, the top performing Financial sector stocks on the move are


|
||||||||||||||||||||||||||||||||||||||||||||||||
| 12Stocks.com: Investing in Financial Sector using Exchange Traded Funds | |
|
The following table shows list of key exchange traded funds (ETF) that
help investors track Financial Index. For detailed view, check out our ETF Funds section of our website. Quick View: Move mouse or cursor over ETF symbol (ticker) to view short-term Technical chart and over ETF name to view long term chart. Click on ticker or stock name for detailed view. Click on to add stock symbol to your watchlist and to view watchlist. |
12Stocks.com List of ETFs that track Financial Index
| Ticker | ETF Name | Watchlist | Recent Price | Smart Investing & Trading Score | Change % | Week % | Year-to-date % |
| XLF | Financial | | 40.55 | 53 | 0.22 | -0.66 | 7.85% |
| IAI | Broker-Dealers & Secs | | 114.27 | 95 | 0.98 | 1.11 | 5.29% |
| IYF | Financials | | 92.47 | 78 | 0.38 | 0.33 | 8.27% |
| IYG | Financial Services | | 64.09 | 60 | 0.31 | -0.8 | 7.29% |
| KRE | Regional Banking | | 49.65 | 100 | 1.29 | 3.03 | -5.3% |
| IXG | Global Financials | | 84.84 | 85 | 0.87 | 0.77 | 7.97% |
| VFH | Financials | | 98.70 | 73 | 0.34 | -0.23 | 6.98% |
| KBE | Bank | | 46.39 | 100 | 1.16 | 2.34 | 0.8% |
| FAS | Financial Bull 3X | | 98.83 | 60 | 0.95 | -1.79 | 19.58% |
| FAZ | Financial Bear 3X | | 11.08 | 17 | -0.89 | 2.03 | -18.95% |
| UYG | Financials | | 62.79 | 60 | 0.56 | -1.35 | 13.75% |
| IAT | Regional Banks | | 42.29 | 100 | 0.93 | 1.37 | 1.08% |
| KIE | Insurance | | 49.48 | 60 | 0.39 | 1.96 | 9.42% |
| PSCF | SmallCap Financials | | 47.28 | 100 | 0.77 | 1.98 | -3.86% |
| EUFN | Europe Financials | | 22.65 | 85 | 0.24 | 0.82 | 8.04% |
| PGF | Financial Preferred | | 14.85 | 64 | 1.43 | 1.92 | 1.85% |
| 12Stocks.com: Charts, Trends, Fundamental Data and Performances of Financial Stocks | |
|
We now take in-depth look at all Financial stocks including charts, multi-period performances and overall trends (as measured by Smart Investing & Trading Score). One can sort Financial stocks (click link to choose) by Daily, Weekly and by Year-to-Date performances. Also, one can sort by size of the company or by market capitalization. |
| Select Your Default Chart Type: | |||||
| |||||
| Click on stock symbol or name for detailed view. Click on to add stock symbol to your watchlist and to view watchlist. Quick View: Move mouse or cursor over "Daily" to quickly view daily Technical stock chart and over "Weekly" to view weekly Technical stock chart. | |||||

 | GTY Getty Realty Corp. |
| Sector: Financials | |
| SubSector: REIT - Retail | |
| MarketCap: 926.114 Millions | |
| Recent Price: 27.65 Smart Investing & Trading Score: 100 | |
| Day Percent Change: 0.00% Day Change: 0.00 | |
| Week Change: 2.71% Year-to-date Change: -5.4% | |
| GTY Links: Profile News Message Board | |
| Charts:- Daily , Weekly | |
| Add GTY to Watchlist: View: Get Complete GTY Trend Analysis ➞ | |
 | FBRT Franklin BSP Realty Trust, Inc. |
| Sector: Financials | |
| SubSector: REIT - Mortgage | |
| MarketCap: 1170 Millions | |
| Recent Price: 12.89 Smart Investing & Trading Score: 77 | |
| Day Percent Change: 0.62% Day Change: 0.08 | |
| Week Change: 1.18% Year-to-date Change: -5.4% | |
| FBRT Links: Profile News Message Board | |
| Charts:- Daily , Weekly | |
| Add FBRT to Watchlist: View: Get Complete FBRT Trend Analysis ➞ | |
 | OCSL Oaktree Specialty Lending Corporation |
| Sector: Financials | |
| SubSector: Credit Services | |
| MarketCap: 353.808 Millions | |
| Recent Price: 19.30 Smart Investing & Trading Score: 22 | |
| Day Percent Change: 0.05% Day Change: 0.01 | |
| Week Change: -2.67% Year-to-date Change: -5.5% | |
| OCSL Links: Profile News Message Board | |
| Charts:- Daily , Weekly | |
| Add OCSL to Watchlist: View: Get Complete OCSL Trend Analysis ➞ | |
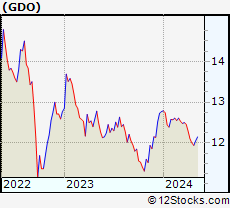 | GDO Western Asset Global Corporate Defined Opportunity Fund Inc. |
| Sector: Financials | |
| SubSector: Asset Management | |
| MarketCap: 194.203 Millions | |
| Recent Price: 12.06 Smart Investing & Trading Score: 50 | |
| Day Percent Change: 0.84% Day Change: 0.10 | |
| Week Change: 1.01% Year-to-date Change: -5.6% | |
| GDO Links: Profile News Message Board | |
| Charts:- Daily , Weekly | |
| Add GDO to Watchlist: View: Get Complete GDO Trend Analysis ➞ | |
 | STBA S&T Bancorp, Inc. |
| Sector: Financials | |
| SubSector: Regional - Northeast Banks | |
| MarketCap: 1136.99 Millions | |
| Recent Price: 31.55 Smart Investing & Trading Score: 93 | |
| Day Percent Change: 0.06% Day Change: 0.02 | |
| Week Change: 1.84% Year-to-date Change: -5.6% | |
| STBA Links: Profile News Message Board | |
| Charts:- Daily , Weekly | |
| Add STBA to Watchlist: View: Get Complete STBA Trend Analysis ➞ | |
 | SFBS ServisFirst Bancshares, Inc. |
| Sector: Financials | |
| SubSector: Foreign Money Center Banks | |
| MarketCap: 1596.71 Millions | |
| Recent Price: 62.83 Smart Investing & Trading Score: 80 | |
| Day Percent Change: 2.00% Day Change: 1.23 | |
| Week Change: 3.42% Year-to-date Change: -5.7% | |
| SFBS Links: Profile News Message Board | |
| Charts:- Daily , Weekly | |
| Add SFBS to Watchlist: View: Get Complete SFBS Trend Analysis ➞ | |
 | PNFP Pinnacle Financial Partners, Inc. |
| Sector: Financials | |
| SubSector: Regional - Southeast Banks | |
| MarketCap: 2771.75 Millions | |
| Recent Price: 82.19 Smart Investing & Trading Score: 70 | |
| Day Percent Change: 1.66% Day Change: 1.34 | |
| Week Change: 2.37% Year-to-date Change: -5.8% | |
| PNFP Links: Profile News Message Board | |
| Charts:- Daily , Weekly | |
| Add PNFP to Watchlist: View: Get Complete PNFP Trend Analysis ➞ | |
 | WSR Whitestone REIT |
| Sector: Financials | |
| SubSector: REIT - Retail | |
| MarketCap: 316.114 Millions | |
| Recent Price: 11.58 Smart Investing & Trading Score: 40 | |
| Day Percent Change: -1.70% Day Change: -0.20 | |
| Week Change: 1.85% Year-to-date Change: -5.8% | |
| WSR Links: Profile News Message Board | |
| Charts:- Daily , Weekly | |
| Add WSR to Watchlist: View: Get Complete WSR Trend Analysis ➞ | |
 | AMAL Amalgamated Bank |
| Sector: Financials | |
| SubSector: Regional - Northeast Banks | |
| MarketCap: 321.899 Millions | |
| Recent Price: 25.38 Smart Investing & Trading Score: 90 | |
| Day Percent Change: 0.75% Day Change: 0.19 | |
| Week Change: 3.17% Year-to-date Change: -5.8% | |
| AMAL Links: Profile News Message Board | |
| Charts:- Daily , Weekly | |
| Add AMAL to Watchlist: View: Get Complete AMAL Trend Analysis ➞ | |
 | HASI Hannon Armstrong Sustainable Infrastructure Capital, Inc. |
| Sector: Financials | |
| SubSector: REIT - Diversified | |
| MarketCap: 1405.93 Millions | |
| Recent Price: 25.98 Smart Investing & Trading Score: 83 | |
| Day Percent Change: 3.01% Day Change: 0.76 | |
| Week Change: 0.08% Year-to-date Change: -5.8% | |
| HASI Links: Profile News Message Board | |
| Charts:- Daily , Weekly | |
| Add HASI to Watchlist: View: Get Complete HASI Trend Analysis ➞ | |
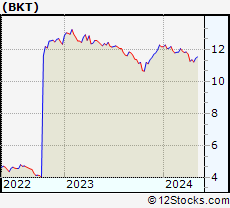 | BKT BlackRock Income Trust, Inc. |
| Sector: Financials | |
| SubSector: Closed-End Fund - Debt | |
| MarketCap: 357.807 Millions | |
| Recent Price: 11.47 Smart Investing & Trading Score: 64 | |
| Day Percent Change: 0.97% Day Change: 0.11 | |
| Week Change: 2.14% Year-to-date Change: -5.8% | |
| BKT Links: Profile News Message Board | |
| Charts:- Daily , Weekly | |
| Add BKT to Watchlist: View: Get Complete BKT Trend Analysis ➞ | |
 | BANF BancFirst Corporation |
| Sector: Financials | |
| SubSector: Regional - Southwest Banks | |
| MarketCap: 1068.65 Millions | |
| Recent Price: 91.62 Smart Investing & Trading Score: 88 | |
| Day Percent Change: -0.27% Day Change: -0.25 | |
| Week Change: 2.85% Year-to-date Change: -5.9% | |
| BANF Links: Profile News Message Board | |
| Charts:- Daily , Weekly | |
| Add BANF to Watchlist: View: Get Complete BANF Trend Analysis ➞ | |
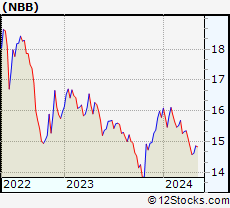 | NBB Nuveen Taxable Municipal Income Fund |
| Sector: Financials | |
| SubSector: Asset Management | |
| MarketCap: 495.403 Millions | |
| Recent Price: 14.86 Smart Investing & Trading Score: 62 | |
| Day Percent Change: 0.81% Day Change: 0.12 | |
| Week Change: 1.64% Year-to-date Change: -5.9% | |
| NBB Links: Profile News Message Board | |
| Charts:- Daily , Weekly | |
| Add NBB to Watchlist: View: Get Complete NBB Trend Analysis ➞ | |
 | BLK BlackRock, Inc. |
| Sector: Financials | |
| SubSector: Asset Management | |
| MarketCap: 61284.9 Millions | |
| Recent Price: 763.91 Smart Investing & Trading Score: 57 | |
| Day Percent Change: 0.91% Day Change: 6.91 | |
| Week Change: 0.14% Year-to-date Change: -5.9% | |
| BLK Links: Profile News Message Board | |
| Charts:- Daily , Weekly | |
| Add BLK to Watchlist: View: Get Complete BLK Trend Analysis ➞ | |
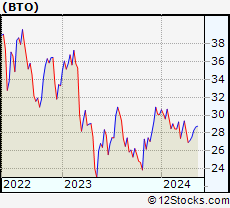 | BTO John Hancock Financial Opportunities Fund |
| Sector: Financials | |
| SubSector: Closed-End Fund - Equity | |
| MarketCap: 326.747 Millions | |
| Recent Price: 28.30 Smart Investing & Trading Score: 67 | |
| Day Percent Change: 1.14% Day Change: 0.32 | |
| Week Change: 2.69% Year-to-date Change: -5.9% | |
| BTO Links: Profile News Message Board | |
| Charts:- Daily , Weekly | |
| Add BTO to Watchlist: View: Get Complete BTO Trend Analysis ➞ | |
 | PFLT PennantPark Floating Rate Capital Ltd. |
| Sector: Financials | |
| SubSector: Asset Management | |
| MarketCap: 170.903 Millions | |
| Recent Price: 11.38 Smart Investing & Trading Score: 38 | |
| Day Percent Change: 0.71% Day Change: 0.08 | |
| Week Change: -0.96% Year-to-date Change: -6.0% | |
| PFLT Links: Profile News Message Board | |
| Charts:- Daily , Weekly | |
| Add PFLT to Watchlist: View: Get Complete PFLT Trend Analysis ➞ | |
 | DRH DiamondRock Hospitality Company |
| Sector: Financials | |
| SubSector: REIT - Hotel/Motel | |
| MarketCap: 964 Millions | |
| Recent Price: 8.83 Smart Investing & Trading Score: 25 | |
| Day Percent Change: 0.68% Day Change: 0.06 | |
| Week Change: -2.43% Year-to-date Change: -6.0% | |
| DRH Links: Profile News Message Board | |
| Charts:- Daily , Weekly | |
| Add DRH to Watchlist: View: Get Complete DRH Trend Analysis ➞ | |
 | LKFN Lakeland Financial Corporation |
| Sector: Financials | |
| SubSector: Regional - Midwest Banks | |
| MarketCap: 903.27 Millions | |
| Recent Price: 61.23 Smart Investing & Trading Score: 62 | |
| Day Percent Change: -0.10% Day Change: -0.06 | |
| Week Change: 2.44% Year-to-date Change: -6.0% | |
| LKFN Links: Profile News Message Board | |
| Charts:- Daily , Weekly | |
| Add LKFN to Watchlist: View: Get Complete LKFN Trend Analysis ➞ | |
 | TWO Two Harbors Investment Corp. |
| Sector: Financials | |
| SubSector: Mortgage Investment | |
| MarketCap: 1979.59 Millions | |
| Recent Price: 13.09 Smart Investing & Trading Score: 100 | |
| Day Percent Change: 1.63% Day Change: 0.21 | |
| Week Change: 4.47% Year-to-date Change: -6.0% | |
| TWO Links: Profile News Message Board | |
| Charts:- Daily , Weekly | |
| Add TWO to Watchlist: View: Get Complete TWO Trend Analysis ➞ | |
 | ABCB Ameris Bancorp |
| Sector: Financials | |
| SubSector: Regional - Mid-Atlantic Banks | |
| MarketCap: 1537.79 Millions | |
| Recent Price: 49.82 Smart Investing & Trading Score: 100 | |
| Day Percent Change: 2.34% Day Change: 1.14 | |
| Week Change: 4.05% Year-to-date Change: -6.1% | |
| ABCB Links: Profile News Message Board | |
| Charts:- Daily , Weekly | |
| Add ABCB to Watchlist: View: Get Complete ABCB Trend Analysis ➞ | |
 | VTR Ventas, Inc. |
| Sector: Financials | |
| SubSector: REIT - Healthcare Facilities | |
| MarketCap: 11180.4 Millions | |
| Recent Price: 46.79 Smart Investing & Trading Score: 100 | |
| Day Percent Change: 1.23% Day Change: 0.57 | |
| Week Change: 6.34% Year-to-date Change: -6.1% | |
| VTR Links: Profile News Message Board | |
| Charts:- Daily , Weekly | |
| Add VTR to Watchlist: View: Get Complete VTR Trend Analysis ➞ | |
 | OZK Bank OZK |
| Sector: Financials | |
| SubSector: Regional - Southeast Banks | |
| MarketCap: 2518.35 Millions | |
| Recent Price: 46.75 Smart Investing & Trading Score: 100 | |
| Day Percent Change: 1.08% Day Change: 0.50 | |
| Week Change: 1.59% Year-to-date Change: -6.2% | |
| OZK Links: Profile News Message Board | |
| Charts:- Daily , Weekly | |
| Add OZK to Watchlist: View: Get Complete OZK Trend Analysis ➞ | |
 | TCBI Texas Capital Bancshares, Inc. |
| Sector: Financials | |
| SubSector: Regional - Southwest Banks | |
| MarketCap: 1202.75 Millions | |
| Recent Price: 60.58 Smart Investing & Trading Score: 100 | |
| Day Percent Change: 1.15% Day Change: 0.69 | |
| Week Change: 4.79% Year-to-date Change: -6.3% | |
| TCBI Links: Profile News Message Board | |
| Charts:- Daily , Weekly | |
| Add TCBI to Watchlist: View: Get Complete TCBI Trend Analysis ➞ | |
 | VRTS Virtus Investment Partners, Inc. |
| Sector: Financials | |
| SubSector: Asset Management | |
| MarketCap: 601.303 Millions | |
| Recent Price: 226.60 Smart Investing & Trading Score: 47 | |
| Day Percent Change: 1.49% Day Change: 3.32 | |
| Week Change: -0.43% Year-to-date Change: -6.3% | |
| VRTS Links: Profile News Message Board | |
| Charts:- Daily , Weekly | |
| Add VRTS to Watchlist: View: Get Complete VRTS Trend Analysis ➞ | |
 | SRCE 1st Source Corporation |
| Sector: Financials | |
| SubSector: Regional - Midwest Banks | |
| MarketCap: 784.77 Millions | |
| Recent Price: 51.45 Smart Investing & Trading Score: 95 | |
| Day Percent Change: -0.37% Day Change: -0.19 | |
| Week Change: 4.32% Year-to-date Change: -6.4% | |
| SRCE Links: Profile News Message Board | |
| Charts:- Daily , Weekly | |
| Add SRCE to Watchlist: View: Get Complete SRCE Trend Analysis ➞ | |
| For tabular summary view of above stock list: Summary View ➞ 0 - 25 , 25 - 50 , 50 - 75 , 75 - 100 , 100 - 125 , 125 - 150 , 150 - 175 , 175 - 200 , 200 - 225 , 225 - 250 , 250 - 275 , 275 - 300 , 300 - 325 , 325 - 350 , 350 - 375 , 375 - 400 , 400 - 425 , 425 - 450 , 450 - 475 , 475 - 500 , 500 - 525 , 525 - 550 , 550 - 575 , 575 - 600 , 600 - 625 , 625 - 650 , 650 - 675 , 675 - 700 , 700 - 725 , 725 - 750 , 750 - 775 , 775 - 800 , 800 - 825 , 825 - 850 , 850 - 875 , 875 - 900 , 900 - 925 , 925 - 950 , 950 - 975 , 975 - 1000 , 1000 - 1025 , 1025 - 1050 , 1050 - 1075 , 1075 - 1100 , 1100 - 1125 , 1125 - 1150 , 1150 - 1175 , 1175 - 1200 , 1200 - 1225 , 1225 - 1250 | ||
| Click To Change The Sort Order: By Market Cap or Company Size Performance: Year-to-date, Week and Day | |
| Select Chart Type: | ||
|
Best Stocks Today 12Stocks.com |
© 2024 12Stocks.com Terms & Conditions Privacy Contact Us
All Information Provided Only For Education And Not To Be Used For Investing or Trading. See Terms & Conditions


One More Thing ... Get Best Stocks Delivered Daily!
Never Ever Miss A Move With Our Top Ten Stocks Lists
Find Best Stocks In Any Market - Bull or Bear Market
Take A Peek At Our Top Ten Stocks Lists: Daily, Weekly, Year-to-Date & Top Trends
Find Best Stocks In Any Market - Bull or Bear Market
Take A Peek At Our Top Ten Stocks Lists: Daily, Weekly, Year-to-Date & Top Trends
Financial Stocks With Best Up Trends [0-bearish to 100-bullish]: Siebert [100], Office Properties[100], Banco BBVA[100], AG Mortgage[100], Grupo Financiero[100], Banco Macro[100], Global X[100], Grupo Supervielle[100], Reinsurance [100], Camden Property[100], Noah [100]
Best Financial Stocks Year-to-Date:
Root [436.68%], Banco Macro[109.83%], Hippo [103.4%], Gladstone Capital[100.28%], Grupo Financiero[98.78%], Banco BBVA[92.83%], EverQuote [77.7%], Grupo Supervielle[69.21%], Yiren Digital[66.99%], LendingTree [62.96%], Lufax Holding[53.09%] Best Financial Stocks This Week:
Office Properties[42.79%], LendingTree [30.37%], SelectQuote [26.71%], Heartland [23.01%], Industrial Logistics[20.39%], New York[18.86%], KE [17.8%], Banco Macro[17.21%], Douglas Elliman[16.39%], Siebert [14.85%], eXp World[14.82%] Best Financial Stocks Daily:
Siebert [17.17%], SelectQuote [13.33%], Office Properties[12.11%], Banco BBVA[9.27%], Oportun [9.01%], AG Mortgage[8.85%], Diversified Healthcare[8.26%], RE/MAX [7.68%], Grupo Financiero[7.62%], Banco Macro[7.32%], Xenia Hotels[7.01%]