
 Login Sign Up


| |||||
 |  | ||||

| 12Stocks.com Market Intelligence |
Best Financial Stocks
| In a hurry? Financial Stocks Lists: Performance Trends Table, Stock Charts
Sort Financial stocks: Daily, Weekly, Year-to-Date, Market Cap & Trends. Filter Financial stocks list by size:All Financial Large Mid-Range Small & MicroCap |
| 12Stocks.com Financial Stocks Performances & Trends Daily | |||||||||
|
|  The overall Smart Investing & Trading Score is 53 (0-bearish to 100-bullish) which puts Financial sector in short term neutral trend. The Smart Investing & Trading Score from previous trading session is 36 and hence an improvement of trend.
| ||||||||
Here are the Smart Investing & Trading Scores of the most requested Financial stocks at 12Stocks.com (click stock name for detailed review):
|


| 12Stocks.com: Investing in Financial sector with Stocks | |
|
The following table helps investors and traders sort through current performance and trends (as measured by Smart Investing & Trading Score) of various
stocks in the Financial sector. Quick View: Move mouse or cursor over stock symbol (ticker) to view short-term Technical chart and over stock name to view long term chart. Click on  to add stock symbol to your watchlist and to add stock symbol to your watchlist and  to view watchlist. Click on any ticker or stock name for detailed market intelligence report for that stock. to view watchlist. Click on any ticker or stock name for detailed market intelligence report for that stock. |
12Stocks.com Performance of Stocks in Financial Sector
| Ticker | Stock Name | Watchlist | Category | Recent Price | Smart Investing & Trading Score | Change % | YTD Change% |
| LOB | Live Oak |   | S&L | 35.32 | 32 | 1.47% | -22.37% |
| SMBC | Southern Missouri | | S&L | 41.38 | 57 | 0.17% | -22.49% |
| GSHD | Goosehead Insurance | | Insurance | 58.63 | 45 | -0.71% | -22.65% |
| CIVB | Civista Bancshares | | Regional Banks | 14.22 | 18 | -0.35% | -22.89% |
| MCB | Metropolitan Bank | | Regional Banks | 42.69 | 95 | 0.14% | -22.91% |
| NWFL | Norwood | | Regional Banks | 25.36 | 57 | 0.32% | -22.94% |
| UNIT | Uniti | | REIT - Industrial | 4.44 | 0 | -26.37% | -23.18% |
| FLIC | First of Long Island | | Regional Banks | 10.16 | 52 | 0.99% | -23.26% |
| FCCO | First Community | | Regional - Southwest Banks | 16.50 | 51 | -0.06% | -23.36% |
| CWH | Camping World | | REIT - Office | 20.10 | 17 | -0.15% | -23.46% |
| OZ | Belpointe PREP | | Financials - Development | 59.00 | 17 | -2.60% | -23.49% |
| CLPR | Clipper Realty | | REIT - | 4.13 | 10 | -1.67% | -23.52% |
| HWBK | Hawthorn Bancshares | | Regional Banks | 19.40 | 42 | 1.04% | -23.53% |
| BCBP | BCB Bancorp | | Regional Banks | 9.82 | 67 | 1.34% | -23.58% |
| BBDO | Banco Bradesco | | Foreign Banks | 2.43 | 49 | 2.10% | -23.59% |
| MMI | Marcus & Millichap | | Real Estatet | 33.30 | 64 | 2.27% | -23.76% |
| OPAD | Offerpad | | Financials Services | 7.78 | 60 | 5.85% | -24.15% |
| COLB | Columbia Banking | | S&L | 20.17 | 100 | 2.13% | -24.40% |
| FSP | Franklin Street | | REIT - Office | 1.93 | 42 | 2.12% | -24.61% |
| COLD | Americold Realty | | REIT - Industrial | 22.70 | 42 | 1.34% | -25.01% |
| EXPI | eXp World | | Property Mgmt | 11.62 | 74 | 3.29% | -25.13% |
| HUIZ | Huize Holding | | Insurance | 0.67 | 78 | -11.21% | -25.56% |
| GPMT | Granite Point | | Mortgage | 4.42 | 42 | 2.31% | -25.59% |
| ACNB | ACNB | | Regional - Southwest Banks | 33.24 | 57 | -0.51% | -25.74% |
| PX | P10 | | Asset Mgmt | 7.55 | 53 | 2.58% | -26.13% |
| For chart view version of above stock list: Chart View ➞ 0 - 25 , 25 - 50 , 50 - 75 , 75 - 100 , 100 - 125 , 125 - 150 , 150 - 175 , 175 - 200 , 200 - 225 , 225 - 250 , 250 - 275 , 275 - 300 , 300 - 325 , 325 - 350 , 350 - 375 , 375 - 400 , 400 - 425 , 425 - 450 , 450 - 475 , 475 - 500 , 500 - 525 , 525 - 550 , 550 - 575 , 575 - 600 , 600 - 625 , 625 - 650 , 650 - 675 , 675 - 700 , 700 - 725 , 725 - 750 , 750 - 775 , 775 - 800 , 800 - 825 , 825 - 850 , 850 - 875 , 875 - 900 , 900 - 925 , 925 - 950 , 950 - 975 , 975 - 1000 , 1000 - 1025 , 1025 - 1050 , 1050 - 1075 , 1075 - 1100 , 1100 - 1125 , 1125 - 1150 , 1150 - 1175 , 1175 - 1200 , 1200 - 1225 , 1225 - 1250 | ||
 | Click To Change The Sort Order: By Market Cap or Company Size Performance: Year-to-date, Week and Day |  |
|
Get the most comprehensive stock market coverage daily at 12Stocks.com ➞ Best Stocks Today ➞ Best Stocks Weekly ➞ Best Stocks Year-to-Date ➞ Best Stocks Trends ➞  Best Stocks Today 12Stocks.com Best Nasdaq Stocks ➞ Best S&P 500 Stocks ➞ Best Tech Stocks ➞ Best Biotech Stocks ➞ |
| Detailed Overview of Financial Stocks |
| Financial Technical Overview, Leaders & Laggards, Top Financial ETF Funds & Detailed Financial Stocks List, Charts, Trends & More |
| Financial Sector: Technical Analysis, Trends & YTD Performance | |
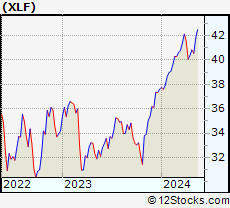
| Financial sector is composed of stocks
from banks, brokers, insurance, REITs
and services subsectors. Financial sector, as represented by XLF, an exchange-traded fund [ETF] that holds basket of Financial stocks (e.g, Bank of America, Goldman Sachs) is up by 7.85% and is currently outperforming the overall market by 0.97% year-to-date. Below is a quick view of Technical charts and trends: |
|
 XLF Weekly Chart |
|
| Long Term Trend: Good | |
| Medium Term Trend: Good | |
 XLF Daily Chart |
|
| Short Term Trend: Very Good | |
| Overall Trend Score: 53 | |
| YTD Performance: 7.85% | |
| **Trend Scores & Views Are Only For Educational Purposes And Not For Investing | |
| 12Stocks.com: Top Performing Financial Sector Stocks | ||||||||||||||||||||||||||||||||||||||||||||||||
 The top performing Financial sector stocks year to date are
Now, more recently, over last week, the top performing Financial sector stocks on the move are


|
||||||||||||||||||||||||||||||||||||||||||||||||
| 12Stocks.com: Investing in Financial Sector using Exchange Traded Funds | |
|
The following table shows list of key exchange traded funds (ETF) that
help investors track Financial Index. For detailed view, check out our ETF Funds section of our website. Quick View: Move mouse or cursor over ETF symbol (ticker) to view short-term Technical chart and over ETF name to view long term chart. Click on ticker or stock name for detailed view. Click on to add stock symbol to your watchlist and to view watchlist. |
12Stocks.com List of ETFs that track Financial Index
| Ticker | ETF Name | Watchlist | Recent Price | Smart Investing & Trading Score | Change % | Week % | Year-to-date % |
| XLF | Financial | | 40.55 | 53 | 0.22 | -0.66 | 7.85% |
| IAI | Broker-Dealers & Secs | | 114.27 | 95 | 0.98 | 1.11 | 5.29% |
| IYF | Financials | | 92.47 | 78 | 0.38 | 0.33 | 8.27% |
| IYG | Financial Services | | 64.09 | 60 | 0.31 | -0.8 | 7.29% |
| KRE | Regional Banking | | 49.65 | 100 | 1.29 | 3.03 | -5.3% |
| IXG | Global Financials | | 84.84 | 85 | 0.87 | 0.77 | 7.97% |
| VFH | Financials | | 98.70 | 73 | 0.34 | -0.23 | 6.98% |
| KBE | Bank | | 46.39 | 100 | 1.16 | 2.34 | 0.8% |
| FAS | Financial Bull 3X | | 98.83 | 60 | 0.95 | -1.79 | 19.58% |
| FAZ | Financial Bear 3X | | 11.08 | 17 | -0.89 | 2.03 | -18.95% |
| UYG | Financials | | 62.79 | 60 | 0.56 | -1.35 | 13.75% |
| IAT | Regional Banks | | 42.29 | 100 | 0.93 | 1.37 | 1.08% |
| KIE | Insurance | | 49.48 | 60 | 0.39 | 1.96 | 9.42% |
| PSCF | SmallCap Financials | | 47.28 | 100 | 0.77 | 1.98 | -3.86% |
| EUFN | Europe Financials | | 22.65 | 85 | 0.24 | 0.82 | 8.04% |
| PGF | Financial Preferred | | 14.85 | 64 | 1.43 | 1.92 | 1.85% |
| 12Stocks.com: Charts, Trends, Fundamental Data and Performances of Financial Stocks | |
|
We now take in-depth look at all Financial stocks including charts, multi-period performances and overall trends (as measured by Smart Investing & Trading Score). One can sort Financial stocks (click link to choose) by Daily, Weekly and by Year-to-Date performances. Also, one can sort by size of the company or by market capitalization. |
| Select Your Default Chart Type: | |||||
| |||||
| Click on stock symbol or name for detailed view. Click on to add stock symbol to your watchlist and to view watchlist. Quick View: Move mouse or cursor over "Daily" to quickly view daily Technical stock chart and over "Weekly" to view weekly Technical stock chart. | |||||

 | LOB Live Oak Bancshares, Inc. |
| Sector: Financials | |
| SubSector: Savings & Loans | |
| MarketCap: 394.23 Millions | |
| Recent Price: 35.32 Smart Investing & Trading Score: 32 | |
| Day Percent Change: 1.47% Day Change: 0.51 | |
| Week Change: 6.45% Year-to-date Change: -22.4% | |
| LOB Links: Profile News Message Board | |
| Charts:- Daily , Weekly | |
| Add LOB to Watchlist: View: Get Complete LOB Trend Analysis ➞ | |
 | SMBC Southern Missouri Bancorp, Inc. |
| Sector: Financials | |
| SubSector: Savings & Loans | |
| MarketCap: 272.53 Millions | |
| Recent Price: 41.38 Smart Investing & Trading Score: 57 | |
| Day Percent Change: 0.17% Day Change: 0.07 | |
| Week Change: 1.07% Year-to-date Change: -22.5% | |
| SMBC Links: Profile News Message Board | |
| Charts:- Daily , Weekly | |
| Add SMBC to Watchlist: View: Get Complete SMBC Trend Analysis ➞ | |
 | GSHD Goosehead Insurance, Inc |
| Sector: Financials | |
| SubSector: Insurance Brokers | |
| MarketCap: 1863.57 Millions | |
| Recent Price: 58.63 Smart Investing & Trading Score: 45 | |
| Day Percent Change: -0.71% Day Change: -0.42 | |
| Week Change: 5.64% Year-to-date Change: -22.7% | |
| GSHD Links: Profile News Message Board | |
| Charts:- Daily , Weekly | |
| Add GSHD to Watchlist: View: Get Complete GSHD Trend Analysis ➞ | |
 | CIVB Civista Bancshares, Inc. |
| Sector: Financials | |
| SubSector: Regional - Pacific Banks | |
| MarketCap: 255.929 Millions | |
| Recent Price: 14.22 Smart Investing & Trading Score: 18 | |
| Day Percent Change: -0.35% Day Change: -0.05 | |
| Week Change: -4.24% Year-to-date Change: -22.9% | |
| CIVB Links: Profile News Message Board | |
| Charts:- Daily , Weekly | |
| Add CIVB to Watchlist: View: Get Complete CIVB Trend Analysis ➞ | |
 | MCB Metropolitan Bank Holding Corp. |
| Sector: Financials | |
| SubSector: Regional - Northeast Banks | |
| MarketCap: 212.999 Millions | |
| Recent Price: 42.69 Smart Investing & Trading Score: 95 | |
| Day Percent Change: 0.14% Day Change: 0.06 | |
| Week Change: 1.33% Year-to-date Change: -22.9% | |
| MCB Links: Profile News Message Board | |
| Charts:- Daily , Weekly | |
| Add MCB to Watchlist: View: Get Complete MCB Trend Analysis ➞ | |
 | NWFL Norwood Financial Corp. |
| Sector: Financials | |
| SubSector: Regional - Northeast Banks | |
| MarketCap: 201.899 Millions | |
| Recent Price: 25.36 Smart Investing & Trading Score: 57 | |
| Day Percent Change: 0.32% Day Change: 0.08 | |
| Week Change: 4.06% Year-to-date Change: -22.9% | |
| NWFL Links: Profile News Message Board | |
| Charts:- Daily , Weekly | |
| Add NWFL to Watchlist: View: Get Complete NWFL Trend Analysis ➞ | |
 | UNIT Uniti Group Inc. |
| Sector: Financials | |
| SubSector: REIT - Industrial | |
| MarketCap: 1363.09 Millions | |
| Recent Price: 4.44 Smart Investing & Trading Score: 0 | |
| Day Percent Change: -26.37% Day Change: -1.59 | |
| Week Change: -23.18% Year-to-date Change: -23.2% | |
| UNIT Links: Profile News Message Board | |
| Charts:- Daily , Weekly | |
| Add UNIT to Watchlist: View: Get Complete UNIT Trend Analysis ➞ | |
 | FLIC The First of Long Island Corporation |
| Sector: Financials | |
| SubSector: Regional - Northeast Banks | |
| MarketCap: 352.899 Millions | |
| Recent Price: 10.16 Smart Investing & Trading Score: 52 | |
| Day Percent Change: 0.99% Day Change: 0.10 | |
| Week Change: -3.24% Year-to-date Change: -23.3% | |
| FLIC Links: Profile News Message Board | |
| Charts:- Daily , Weekly | |
| Add FLIC to Watchlist: View: Get Complete FLIC Trend Analysis ➞ | |
 | FCCO First Community Corporation |
| Sector: Financials | |
| SubSector: Regional - Southwest Banks | |
| MarketCap: 123.865 Millions | |
| Recent Price: 16.50 Smart Investing & Trading Score: 51 | |
| Day Percent Change: -0.06% Day Change: -0.01 | |
| Week Change: -1.61% Year-to-date Change: -23.4% | |
| FCCO Links: Profile News Message Board | |
| Charts:- Daily , Weekly | |
| Add FCCO to Watchlist: View: Get Complete FCCO Trend Analysis ➞ | |
 | CWH Camping World Holdings, Inc. |
| Sector: Financials | |
| SubSector: REIT - Office | |
| MarketCap: 473.566 Millions | |
| Recent Price: 20.10 Smart Investing & Trading Score: 17 | |
| Day Percent Change: -0.15% Day Change: -0.03 | |
| Week Change: -6.29% Year-to-date Change: -23.5% | |
| CWH Links: Profile News Message Board | |
| Charts:- Daily , Weekly | |
| Add CWH to Watchlist: View: Get Complete CWH Trend Analysis ➞ | |
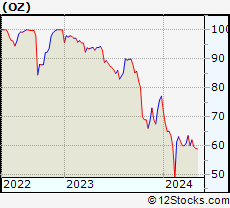 | OZ Belpointe PREP, LLC |
| Sector: Financials | |
| SubSector: Financials - Development | |
| MarketCap: 315 Millions | |
| Recent Price: 59.00 Smart Investing & Trading Score: 17 | |
| Day Percent Change: -2.60% Day Change: -1.57 | |
| Week Change: -1.12% Year-to-date Change: -23.5% | |
| OZ Links: Profile News Message Board | |
| Charts:- Daily , Weekly | |
| Add OZ to Watchlist: View: Get Complete OZ Trend Analysis ➞ | |
 | CLPR Clipper Realty Inc. |
| Sector: Financials | |
| SubSector: REIT - Diversified | |
| MarketCap: 113.253 Millions | |
| Recent Price: 4.13 Smart Investing & Trading Score: 10 | |
| Day Percent Change: -1.67% Day Change: -0.07 | |
| Week Change: 4.03% Year-to-date Change: -23.5% | |
| CLPR Links: Profile News Message Board | |
| Charts:- Daily , Weekly | |
| Add CLPR to Watchlist: View: Get Complete CLPR Trend Analysis ➞ | |
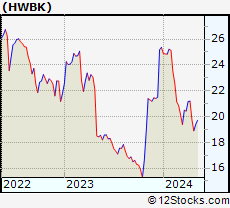 | HWBK Hawthorn Bancshares, Inc. |
| Sector: Financials | |
| SubSector: Regional - Northeast Banks | |
| MarketCap: 129.099 Millions | |
| Recent Price: 19.40 Smart Investing & Trading Score: 42 | |
| Day Percent Change: 1.04% Day Change: 0.20 | |
| Week Change: 2.7% Year-to-date Change: -23.5% | |
| HWBK Links: Profile News Message Board | |
| Charts:- Daily , Weekly | |
| Add HWBK to Watchlist: View: Get Complete HWBK Trend Analysis ➞ | |
 | BCBP BCB Bancorp, Inc. |
| Sector: Financials | |
| SubSector: Regional - Northeast Banks | |
| MarketCap: 196.799 Millions | |
| Recent Price: 9.82 Smart Investing & Trading Score: 67 | |
| Day Percent Change: 1.34% Day Change: 0.13 | |
| Week Change: 3.81% Year-to-date Change: -23.6% | |
| BCBP Links: Profile News Message Board | |
| Charts:- Daily , Weekly | |
| Add BCBP to Watchlist: View: Get Complete BCBP Trend Analysis ➞ | |
 | BBDO Banco Bradesco S.A. |
| Sector: Financials | |
| SubSector: Foreign Regional Banks | |
| MarketCap: 27711.4 Millions | |
| Recent Price: 2.43 Smart Investing & Trading Score: 49 | |
| Day Percent Change: 2.10% Day Change: 0.05 | |
| Week Change: 2.53% Year-to-date Change: -23.6% | |
| BBDO Links: Profile News Message Board | |
| Charts:- Daily , Weekly | |
| Add BBDO to Watchlist: View: Get Complete BBDO Trend Analysis ➞ | |
 | MMI Marcus & Millichap, Inc. |
| Sector: Financials | |
| SubSector: Real Estate Development | |
| MarketCap: 1005.19 Millions | |
| Recent Price: 33.30 Smart Investing & Trading Score: 64 | |
| Day Percent Change: 2.27% Day Change: 0.74 | |
| Week Change: 3.19% Year-to-date Change: -23.8% | |
| MMI Links: Profile News Message Board | |
| Charts:- Daily , Weekly | |
| Add MMI to Watchlist: View: Get Complete MMI Trend Analysis ➞ | |
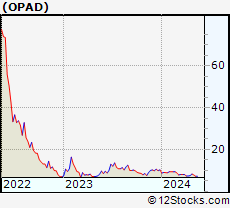 | OPAD Offerpad Solutions Inc. |
| Sector: Financials | |
| SubSector: Financials Services | |
| MarketCap: 345 Millions | |
| Recent Price: 7.78 Smart Investing & Trading Score: 60 | |
| Day Percent Change: 5.85% Day Change: 0.43 | |
| Week Change: -6.21% Year-to-date Change: -24.2% | |
| OPAD Links: Profile News Message Board | |
| Charts:- Daily , Weekly | |
| Add OPAD to Watchlist: View: Get Complete OPAD Trend Analysis ➞ | |
 | COLB Columbia Banking System, Inc. |
| Sector: Financials | |
| SubSector: Savings & Loans | |
| MarketCap: 1868.3 Millions | |
| Recent Price: 20.17 Smart Investing & Trading Score: 100 | |
| Day Percent Change: 2.13% Day Change: 0.42 | |
| Week Change: 5.49% Year-to-date Change: -24.4% | |
| COLB Links: Profile News Message Board | |
| Charts:- Daily , Weekly | |
| Add COLB to Watchlist: View: Get Complete COLB Trend Analysis ➞ | |
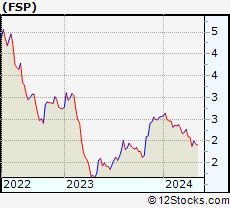 | FSP Franklin Street Properties Corp. |
| Sector: Financials | |
| SubSector: REIT - Office | |
| MarketCap: 636.366 Millions | |
| Recent Price: 1.93 Smart Investing & Trading Score: 42 | |
| Day Percent Change: 2.12% Day Change: 0.04 | |
| Week Change: -3.5% Year-to-date Change: -24.6% | |
| FSP Links: Profile News Message Board | |
| Charts:- Daily , Weekly | |
| Add FSP to Watchlist: View: Get Complete FSP Trend Analysis ➞ | |
 | COLD Americold Realty Trust |
| Sector: Financials | |
| SubSector: REIT - Industrial | |
| MarketCap: 6569.69 Millions | |
| Recent Price: 22.70 Smart Investing & Trading Score: 42 | |
| Day Percent Change: 1.34% Day Change: 0.30 | |
| Week Change: 2.07% Year-to-date Change: -25.0% | |
| COLD Links: Profile News Message Board | |
| Charts:- Daily , Weekly | |
| Add COLD to Watchlist: View: Get Complete COLD Trend Analysis ➞ | |
 | EXPI eXp World Holdings, Inc. |
| Sector: Financials | |
| SubSector: Property Management | |
| MarketCap: 448.042 Millions | |
| Recent Price: 11.62 Smart Investing & Trading Score: 74 | |
| Day Percent Change: 3.29% Day Change: 0.37 | |
| Week Change: 14.82% Year-to-date Change: -25.1% | |
| EXPI Links: Profile News Message Board | |
| Charts:- Daily , Weekly | |
| Add EXPI to Watchlist: View: Get Complete EXPI Trend Analysis ➞ | |
 | HUIZ Huize Holding Limited |
| Sector: Financials | |
| SubSector: Insurance Brokers | |
| MarketCap: 37157 Millions | |
| Recent Price: 0.67 Smart Investing & Trading Score: 78 | |
| Day Percent Change: -11.21% Day Change: -0.08 | |
| Week Change: 8.94% Year-to-date Change: -25.6% | |
| HUIZ Links: Profile News Message Board | |
| Charts:- Daily , Weekly | |
| Add HUIZ to Watchlist: View: Get Complete HUIZ Trend Analysis ➞ | |
 | GPMT Granite Point Mortgage Trust Inc. |
| Sector: Financials | |
| SubSector: Mortgage Investment | |
| MarketCap: 289.739 Millions | |
| Recent Price: 4.42 Smart Investing & Trading Score: 42 | |
| Day Percent Change: 2.31% Day Change: 0.10 | |
| Week Change: 0.68% Year-to-date Change: -25.6% | |
| GPMT Links: Profile News Message Board | |
| Charts:- Daily , Weekly | |
| Add GPMT to Watchlist: View: Get Complete GPMT Trend Analysis ➞ | |
 | ACNB ACNB Corporation |
| Sector: Financials | |
| SubSector: Regional - Southwest Banks | |
| MarketCap: 231.065 Millions | |
| Recent Price: 33.24 Smart Investing & Trading Score: 57 | |
| Day Percent Change: -0.51% Day Change: -0.17 | |
| Week Change: -2.69% Year-to-date Change: -25.7% | |
| ACNB Links: Profile News Message Board | |
| Charts:- Daily , Weekly | |
| Add ACNB to Watchlist: View: Get Complete ACNB Trend Analysis ➞ | |
 | PX P10, Inc. |
| Sector: Financials | |
| SubSector: Asset Management | |
| MarketCap: 1300 Millions | |
| Recent Price: 7.55 Smart Investing & Trading Score: 53 | |
| Day Percent Change: 2.58% Day Change: 0.19 | |
| Week Change: 1.21% Year-to-date Change: -26.1% | |
| PX Links: Profile News Message Board | |
| Charts:- Daily , Weekly | |
| Add PX to Watchlist: View: Get Complete PX Trend Analysis ➞ | |
| For tabular summary view of above stock list: Summary View ➞ 0 - 25 , 25 - 50 , 50 - 75 , 75 - 100 , 100 - 125 , 125 - 150 , 150 - 175 , 175 - 200 , 200 - 225 , 225 - 250 , 250 - 275 , 275 - 300 , 300 - 325 , 325 - 350 , 350 - 375 , 375 - 400 , 400 - 425 , 425 - 450 , 450 - 475 , 475 - 500 , 500 - 525 , 525 - 550 , 550 - 575 , 575 - 600 , 600 - 625 , 625 - 650 , 650 - 675 , 675 - 700 , 700 - 725 , 725 - 750 , 750 - 775 , 775 - 800 , 800 - 825 , 825 - 850 , 850 - 875 , 875 - 900 , 900 - 925 , 925 - 950 , 950 - 975 , 975 - 1000 , 1000 - 1025 , 1025 - 1050 , 1050 - 1075 , 1075 - 1100 , 1100 - 1125 , 1125 - 1150 , 1150 - 1175 , 1175 - 1200 , 1200 - 1225 , 1225 - 1250 | ||
| Click To Change The Sort Order: By Market Cap or Company Size Performance: Year-to-date, Week and Day | |
| Select Chart Type: | ||
|
Best Stocks Today 12Stocks.com |
© 2024 12Stocks.com Terms & Conditions Privacy Contact Us
All Information Provided Only For Education And Not To Be Used For Investing or Trading. See Terms & Conditions


One More Thing ... Get Best Stocks Delivered Daily!
Never Ever Miss A Move With Our Top Ten Stocks Lists
Find Best Stocks In Any Market - Bull or Bear Market
Take A Peek At Our Top Ten Stocks Lists: Daily, Weekly, Year-to-Date & Top Trends
Find Best Stocks In Any Market - Bull or Bear Market
Take A Peek At Our Top Ten Stocks Lists: Daily, Weekly, Year-to-Date & Top Trends
Financial Stocks With Best Up Trends [0-bearish to 100-bullish]: Siebert [100], Office Properties[100], Banco BBVA[100], AG Mortgage[100], Grupo Financiero[100], Banco Macro[100], Global X[100], Grupo Supervielle[100], Reinsurance [100], Camden Property[100], Noah [100]
Best Financial Stocks Year-to-Date:
Root [436.68%], Banco Macro[109.83%], Hippo [103.4%], Gladstone Capital[100.28%], Grupo Financiero[98.78%], Banco BBVA[92.83%], EverQuote [77.7%], Grupo Supervielle[69.21%], Yiren Digital[66.99%], LendingTree [62.96%], Lufax Holding[53.09%] Best Financial Stocks This Week:
Office Properties[42.79%], LendingTree [30.37%], SelectQuote [26.71%], Heartland [23.01%], Industrial Logistics[20.39%], New York[18.86%], KE [17.8%], Banco Macro[17.21%], Douglas Elliman[16.39%], Siebert [14.85%], eXp World[14.82%] Best Financial Stocks Daily:
Siebert [17.17%], SelectQuote [13.33%], Office Properties[12.11%], Banco BBVA[9.27%], Oportun [9.01%], AG Mortgage[8.85%], Diversified Healthcare[8.26%], RE/MAX [7.68%], Grupo Financiero[7.62%], Banco Macro[7.32%], Xenia Hotels[7.01%]