
 Login Sign Up


| |||||
 |  | ||||

| 12Stocks.com Market Intelligence |
Best Financial Stocks
| In a hurry? Financial Stocks Lists: Performance Trends Table, Stock Charts
Sort Financial stocks: Daily, Weekly, Year-to-Date, Market Cap & Trends. Filter Financial stocks list by size:All Financial Large Mid-Range Small & MicroCap |
| 12Stocks.com Financial Stocks Performances & Trends Daily | |||||||||
|
|  The overall Smart Investing & Trading Score is 70 (0-bearish to 100-bullish) which puts Financial sector in short term neutral to bullish trend. The Smart Investing & Trading Score from previous trading session is 63 and hence an improvement of trend.
| ||||||||
Here are the Smart Investing & Trading Scores of the most requested Financial stocks at 12Stocks.com (click stock name for detailed review):
|


| 12Stocks.com: Investing in Financial sector with Stocks | |
|
The following table helps investors and traders sort through current performance and trends (as measured by Smart Investing & Trading Score) of various
stocks in the Financial sector. Quick View: Move mouse or cursor over stock symbol (ticker) to view short-term Technical chart and over stock name to view long term chart. Click on  to add stock symbol to your watchlist and to add stock symbol to your watchlist and  to view watchlist. Click on any ticker or stock name for detailed market intelligence report for that stock. to view watchlist. Click on any ticker or stock name for detailed market intelligence report for that stock. |
12Stocks.com Performance of Stocks in Financial Sector
| Ticker | Stock Name | Watchlist | Category | Recent Price | Smart Investing & Trading Score | Change % | YTD Change% |
| CASH | Meta |   | S&L | 51.56 | 75 | -1.11 | -2.59% |
| ARI | Apollo Commercial | | Mortgage | 10.68 | 49 | -1.11 | -9.03% |
| ITUB | Itau Unibanco | | Foreign Banks | 6.23 | 42 | -1.11 | -10.36% |
| ATLCP | Atlanticus | | Credit Services | 22.21 | 46 | -1.11 | -2.20% |
| CBSH | Commerce Bancshares | | Regional Banks | 54.79 | 75 | -1.12 | 2.58% |
| LBAI | Lakeland Bancorp | | Regional Banks | 12.38 | 42 | -1.12 | -16.29% |
| SSB | South State | | Regional Banks | 77.08 | 0 | -1.12 | -8.73% |
| CHCO | City Holding | | Regional Banks | 102.92 | 68 | -1.14 | -6.66% |
| SHBI | Shore Bancshares | | Regional Banks | 10.41 | 47 | -1.14 | -26.95% |
| PNFP | Pinnacle | | Regional Banks | 79.37 | 25 | -1.15 | -9.00% |
| MA | Mastercard | | Credit Services | 457.10 | 26 | -1.15 | 7.17% |
| NAVI | Navient | | Credit Services | 15.54 | 7 | -1.15 | -16.54% |
| DHIL | Diamond Hill | | Asset Mgmt | 149.72 | 54 | -1.17 | -9.58% |
| APO | Apollo Global | | Investments | 110.91 | 48 | -1.17 | 19.01% |
| CITE | Cartica Acquisition | | SPAC | 11.02 | 86 | -1.17 | 1.01% |
| FCF | First Commonwealth | | Regional Banks | 13.39 | 42 | -1.18 | -13.28% |
| WAFD | Washington Federal | | S&L | 27.58 | 42 | -1.18 | -16.32% |
| YRD | Yiren Digital | | Credit Services | 5.02 | 44 | -1.18 | 60.90% |
| PFS | Provident | | S&L | 14.91 | 42 | -1.19 | -17.30% |
| ARL | American Realty | | Property Mgmt | 14.15 | 35 | -1.19 | -18.72% |
| SMMF | Summit | | Regional Banks | 27.12 | 49 | -1.20 | -11.63% |
| ESSA | ESSA Bancorp | | S&L | 16.40 | 35 | -1.20 | -18.08% |
| LKFN | Lakeland | | Regional Banks | 59.04 | 35 | -1.22 | -9.39% |
| BUSE | First Busey | | Regional Banks | 22.52 | 42 | -1.23 | -9.27% |
| FINV | FinVolution | | Credit Services | 4.83 | 51 | -1.23 | -1.43% |
| For chart view version of above stock list: Chart View ➞ 0 - 25 , 25 - 50 , 50 - 75 , 75 - 100 , 100 - 125 , 125 - 150 , 150 - 175 , 175 - 200 , 200 - 225 , 225 - 250 , 250 - 275 , 275 - 300 , 300 - 325 , 325 - 350 , 350 - 375 , 375 - 400 , 400 - 425 , 425 - 450 , 450 - 475 , 475 - 500 , 500 - 525 , 525 - 550 , 550 - 575 , 575 - 600 , 600 - 625 , 625 - 650 , 650 - 675 , 675 - 700 , 700 - 725 , 725 - 750 , 750 - 775 , 775 - 800 , 800 - 825 , 825 - 850 , 850 - 875 , 875 - 900 , 900 - 925 , 925 - 950 , 950 - 975 , 975 - 1000 , 1000 - 1025 , 1025 - 1050 , 1050 - 1075 , 1075 - 1100 , 1100 - 1125 , 1125 - 1150 , 1150 - 1175 , 1175 - 1200 , 1200 - 1225 , 1225 - 1250 | ||
 | Click To Change The Sort Order: By Market Cap or Company Size Performance: Year-to-date, Week and Day |  |
|
Get the most comprehensive stock market coverage daily at 12Stocks.com ➞ Best Stocks Today ➞ Best Stocks Weekly ➞ Best Stocks Year-to-Date ➞ Best Stocks Trends ➞  Best Stocks Today 12Stocks.com Best Nasdaq Stocks ➞ Best S&P 500 Stocks ➞ Best Tech Stocks ➞ Best Biotech Stocks ➞ |
| Detailed Overview of Financial Stocks |
| Financial Technical Overview, Leaders & Laggards, Top Financial ETF Funds & Detailed Financial Stocks List, Charts, Trends & More |
| Financial Sector: Technical Analysis, Trends & YTD Performance | |
| Financial sector is composed of stocks
from banks, brokers, insurance, REITs
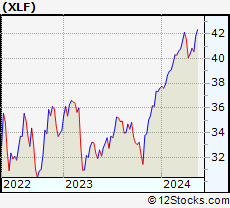
and services subsectors. Financial sector, as represented by XLF, an exchange-traded fund [ETF] that holds basket of Financial stocks (e.g, Bank of America, Goldman Sachs) is up by 8.4% and is currently outperforming the overall market by 1.84% year-to-date. Below is a quick view of Technical charts and trends: |
|
 XLF Weekly Chart |
|
| Long Term Trend: Very Good | |
| Medium Term Trend: Good | |
 XLF Daily Chart |
|
| Short Term Trend: Deteriorating | |
| Overall Trend Score: 70 | |
| YTD Performance: 8.4% | |
| **Trend Scores & Views Are Only For Educational Purposes And Not For Investing | |
| 12Stocks.com: Top Performing Financial Sector Stocks | ||||||||||||||||||||||||||||||||||||||||||||||||
 The top performing Financial sector stocks year to date are
Now, more recently, over last week, the top performing Financial sector stocks on the move are


|
||||||||||||||||||||||||||||||||||||||||||||||||
| 12Stocks.com: Investing in Financial Sector using Exchange Traded Funds | |
|
The following table shows list of key exchange traded funds (ETF) that
help investors track Financial Index. For detailed view, check out our ETF Funds section of our website. Quick View: Move mouse or cursor over ETF symbol (ticker) to view short-term Technical chart and over ETF name to view long term chart. Click on ticker or stock name for detailed view. Click on to add stock symbol to your watchlist and to view watchlist. |
12Stocks.com List of ETFs that track Financial Index
| Ticker | ETF Name | Watchlist | Recent Price | Smart Investing & Trading Score | Change % | Week % | Year-to-date % |
| XLF | Financial | | 40.76 | 70 | -0.15 | -0.15 | 8.4% |
| IAI | Broker-Dealers & Secs | | 112.90 | 83 | -0.10 | -0.1 | 4.03% |
| IYF | Financials | | 92.16 | 83 | -0.01 | -0.01 | 7.9% |
| IYG | Financial Services | | 64.34 | 83 | -0.42 | -0.42 | 7.71% |
| KRE | Regional Banking | | 47.77 | 54 | -0.87 | -0.87 | -8.89% |
| IXG | Global Financials | | 84.35 | 83 | 0.19 | 0.19 | 7.34% |
| VFH | Financials | | 98.74 | 83 | -0.19 | -0.19 | 7.02% |
| KBE | Bank | | 45.10 | 68 | -0.51 | -0.51 | -2% |
| FAS | Financial Bull 3X | | 100.33 | 58 | -0.30 | -0.3 | 21.39% |
| FAZ | Financial Bear 3X | | 10.93 | 42 | 0.64 | 0.64 | -20.04% |
| UYG | Financials | | 63.40 | 53 | -0.39 | -0.39 | 14.86% |
| IAT | Regional Banks | | 41.57 | 73 | -0.36 | -0.36 | -0.65% |
| KIE | Insurance | | 48.79 | 58 | 0.54 | 0.54 | 7.89% |
| PSCF | SmallCap Financials | | 46.33 | 47 | -0.06 | -0.06 | -5.79% |
| EUFN | Europe Financials | | 22.50 | 83 | 0.18 | 0.18 | 7.35% |
| PGF | Financial Preferred | | 14.64 | 39 | 0.48 | 0.48 | 0.41% |
| 12Stocks.com: Charts, Trends, Fundamental Data and Performances of Financial Stocks | |
|
We now take in-depth look at all Financial stocks including charts, multi-period performances and overall trends (as measured by Smart Investing & Trading Score). One can sort Financial stocks (click link to choose) by Daily, Weekly and by Year-to-Date performances. Also, one can sort by size of the company or by market capitalization. |
| Select Your Default Chart Type: | |||||
| |||||
| Click on stock symbol or name for detailed view. Click on to add stock symbol to your watchlist and to view watchlist. Quick View: Move mouse or cursor over "Daily" to quickly view daily Technical stock chart and over "Weekly" to view weekly Technical stock chart. | |||||

 | CASH Meta Financial Group, Inc. |
| Sector: Financials | |
| SubSector: Savings & Loans | |
| MarketCap: 849.33 Millions | |
| Recent Price: 51.56 Smart Investing & Trading Score: 75 | |
| Day Percent Change: -1.11% Day Change: -0.58 | |
| Week Change: -1.11% Year-to-date Change: -2.6% | |
| CASH Links: Profile News Message Board | |
| Charts:- Daily , Weekly | |
| Add CASH to Watchlist: View: Get Complete CASH Trend Analysis ➞ | |
 | ARI Apollo Commercial Real Estate Finance, Inc. |
| Sector: Financials | |
| SubSector: Mortgage Investment | |
| MarketCap: 1302.19 Millions | |
| Recent Price: 10.68 Smart Investing & Trading Score: 49 | |
| Day Percent Change: -1.11% Day Change: -0.12 | |
| Week Change: -1.11% Year-to-date Change: -9.0% | |
| ARI Links: Profile News Message Board | |
| Charts:- Daily , Weekly | |
| Add ARI to Watchlist: View: Get Complete ARI Trend Analysis ➞ | |
 | ITUB Itau Unibanco Holding S.A. |
| Sector: Financials | |
| SubSector: Foreign Regional Banks | |
| MarketCap: 48121 Millions | |
| Recent Price: 6.23 Smart Investing & Trading Score: 42 | |
| Day Percent Change: -1.11% Day Change: -0.07 | |
| Week Change: -1.11% Year-to-date Change: -10.4% | |
| ITUB Links: Profile News Message Board | |
| Charts:- Daily , Weekly | |
| Add ITUB to Watchlist: View: Get Complete ITUB Trend Analysis ➞ | |
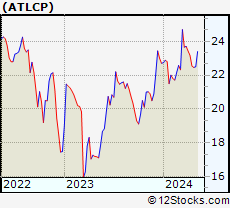 | ATLCP Atlanticus Holdings Corporation |
| Sector: Financials | |
| SubSector: Credit Services | |
| MarketCap: 608 Millions | |
| Recent Price: 22.21 Smart Investing & Trading Score: 46 | |
| Day Percent Change: -1.11% Day Change: -0.25 | |
| Week Change: -1.11% Year-to-date Change: -2.2% | |
| ATLCP Links: Profile News Message Board | |
| Charts:- Daily , Weekly | |
| Add ATLCP to Watchlist: View: Get Complete ATLCP Trend Analysis ➞ | |
 | CBSH Commerce Bancshares, Inc. |
| Sector: Financials | |
| SubSector: Regional - Midwest Banks | |
| MarketCap: 6201.5 Millions | |
| Recent Price: 54.79 Smart Investing & Trading Score: 75 | |
| Day Percent Change: -1.12% Day Change: -0.62 | |
| Week Change: -1.12% Year-to-date Change: 2.6% | |
| CBSH Links: Profile News Message Board | |
| Charts:- Daily , Weekly | |
| Add CBSH to Watchlist: View: Get Complete CBSH Trend Analysis ➞ | |
 | LBAI Lakeland Bancorp, Inc. |
| Sector: Financials | |
| SubSector: Regional - Northeast Banks | |
| MarketCap: 534.599 Millions | |
| Recent Price: 12.38 Smart Investing & Trading Score: 42 | |
| Day Percent Change: -1.12% Day Change: -0.14 | |
| Week Change: -1.12% Year-to-date Change: -16.3% | |
| LBAI Links: Profile News Message Board | |
| Charts:- Daily , Weekly | |
| Add LBAI to Watchlist: View: Get Complete LBAI Trend Analysis ➞ | |
 | SSB South State Corporation |
| Sector: Financials | |
| SubSector: Regional - Mid-Atlantic Banks | |
| MarketCap: 2113.49 Millions | |
| Recent Price: 77.08 Smart Investing & Trading Score: 0 | |
| Day Percent Change: -1.12% Day Change: -0.87 | |
| Week Change: -1.12% Year-to-date Change: -8.7% | |
| SSB Links: Profile News Message Board | |
| Charts:- Daily , Weekly | |
| Add SSB to Watchlist: View: Get Complete SSB Trend Analysis ➞ | |
 | CHCO City Holding Company |
| Sector: Financials | |
| SubSector: Regional - Mid-Atlantic Banks | |
| MarketCap: 1059.59 Millions | |
| Recent Price: 102.92 Smart Investing & Trading Score: 68 | |
| Day Percent Change: -1.14% Day Change: -1.19 | |
| Week Change: -1.14% Year-to-date Change: -6.7% | |
| CHCO Links: Profile News Message Board | |
| Charts:- Daily , Weekly | |
| Add CHCO to Watchlist: View: Get Complete CHCO Trend Analysis ➞ | |
 | SHBI Shore Bancshares, Inc. |
| Sector: Financials | |
| SubSector: Regional - Mid-Atlantic Banks | |
| MarketCap: 131.359 Millions | |
| Recent Price: 10.41 Smart Investing & Trading Score: 47 | |
| Day Percent Change: -1.14% Day Change: -0.12 | |
| Week Change: -1.14% Year-to-date Change: -27.0% | |
| SHBI Links: Profile News Message Board | |
| Charts:- Daily , Weekly | |
| Add SHBI to Watchlist: View: Get Complete SHBI Trend Analysis ➞ | |
 | PNFP Pinnacle Financial Partners, Inc. |
| Sector: Financials | |
| SubSector: Regional - Southeast Banks | |
| MarketCap: 2771.75 Millions | |
| Recent Price: 79.37 Smart Investing & Trading Score: 25 | |
| Day Percent Change: -1.15% Day Change: -0.92 | |
| Week Change: -1.15% Year-to-date Change: -9.0% | |
| PNFP Links: Profile News Message Board | |
| Charts:- Daily , Weekly | |
| Add PNFP to Watchlist: View: Get Complete PNFP Trend Analysis ➞ | |
 | MA Mastercard Incorporated |
| Sector: Financials | |
| SubSector: Credit Services | |
| MarketCap: 234809 Millions | |
| Recent Price: 457.10 Smart Investing & Trading Score: 26 | |
| Day Percent Change: -1.15% Day Change: -5.32 | |
| Week Change: -1.15% Year-to-date Change: 7.2% | |
| MA Links: Profile News Message Board | |
| Charts:- Daily , Weekly | |
| Add MA to Watchlist: View: Get Complete MA Trend Analysis ➞ | |
 | NAVI Navient Corporation |
| Sector: Financials | |
| SubSector: Credit Services | |
| MarketCap: 1362.48 Millions | |
| Recent Price: 15.54 Smart Investing & Trading Score: 7 | |
| Day Percent Change: -1.15% Day Change: -0.18 | |
| Week Change: -1.15% Year-to-date Change: -16.5% | |
| NAVI Links: Profile News Message Board | |
| Charts:- Daily , Weekly | |
| Add NAVI to Watchlist: View: Get Complete NAVI Trend Analysis ➞ | |
 | DHIL Diamond Hill Investment Group, Inc. |
| Sector: Financials | |
| SubSector: Asset Management | |
| MarketCap: 316.203 Millions | |
| Recent Price: 149.72 Smart Investing & Trading Score: 54 | |
| Day Percent Change: -1.17% Day Change: -1.77 | |
| Week Change: -1.17% Year-to-date Change: -9.6% | |
| DHIL Links: Profile News Message Board | |
| Charts:- Daily , Weekly | |
| Add DHIL to Watchlist: View: Get Complete DHIL Trend Analysis ➞ | |
 | APO Apollo Global Management, Inc. |
| Sector: Financials | |
| SubSector: Diversified Investments | |
| MarketCap: 12706 Millions | |
| Recent Price: 110.91 Smart Investing & Trading Score: 48 | |
| Day Percent Change: -1.17% Day Change: -1.31 | |
| Week Change: -1.17% Year-to-date Change: 19.0% | |
| APO Links: Profile News Message Board | |
| Charts:- Daily , Weekly | |
| Add APO to Watchlist: View: Get Complete APO Trend Analysis ➞ | |
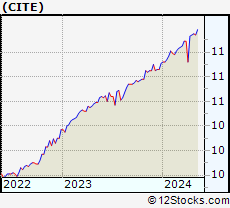 | CITE Cartica Acquisition Corp |
| Sector: Financials | |
| SubSector: SPAC | |
| MarketCap: 308 Millions | |
| Recent Price: 11.02 Smart Investing & Trading Score: 86 | |
| Day Percent Change: -1.17% Day Change: -0.13 | |
| Week Change: -1.17% Year-to-date Change: 1.0% | |
| CITE Links: Profile News Message Board | |
| Charts:- Daily , Weekly | |
| Add CITE to Watchlist: View: Get Complete CITE Trend Analysis ➞ | |
 | FCF First Commonwealth Financial Corporation |
| Sector: Financials | |
| SubSector: Regional - Northeast Banks | |
| MarketCap: 900.299 Millions | |
| Recent Price: 13.39 Smart Investing & Trading Score: 42 | |
| Day Percent Change: -1.18% Day Change: -0.16 | |
| Week Change: -1.18% Year-to-date Change: -13.3% | |
| FCF Links: Profile News Message Board | |
| Charts:- Daily , Weekly | |
| Add FCF to Watchlist: View: Get Complete FCF Trend Analysis ➞ | |
 | WAFD Washington Federal, Inc. |
| Sector: Financials | |
| SubSector: Savings & Loans | |
| MarketCap: 2219.2 Millions | |
| Recent Price: 27.58 Smart Investing & Trading Score: 42 | |
| Day Percent Change: -1.18% Day Change: -0.33 | |
| Week Change: -1.18% Year-to-date Change: -16.3% | |
| WAFD Links: Profile News Message Board | |
| Charts:- Daily , Weekly | |
| Add WAFD to Watchlist: View: Get Complete WAFD Trend Analysis ➞ | |
 | YRD Yiren Digital Ltd. |
| Sector: Financials | |
| SubSector: Credit Services | |
| MarketCap: 330.208 Millions | |
| Recent Price: 5.02 Smart Investing & Trading Score: 44 | |
| Day Percent Change: -1.18% Day Change: -0.06 | |
| Week Change: -1.18% Year-to-date Change: 60.9% | |
| YRD Links: Profile News Message Board | |
| Charts:- Daily , Weekly | |
| Add YRD to Watchlist: View: Get Complete YRD Trend Analysis ➞ | |
 | PFS Provident Financial Services, Inc. |
| Sector: Financials | |
| SubSector: Savings & Loans | |
| MarketCap: 829.73 Millions | |
| Recent Price: 14.91 Smart Investing & Trading Score: 42 | |
| Day Percent Change: -1.19% Day Change: -0.18 | |
| Week Change: -1.19% Year-to-date Change: -17.3% | |
| PFS Links: Profile News Message Board | |
| Charts:- Daily , Weekly | |
| Add PFS to Watchlist: View: Get Complete PFS Trend Analysis ➞ | |
 | ARL American Realty Investors, Inc. |
| Sector: Financials | |
| SubSector: Property Management | |
| MarketCap: 132.242 Millions | |
| Recent Price: 14.15 Smart Investing & Trading Score: 35 | |
| Day Percent Change: -1.19% Day Change: -0.17 | |
| Week Change: -1.19% Year-to-date Change: -18.7% | |
| ARL Links: Profile News Message Board | |
| Charts:- Daily , Weekly | |
| Add ARL to Watchlist: View: Get Complete ARL Trend Analysis ➞ | |
 | SMMF Summit Financial Group, Inc. |
| Sector: Financials | |
| SubSector: Regional - Mid-Atlantic Banks | |
| MarketCap: 228.959 Millions | |
| Recent Price: 27.12 Smart Investing & Trading Score: 49 | |
| Day Percent Change: -1.20% Day Change: -0.33 | |
| Week Change: -1.2% Year-to-date Change: -11.6% | |
| SMMF Links: Profile News Message Board | |
| Charts:- Daily , Weekly | |
| Add SMMF to Watchlist: View: Get Complete SMMF Trend Analysis ➞ | |
 | ESSA ESSA Bancorp, Inc. |
| Sector: Financials | |
| SubSector: Savings & Loans | |
| MarketCap: 171.33 Millions | |
| Recent Price: 16.40 Smart Investing & Trading Score: 35 | |
| Day Percent Change: -1.20% Day Change: -0.20 | |
| Week Change: -1.2% Year-to-date Change: -18.1% | |
| ESSA Links: Profile News Message Board | |
| Charts:- Daily , Weekly | |
| Add ESSA to Watchlist: View: Get Complete ESSA Trend Analysis ➞ | |
 | LKFN Lakeland Financial Corporation |
| Sector: Financials | |
| SubSector: Regional - Midwest Banks | |
| MarketCap: 903.27 Millions | |
| Recent Price: 59.04 Smart Investing & Trading Score: 35 | |
| Day Percent Change: -1.22% Day Change: -0.73 | |
| Week Change: -1.22% Year-to-date Change: -9.4% | |
| LKFN Links: Profile News Message Board | |
| Charts:- Daily , Weekly | |
| Add LKFN to Watchlist: View: Get Complete LKFN Trend Analysis ➞ | |
 | BUSE First Busey Corporation |
| Sector: Financials | |
| SubSector: Regional - Midwest Banks | |
| MarketCap: 876.97 Millions | |
| Recent Price: 22.52 Smart Investing & Trading Score: 42 | |
| Day Percent Change: -1.23% Day Change: -0.28 | |
| Week Change: -1.23% Year-to-date Change: -9.3% | |
| BUSE Links: Profile News Message Board | |
| Charts:- Daily , Weekly | |
| Add BUSE to Watchlist: View: Get Complete BUSE Trend Analysis ➞ | |
 | FINV FinVolution Group |
| Sector: Financials | |
| SubSector: Credit Services | |
| MarketCap: 476.208 Millions | |
| Recent Price: 4.83 Smart Investing & Trading Score: 51 | |
| Day Percent Change: -1.23% Day Change: -0.06 | |
| Week Change: -1.23% Year-to-date Change: -1.4% | |
| FINV Links: Profile News Message Board | |
| Charts:- Daily , Weekly | |
| Add FINV to Watchlist: View: Get Complete FINV Trend Analysis ➞ | |
| For tabular summary view of above stock list: Summary View ➞ 0 - 25 , 25 - 50 , 50 - 75 , 75 - 100 , 100 - 125 , 125 - 150 , 150 - 175 , 175 - 200 , 200 - 225 , 225 - 250 , 250 - 275 , 275 - 300 , 300 - 325 , 325 - 350 , 350 - 375 , 375 - 400 , 400 - 425 , 425 - 450 , 450 - 475 , 475 - 500 , 500 - 525 , 525 - 550 , 550 - 575 , 575 - 600 , 600 - 625 , 625 - 650 , 650 - 675 , 675 - 700 , 700 - 725 , 725 - 750 , 750 - 775 , 775 - 800 , 800 - 825 , 825 - 850 , 850 - 875 , 875 - 900 , 900 - 925 , 925 - 950 , 950 - 975 , 975 - 1000 , 1000 - 1025 , 1025 - 1050 , 1050 - 1075 , 1075 - 1100 , 1100 - 1125 , 1125 - 1150 , 1150 - 1175 , 1175 - 1200 , 1200 - 1225 , 1225 - 1250 | ||
| Click To Change The Sort Order: By Market Cap or Company Size Performance: Year-to-date, Week and Day | |
| Select Chart Type: | ||
|
Best Stocks Today 12Stocks.com |
© 2024 12Stocks.com Terms & Conditions Privacy Contact Us
All Information Provided Only For Education And Not To Be Used For Investing or Trading. See Terms & Conditions


One More Thing ... Get Best Stocks Delivered Daily!
Never Ever Miss A Move With Our Top Ten Stocks Lists
Find Best Stocks In Any Market - Bull or Bear Market
Take A Peek At Our Top Ten Stocks Lists: Daily, Weekly, Year-to-Date & Top Trends
Find Best Stocks In Any Market - Bull or Bear Market
Take A Peek At Our Top Ten Stocks Lists: Daily, Weekly, Year-to-Date & Top Trends
Financial Stocks With Best Up Trends [0-bearish to 100-bullish]: Heartland [100], Fulton [100], B. Riley[100], ICICI Bank[100], Piedmont Office[100], Douglas Emmett[100], BrasilAgro -[100], LPL [100], Highwoods Properties[100], TCG BDC[100], Stifel [100]
Best Financial Stocks Year-to-Date:
Root [537.25%], Hippo [140.94%], Gladstone Capital[102.66%], Banco Macro[85.19%], B. Riley[84.04%], Grupo Financiero[81.15%], Banco BBVA[71.21%], Yiren Digital[60.9%], EverQuote [59.97%], Fidelis Insurance[58.53%], Heritage Insurance[57.52%] Best Financial Stocks This Week:
Heartland [15.24%], AltC Acquisition[12.57%], Douglas Elliman[10.92%], Fulton [7.62%], Medical Properties[5.99%], Clipper Realty[5.54%], Huize Holding[5.53%], Oportun [5.08%], B. Riley[4.92%], Citizens [4.81%], AlTi Global[4.43%] Best Financial Stocks Daily:
Heartland [15.24%], AltC Acquisition[12.57%], Douglas Elliman[10.92%], Fulton [7.62%], Medical Properties[5.99%], Clipper Realty[5.54%], Huize Holding[5.53%], Oportun [5.08%], B. Riley[4.92%], Citizens [4.81%], AlTi Global[4.43%]