
 Login Sign Up


| |||||
 |  | ||||

| 12Stocks.com Market Intelligence |
Best Financial Stocks
| In a hurry? Financial Stocks Lists: Performance Trends Table, Stock Charts
Sort Financial stocks: Daily, Weekly, Year-to-Date, Market Cap & Trends. Filter Financial stocks list by size:All Financial Large Mid-Range Small & MicroCap |
| 12Stocks.com Financial Stocks Performances & Trends Daily | |||||||||
|
|  The overall Smart Investing & Trading Score is 70 (0-bearish to 100-bullish) which puts Financial sector in short term neutral to bullish trend. The Smart Investing & Trading Score from previous trading session is 63 and hence an improvement of trend.
| ||||||||
Here are the Smart Investing & Trading Scores of the most requested Financial stocks at 12Stocks.com (click stock name for detailed review):
|


| 12Stocks.com: Investing in Financial sector with Stocks | |
|
The following table helps investors and traders sort through current performance and trends (as measured by Smart Investing & Trading Score) of various
stocks in the Financial sector. Quick View: Move mouse or cursor over stock symbol (ticker) to view short-term Technical chart and over stock name to view long term chart. Click on  to add stock symbol to your watchlist and to add stock symbol to your watchlist and  to view watchlist. Click on any ticker or stock name for detailed market intelligence report for that stock. to view watchlist. Click on any ticker or stock name for detailed market intelligence report for that stock. |
12Stocks.com Performance of Stocks in Financial Sector
| Ticker | Stock Name | Watchlist | Category | Recent Price | Smart Investing & Trading Score | Change % | YTD Change% |
| PFIS | Peoples |   | Regional Banks | 37.99 | 67 | -0.76 | -21.99% |
| PRK | Park National | | Regional Banks | 133.29 | 68 | -0.77 | 0.32% |
| GDOT | Green Dot | | Credit Services | 8.97 | 50 | -0.77 | -9.39% |
| MS | Morgan Stanley | | Brokerage | 92.11 | 68 | -0.78 | -1.22% |
| COLB | Columbia Banking | | S&L | 18.97 | 42 | -0.78 | -28.90% |
| FSBC | Five Star | | Banks - Regional | 21.58 | 45 | -0.78 | -17.57% |
| FMNB | Farmers National | | Regional Banks | 11.98 | 25 | -0.79 | -17.13% |
| AMG | Affiliated Managers | | Asset Mgmt | 158.92 | 46 | -0.80 | 4.95% |
| FISI | Institutions | | Regional Banks | 17.46 | 67 | -0.80 | -18.03% |
| BWFG | Bankwell | | Regional Banks | 23.65 | 17 | -0.80 | -21.64% |
| AMH | American Homes | | REIT | 36.11 | 100 | -0.82 | 0.42% |
| GABC | German American | | Regional Banks | 31.98 | 32 | -0.82 | -1.31% |
| LADR | Ladder Capital | | Mortgage | 10.91 | 100 | -0.82 | -5.21% |
| WTFC | Wintrust | | Regional Banks | 98.19 | 68 | -0.83 | 5.87% |
| GCBC | Greene County | | S&L | 29.74 | 90 | -0.83 | 5.46% |
| FSV | FirstService | | Property Mgmt | 148.55 | 10 | -0.83 | -8.35% |
| WDH | Waterdrop | | Insurance - | 1.19 | 59 | -0.83 | 13.66% |
| CAC | Camden National | | Regional Banks | 30.24 | 60 | -0.85 | -19.64% |
| CVLY | Codorus Valley | | Regional Banks | 22.28 | 74 | -0.85 | -13.31% |
| CATY | Cathay General | | Regional Banks | 34.74 | 42 | -0.86 | -22.06% |
| PEBO | Peoples Bancorp | | Regional Banks | 29.50 | 75 | -0.87 | -12.62% |
| FRME | First Merchants | | Regional Banks | 33.83 | 73 | -0.88 | -8.76% |
| CM | Canadian Imperial | | Banks | 47.40 | 56 | -0.88 | -1.54% |
| CIVB | Civista Bancshares | | Regional Banks | 14.72 | 35 | -0.88 | -20.17% |
| ERIE | Erie Indemnity | | Insurance | 378.34 | 51 | -0.89 | 12.96% |
| For chart view version of above stock list: Chart View ➞ 0 - 25 , 25 - 50 , 50 - 75 , 75 - 100 , 100 - 125 , 125 - 150 , 150 - 175 , 175 - 200 , 200 - 225 , 225 - 250 , 250 - 275 , 275 - 300 , 300 - 325 , 325 - 350 , 350 - 375 , 375 - 400 , 400 - 425 , 425 - 450 , 450 - 475 , 475 - 500 , 500 - 525 , 525 - 550 , 550 - 575 , 575 - 600 , 600 - 625 , 625 - 650 , 650 - 675 , 675 - 700 , 700 - 725 , 725 - 750 , 750 - 775 , 775 - 800 , 800 - 825 , 825 - 850 , 850 - 875 , 875 - 900 , 900 - 925 , 925 - 950 , 950 - 975 , 975 - 1000 , 1000 - 1025 , 1025 - 1050 , 1050 - 1075 , 1075 - 1100 , 1100 - 1125 , 1125 - 1150 , 1150 - 1175 , 1175 - 1200 , 1200 - 1225 , 1225 - 1250 | ||
 | Click To Change The Sort Order: By Market Cap or Company Size Performance: Year-to-date, Week and Day |  |
|
Get the most comprehensive stock market coverage daily at 12Stocks.com ➞ Best Stocks Today ➞ Best Stocks Weekly ➞ Best Stocks Year-to-Date ➞ Best Stocks Trends ➞  Best Stocks Today 12Stocks.com Best Nasdaq Stocks ➞ Best S&P 500 Stocks ➞ Best Tech Stocks ➞ Best Biotech Stocks ➞ |
| Detailed Overview of Financial Stocks |
| Financial Technical Overview, Leaders & Laggards, Top Financial ETF Funds & Detailed Financial Stocks List, Charts, Trends & More |
| Financial Sector: Technical Analysis, Trends & YTD Performance | |
| Financial sector is composed of stocks
from banks, brokers, insurance, REITs
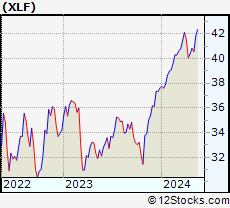
and services subsectors. Financial sector, as represented by XLF, an exchange-traded fund [ETF] that holds basket of Financial stocks (e.g, Bank of America, Goldman Sachs) is up by 8.4% and is currently outperforming the overall market by 1.84% year-to-date. Below is a quick view of Technical charts and trends: |
|
 XLF Weekly Chart |
|
| Long Term Trend: Very Good | |
| Medium Term Trend: Good | |
 XLF Daily Chart |
|
| Short Term Trend: Deteriorating | |
| Overall Trend Score: 70 | |
| YTD Performance: 8.4% | |
| **Trend Scores & Views Are Only For Educational Purposes And Not For Investing | |
| 12Stocks.com: Top Performing Financial Sector Stocks | ||||||||||||||||||||||||||||||||||||||||||||||||
 The top performing Financial sector stocks year to date are
Now, more recently, over last week, the top performing Financial sector stocks on the move are


|
||||||||||||||||||||||||||||||||||||||||||||||||
| 12Stocks.com: Investing in Financial Sector using Exchange Traded Funds | |
|
The following table shows list of key exchange traded funds (ETF) that
help investors track Financial Index. For detailed view, check out our ETF Funds section of our website. Quick View: Move mouse or cursor over ETF symbol (ticker) to view short-term Technical chart and over ETF name to view long term chart. Click on ticker or stock name for detailed view. Click on to add stock symbol to your watchlist and to view watchlist. |
12Stocks.com List of ETFs that track Financial Index
| Ticker | ETF Name | Watchlist | Recent Price | Smart Investing & Trading Score | Change % | Week % | Year-to-date % |
| XLF | Financial | | 40.76 | 70 | -0.15 | -0.15 | 8.4% |
| IAI | Broker-Dealers & Secs | | 112.90 | 83 | -0.10 | -0.1 | 4.03% |
| IYF | Financials | | 92.16 | 83 | -0.01 | -0.01 | 7.9% |
| IYG | Financial Services | | 64.34 | 83 | -0.42 | -0.42 | 7.71% |
| KRE | Regional Banking | | 47.77 | 54 | -0.87 | -0.87 | -8.89% |
| IXG | Global Financials | | 84.35 | 83 | 0.19 | 0.19 | 7.34% |
| VFH | Financials | | 98.74 | 83 | -0.19 | -0.19 | 7.02% |
| KBE | Bank | | 45.10 | 68 | -0.51 | -0.51 | -2% |
| FAS | Financial Bull 3X | | 100.33 | 58 | -0.30 | -0.3 | 21.39% |
| FAZ | Financial Bear 3X | | 10.93 | 42 | 0.64 | 0.64 | -20.04% |
| UYG | Financials | | 63.40 | 53 | -0.39 | -0.39 | 14.86% |
| IAT | Regional Banks | | 41.57 | 73 | -0.36 | -0.36 | -0.65% |
| KIE | Insurance | | 48.79 | 58 | 0.54 | 0.54 | 7.89% |
| PSCF | SmallCap Financials | | 46.33 | 47 | -0.06 | -0.06 | -5.79% |
| EUFN | Europe Financials | | 22.50 | 83 | 0.18 | 0.18 | 7.35% |
| PGF | Financial Preferred | | 14.64 | 39 | 0.48 | 0.48 | 0.41% |
| 12Stocks.com: Charts, Trends, Fundamental Data and Performances of Financial Stocks | |
|
We now take in-depth look at all Financial stocks including charts, multi-period performances and overall trends (as measured by Smart Investing & Trading Score). One can sort Financial stocks (click link to choose) by Daily, Weekly and by Year-to-Date performances. Also, one can sort by size of the company or by market capitalization. |
| Select Your Default Chart Type: | |||||
| |||||
| Click on stock symbol or name for detailed view. Click on to add stock symbol to your watchlist and to view watchlist. Quick View: Move mouse or cursor over "Daily" to quickly view daily Technical stock chart and over "Weekly" to view weekly Technical stock chart. | |||||

 | PFIS Peoples Financial Services Corp. |
| Sector: Financials | |
| SubSector: Regional - Northeast Banks | |
| MarketCap: 305.499 Millions | |
| Recent Price: 37.99 Smart Investing & Trading Score: 67 | |
| Day Percent Change: -0.76% Day Change: -0.29 | |
| Week Change: -0.76% Year-to-date Change: -22.0% | |
| PFIS Links: Profile News Message Board | |
| Charts:- Daily , Weekly | |
| Add PFIS to Watchlist: View: Get Complete PFIS Trend Analysis ➞ | |
 | PRK Park National Corporation |
| Sector: Financials | |
| SubSector: Regional - Midwest Banks | |
| MarketCap: 1416.6 Millions | |
| Recent Price: 133.29 Smart Investing & Trading Score: 68 | |
| Day Percent Change: -0.77% Day Change: -1.04 | |
| Week Change: -0.77% Year-to-date Change: 0.3% | |
| PRK Links: Profile News Message Board | |
| Charts:- Daily , Weekly | |
| Add PRK to Watchlist: View: Get Complete PRK Trend Analysis ➞ | |
 | GDOT Green Dot Corporation |
| Sector: Financials | |
| SubSector: Credit Services | |
| MarketCap: 1320.08 Millions | |
| Recent Price: 8.97 Smart Investing & Trading Score: 50 | |
| Day Percent Change: -0.77% Day Change: -0.07 | |
| Week Change: -0.77% Year-to-date Change: -9.4% | |
| GDOT Links: Profile News Message Board | |
| Charts:- Daily , Weekly | |
| Add GDOT to Watchlist: View: Get Complete GDOT Trend Analysis ➞ | |
 | MS Morgan Stanley |
| Sector: Financials | |
| SubSector: Investment Brokerage - National | |
| MarketCap: 55876.7 Millions | |
| Recent Price: 92.11 Smart Investing & Trading Score: 68 | |
| Day Percent Change: -0.78% Day Change: -0.72 | |
| Week Change: -0.78% Year-to-date Change: -1.2% | |
| MS Links: Profile News Message Board | |
| Charts:- Daily , Weekly | |
| Add MS to Watchlist: View: Get Complete MS Trend Analysis ➞ | |
 | COLB Columbia Banking System, Inc. |
| Sector: Financials | |
| SubSector: Savings & Loans | |
| MarketCap: 1868.3 Millions | |
| Recent Price: 18.97 Smart Investing & Trading Score: 42 | |
| Day Percent Change: -0.78% Day Change: -0.15 | |
| Week Change: -0.78% Year-to-date Change: -28.9% | |
| COLB Links: Profile News Message Board | |
| Charts:- Daily , Weekly | |
| Add COLB to Watchlist: View: Get Complete COLB Trend Analysis ➞ | |
 | FSBC Five Star Bancorp |
| Sector: Financials | |
| SubSector: Banks - Regional | |
| MarketCap: 377 Millions | |
| Recent Price: 21.58 Smart Investing & Trading Score: 45 | |
| Day Percent Change: -0.78% Day Change: -0.17 | |
| Week Change: -0.78% Year-to-date Change: -17.6% | |
| FSBC Links: Profile News Message Board | |
| Charts:- Daily , Weekly | |
| Add FSBC to Watchlist: View: Get Complete FSBC Trend Analysis ➞ | |
 | FMNB Farmers National Banc Corp. |
| Sector: Financials | |
| SubSector: Regional - Midwest Banks | |
| MarketCap: 366.57 Millions | |
| Recent Price: 11.98 Smart Investing & Trading Score: 25 | |
| Day Percent Change: -0.79% Day Change: -0.10 | |
| Week Change: -0.79% Year-to-date Change: -17.1% | |
| FMNB Links: Profile News Message Board | |
| Charts:- Daily , Weekly | |
| Add FMNB to Watchlist: View: Get Complete FMNB Trend Analysis ➞ | |
 | AMG Affiliated Managers Group, Inc. |
| Sector: Financials | |
| SubSector: Asset Management | |
| MarketCap: 2849.63 Millions | |
| Recent Price: 158.92 Smart Investing & Trading Score: 46 | |
| Day Percent Change: -0.80% Day Change: -1.28 | |
| Week Change: -0.8% Year-to-date Change: 5.0% | |
| AMG Links: Profile News Message Board | |
| Charts:- Daily , Weekly | |
| Add AMG to Watchlist: View: Get Complete AMG Trend Analysis ➞ | |
 | FISI Financial Institutions, Inc. |
| Sector: Financials | |
| SubSector: Regional - Mid-Atlantic Banks | |
| MarketCap: 253.459 Millions | |
| Recent Price: 17.46 Smart Investing & Trading Score: 67 | |
| Day Percent Change: -0.80% Day Change: -0.14 | |
| Week Change: -0.8% Year-to-date Change: -18.0% | |
| FISI Links: Profile News Message Board | |
| Charts:- Daily , Weekly | |
| Add FISI to Watchlist: View: Get Complete FISI Trend Analysis ➞ | |
 | BWFG Bankwell Financial Group, Inc. |
| Sector: Financials | |
| SubSector: Regional - Northeast Banks | |
| MarketCap: 142.899 Millions | |
| Recent Price: 23.65 Smart Investing & Trading Score: 17 | |
| Day Percent Change: -0.80% Day Change: -0.19 | |
| Week Change: -0.8% Year-to-date Change: -21.6% | |
| BWFG Links: Profile News Message Board | |
| Charts:- Daily , Weekly | |
| Add BWFG to Watchlist: View: Get Complete BWFG Trend Analysis ➞ | |
 | AMH American Homes 4 Rent |
| Sector: Financials | |
| SubSector: REIT - Residential | |
| MarketCap: 6135.31 Millions | |
| Recent Price: 36.11 Smart Investing & Trading Score: 100 | |
| Day Percent Change: -0.82% Day Change: -0.30 | |
| Week Change: -0.82% Year-to-date Change: 0.4% | |
| AMH Links: Profile News Message Board | |
| Charts:- Daily , Weekly | |
| Add AMH to Watchlist: View: Get Complete AMH Trend Analysis ➞ | |
 | GABC German American Bancorp, Inc. |
| Sector: Financials | |
| SubSector: Regional - Midwest Banks | |
| MarketCap: 731.47 Millions | |
| Recent Price: 31.98 Smart Investing & Trading Score: 32 | |
| Day Percent Change: -0.82% Day Change: -0.27 | |
| Week Change: -0.82% Year-to-date Change: -1.3% | |
| GABC Links: Profile News Message Board | |
| Charts:- Daily , Weekly | |
| Add GABC to Watchlist: View: Get Complete GABC Trend Analysis ➞ | |
 | LADR Ladder Capital Corp |
| Sector: Financials | |
| SubSector: Mortgage Investment | |
| MarketCap: 660.039 Millions | |
| Recent Price: 10.91 Smart Investing & Trading Score: 100 | |
| Day Percent Change: -0.82% Day Change: -0.09 | |
| Week Change: -0.82% Year-to-date Change: -5.2% | |
| LADR Links: Profile News Message Board | |
| Charts:- Daily , Weekly | |
| Add LADR to Watchlist: View: Get Complete LADR Trend Analysis ➞ | |
 | WTFC Wintrust Financial Corporation |
| Sector: Financials | |
| SubSector: Regional - Midwest Banks | |
| MarketCap: 1942.6 Millions | |
| Recent Price: 98.19 Smart Investing & Trading Score: 68 | |
| Day Percent Change: -0.83% Day Change: -0.82 | |
| Week Change: -0.83% Year-to-date Change: 5.9% | |
| WTFC Links: Profile News Message Board | |
| Charts:- Daily , Weekly | |
| Add WTFC to Watchlist: View: Get Complete WTFC Trend Analysis ➞ | |
 | GCBC Greene County Bancorp, Inc. |
| Sector: Financials | |
| SubSector: Savings & Loans | |
| MarketCap: 314.83 Millions | |
| Recent Price: 29.74 Smart Investing & Trading Score: 90 | |
| Day Percent Change: -0.83% Day Change: -0.25 | |
| Week Change: -0.83% Year-to-date Change: 5.5% | |
| GCBC Links: Profile News Message Board | |
| Charts:- Daily , Weekly | |
| Add GCBC to Watchlist: View: Get Complete GCBC Trend Analysis ➞ | |
 | FSV FirstService Corporation |
| Sector: Financials | |
| SubSector: Property Management | |
| MarketCap: 2793.92 Millions | |
| Recent Price: 148.55 Smart Investing & Trading Score: 10 | |
| Day Percent Change: -0.83% Day Change: -1.25 | |
| Week Change: -0.83% Year-to-date Change: -8.4% | |
| FSV Links: Profile News Message Board | |
| Charts:- Daily , Weekly | |
| Add FSV to Watchlist: View: Get Complete FSV Trend Analysis ➞ | |
 | WDH Waterdrop Inc. |
| Sector: Financials | |
| SubSector: Insurance - Diversified | |
| MarketCap: 874 Millions | |
| Recent Price: 1.19 Smart Investing & Trading Score: 59 | |
| Day Percent Change: -0.83% Day Change: -0.01 | |
| Week Change: -0.83% Year-to-date Change: 13.7% | |
| WDH Links: Profile News Message Board | |
| Charts:- Daily , Weekly | |
| Add WDH to Watchlist: View: Get Complete WDH Trend Analysis ➞ | |
 | CAC Camden National Corporation |
| Sector: Financials | |
| SubSector: Regional - Northeast Banks | |
| MarketCap: 550.999 Millions | |
| Recent Price: 30.24 Smart Investing & Trading Score: 60 | |
| Day Percent Change: -0.85% Day Change: -0.26 | |
| Week Change: -0.85% Year-to-date Change: -19.6% | |
| CAC Links: Profile News Message Board | |
| Charts:- Daily , Weekly | |
| Add CAC to Watchlist: View: Get Complete CAC Trend Analysis ➞ | |
 | CVLY Codorus Valley Bancorp, Inc. |
| Sector: Financials | |
| SubSector: Regional - Northeast Banks | |
| MarketCap: 173.799 Millions | |
| Recent Price: 22.28 Smart Investing & Trading Score: 74 | |
| Day Percent Change: -0.85% Day Change: -0.19 | |
| Week Change: -0.85% Year-to-date Change: -13.3% | |
| CVLY Links: Profile News Message Board | |
| Charts:- Daily , Weekly | |
| Add CVLY to Watchlist: View: Get Complete CVLY Trend Analysis ➞ | |
 | CATY Cathay General Bancorp |
| Sector: Financials | |
| SubSector: Regional - Pacific Banks | |
| MarketCap: 1781.99 Millions | |
| Recent Price: 34.74 Smart Investing & Trading Score: 42 | |
| Day Percent Change: -0.86% Day Change: -0.30 | |
| Week Change: -0.86% Year-to-date Change: -22.1% | |
| CATY Links: Profile News Message Board | |
| Charts:- Daily , Weekly | |
| Add CATY to Watchlist: View: Get Complete CATY Trend Analysis ➞ | |
 | PEBO Peoples Bancorp Inc. |
| Sector: Financials | |
| SubSector: Regional - Midwest Banks | |
| MarketCap: 449.77 Millions | |
| Recent Price: 29.50 Smart Investing & Trading Score: 75 | |
| Day Percent Change: -0.87% Day Change: -0.26 | |
| Week Change: -0.87% Year-to-date Change: -12.6% | |
| PEBO Links: Profile News Message Board | |
| Charts:- Daily , Weekly | |
| Add PEBO to Watchlist: View: Get Complete PEBO Trend Analysis ➞ | |
 | FRME First Merchants Corporation |
| Sector: Financials | |
| SubSector: Regional - Midwest Banks | |
| MarketCap: 1490.4 Millions | |
| Recent Price: 33.83 Smart Investing & Trading Score: 73 | |
| Day Percent Change: -0.88% Day Change: -0.30 | |
| Week Change: -0.88% Year-to-date Change: -8.8% | |
| FRME Links: Profile News Message Board | |
| Charts:- Daily , Weekly | |
| Add FRME to Watchlist: View: Get Complete FRME Trend Analysis ➞ | |
 | CM Canadian Imperial Bank of Commerce |
| Sector: Financials | |
| SubSector: Money Center Banks | |
| MarketCap: 27150.5 Millions | |
| Recent Price: 47.40 Smart Investing & Trading Score: 56 | |
| Day Percent Change: -0.88% Day Change: -0.42 | |
| Week Change: -0.88% Year-to-date Change: -1.5% | |
| CM Links: Profile News Message Board | |
| Charts:- Daily , Weekly | |
| Add CM to Watchlist: View: Get Complete CM Trend Analysis ➞ | |
 | CIVB Civista Bancshares, Inc. |
| Sector: Financials | |
| SubSector: Regional - Pacific Banks | |
| MarketCap: 255.929 Millions | |
| Recent Price: 14.72 Smart Investing & Trading Score: 35 | |
| Day Percent Change: -0.88% Day Change: -0.13 | |
| Week Change: -0.88% Year-to-date Change: -20.2% | |
| CIVB Links: Profile News Message Board | |
| Charts:- Daily , Weekly | |
| Add CIVB to Watchlist: View: Get Complete CIVB Trend Analysis ➞ | |
 | ERIE Erie Indemnity Company |
| Sector: Financials | |
| SubSector: Insurance Brokers | |
| MarketCap: 8822 Millions | |
| Recent Price: 378.34 Smart Investing & Trading Score: 51 | |
| Day Percent Change: -0.89% Day Change: -3.40 | |
| Week Change: -0.89% Year-to-date Change: 13.0% | |
| ERIE Links: Profile News Message Board | |
| Charts:- Daily , Weekly | |
| Add ERIE to Watchlist: View: Get Complete ERIE Trend Analysis ➞ | |
| For tabular summary view of above stock list: Summary View ➞ 0 - 25 , 25 - 50 , 50 - 75 , 75 - 100 , 100 - 125 , 125 - 150 , 150 - 175 , 175 - 200 , 200 - 225 , 225 - 250 , 250 - 275 , 275 - 300 , 300 - 325 , 325 - 350 , 350 - 375 , 375 - 400 , 400 - 425 , 425 - 450 , 450 - 475 , 475 - 500 , 500 - 525 , 525 - 550 , 550 - 575 , 575 - 600 , 600 - 625 , 625 - 650 , 650 - 675 , 675 - 700 , 700 - 725 , 725 - 750 , 750 - 775 , 775 - 800 , 800 - 825 , 825 - 850 , 850 - 875 , 875 - 900 , 900 - 925 , 925 - 950 , 950 - 975 , 975 - 1000 , 1000 - 1025 , 1025 - 1050 , 1050 - 1075 , 1075 - 1100 , 1100 - 1125 , 1125 - 1150 , 1150 - 1175 , 1175 - 1200 , 1200 - 1225 , 1225 - 1250 | ||
| Click To Change The Sort Order: By Market Cap or Company Size Performance: Year-to-date, Week and Day | |
| Select Chart Type: | ||
|
Best Stocks Today 12Stocks.com |
© 2024 12Stocks.com Terms & Conditions Privacy Contact Us
All Information Provided Only For Education And Not To Be Used For Investing or Trading. See Terms & Conditions


One More Thing ... Get Best Stocks Delivered Daily!
Never Ever Miss A Move With Our Top Ten Stocks Lists
Find Best Stocks In Any Market - Bull or Bear Market
Take A Peek At Our Top Ten Stocks Lists: Daily, Weekly, Year-to-Date & Top Trends
Find Best Stocks In Any Market - Bull or Bear Market
Take A Peek At Our Top Ten Stocks Lists: Daily, Weekly, Year-to-Date & Top Trends
Financial Stocks With Best Up Trends [0-bearish to 100-bullish]: Heartland [100], Fulton [100], B. Riley[100], ICICI Bank[100], Piedmont Office[100], Douglas Emmett[100], BrasilAgro -[100], LPL [100], Highwoods Properties[100], TCG BDC[100], Stifel [100]
Best Financial Stocks Year-to-Date:
Root [537.25%], Hippo [140.94%], Gladstone Capital[102.66%], Banco Macro[85.19%], B. Riley[84.04%], Grupo Financiero[81.15%], Banco BBVA[71.21%], Yiren Digital[60.9%], EverQuote [59.97%], Fidelis Insurance[58.53%], Heritage Insurance[57.52%] Best Financial Stocks This Week:
Heartland [15.24%], AltC Acquisition[12.57%], Douglas Elliman[10.92%], Fulton [7.62%], Medical Properties[5.99%], Clipper Realty[5.54%], Huize Holding[5.53%], Oportun [5.08%], B. Riley[4.92%], Citizens [4.81%], AlTi Global[4.43%] Best Financial Stocks Daily:
Heartland [15.24%], AltC Acquisition[12.57%], Douglas Elliman[10.92%], Fulton [7.62%], Medical Properties[5.99%], Clipper Realty[5.54%], Huize Holding[5.53%], Oportun [5.08%], B. Riley[4.92%], Citizens [4.81%], AlTi Global[4.43%]