
 Login Sign Up


| |||||
 |  | ||||

| 12Stocks.com Market Intelligence |
Best Europe Stocks
|
On this page, you will find the most comprehensive analysis of European stocks and ETFs - from latest trends to performances to charts ➞. First, here are the year-to-date (YTD) performances of the most requested Europe stocks at 12Stocks.com (click stock for review):
| Deutsche Bank 22% | ||
| ASML Holding 19% | ||
| SAP SE 19% | ||
| GlaxoSmithKline 17% | ||
| Koninklijke Philips 15% | ||
| AstraZeneca 13% | ||
| HSBC 10% | ||
| BP 9% | ||
| British American 2% | ||
| Fresenius Medical 1% | ||
| Novartis AG -4% | ||
| Diageo -6% | ||
| UBS -12% | ||
| Transocean -12% | ||
| In a hurry? Europe Stocks Lists: Performance Trends Table, Stock Charts
Sort Europe stocks: Daily, Weekly, Year-to-Date, Market Cap & Trends. Filter Europe stocks list by sector: Show all, Tech, Finance, Energy, Staples, Retail, Industrial, Materials, Utilities and HealthCare Filter Europe stocks list by size:All Europe Large Medium Small and MicroCap |
| 12Stocks.com Europe Stocks Performances & Trends Daily | |||||||||
|
|  The overall Smart Investing & Trading Score is 95 (0-bearish to 100-bullish) which puts Europe index in short term bullish trend. The Smart Investing & Trading Score from previous trading session is 58 and hence an improvement of trend.
| ||||||||
Here are the Smart Investing & Trading Scores of the most requested Europe stocks at 12Stocks.com (click stock name for detailed review):
|


| 12Stocks.com: Top Performing Europe Index Stocks | ||||||||||||||||||||||||||||||||||||||||||||||||
 The top performing Europe Index stocks year to date are
Now, more recently, over last week, the top performing Europe Index stocks on the move are


|
||||||||||||||||||||||||||||||||||||||||||||||||
| 12Stocks.com: Investing in Europe Index with Stocks | |
|
The following table helps investors and traders sort through current performance and trends (as measured by Smart Investing & Trading Score) of various
stocks in the Europe Index. Quick View: Move mouse or cursor over stock symbol (ticker) to view short-term technical chart and over stock name to view long term chart. Click on  to add stock symbol to your watchlist and to add stock symbol to your watchlist and  to view watchlist. Click on any ticker or stock name for detailed market intelligence report for that stock. to view watchlist. Click on any ticker or stock name for detailed market intelligence report for that stock. |
12Stocks.com Performance of Stocks in Europe Index
| Ticker | Stock Name | Watchlist | Category | Recent Price | Smart Investing & Trading Score | Change % | YTD Change% |
| LXFR | Luxfer |   | Industrials | 11.70 | 100 | 5.69% | 30.87% |
| SGHC | Super | | Services & Goods | 3.47 | 100 | 4.83% | 8.61% |
| ALLG | Allego N.V | | Services & Goods | 1.27 | 100 | 4.53% | -6.62% |
| LIVN | LivaNova | | Health Care | 64.15 | 100 | 1.95% | 23.99% |
| ST | Sensata | | Technology | 40.07 | 100 | 1.70% | 6.65% |
| AMCR | Amcor | | Consumer Staples | 10.01 | 100 | 1.42% | 3.84% |
| NGG | National Grid | | Utilities | 68.33 | 100 | 1.06% | 0.50% |
| RIO | Rio Tinto | | Materials | 68.94 | 100 | 0.97% | -7.41% |
| ING | ING Groep | | Financials | 17.18 | 100 | 0.76% | 14.38% |
| BNTX | BioNTech SE | | Health Care | 92.72 | 100 | 0.52% | -12.15% |
| AEF | Aberdeen Emerging | | Financials | 5.19 | 100 | 0.39% | 1.57% |
| GRMN | Garmin | | Technology | 165.97 | 100 | 0.39% | 29.12% |
| GSK | GlaxoSmithKline | | Health Care | 43.50 | 100 | 0.35% | 17.38% |
| ARGX | argenx SE | | Health Care | 388.20 | 100 | -1.33% | 2.04% |
| HSBC | HSBC | | Financials | 44.45 | 100 | -0.13% | 9.64% |
| IHS | IHS Holding | | Services & Goods | 3.81 | 95 | 5.26% | -17.28% |
| LILM | Lilium N.V | | Industrials | 1.04 | 95 | 4.00% | -13.69% |
| JHG | Janus Henderson | | Financials | 32.55 | 95 | 1.85% | 7.96% |
| AEG | Aegon N.V | | Financials | 6.33 | 95 | 1.12% | 9.90% |
| PHG | Koninklijke Philips | | Technology | 26.82 | 95 | 0.98% | 14.96% |
| AER | AerCap | | Transports | 87.60 | 95 | 0.90% | 17.87% |
| LYG | Lloyds Banking | | Financials | 2.60 | 95 | 0.78% | 8.79% |
| AY | Atlantica Yield | | Utilities | 21.41 | 95 | -0.05% | -0.42% |
| OTLY | Oatly | | Consumer Staples | 1.22 | 90 | 2.52% | 4.27% |
| NVGS | Navigator | | Transports | 15.41 | 90 | 1.38% | 5.91% |
| For chart view version of above stock list: Chart View ➞ 0 - 25 , 25 - 50 , 50 - 75 , 75 - 100 , 100 - 125 , 125 - 150 | ||
 | Click To Change The Sort Order: By Market Cap or Company Size Performance: Year-to-date, Week and Day |  |
|
Get the most comprehensive stock market coverage daily at 12Stocks.com ➞ Best Stocks Today ➞ Best Stocks Weekly ➞ Best Stocks Year-to-Date ➞ Best Stocks Trends ➞  Best Stocks Today 12Stocks.com Best Nasdaq Stocks ➞ Best S&P 500 Stocks ➞ Best Tech Stocks ➞ Best Biotech Stocks ➞ |
| Detailed Overview of Europe Stocks |
| Europe Technical Overview, Leaders & Laggards, Top Europe ETF Funds & Detailed Europe Stocks List, Charts, Trends & More |
| Europe: Technical Analysis, Trends & YTD Performance | |
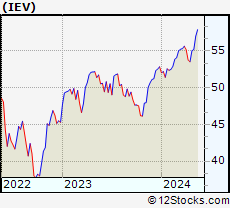
 IEV Weekly Chart |
|
| Long Term Trend: Good | |
| Medium Term Trend: Very Good | |
 IEV Daily Chart |
|
| Short Term Trend: Very Good | |
| Overall Trend Score: 95 | |
| YTD Performance: 4.46% | |
| **Trend Scores & Views Are Only For Educational Purposes And Not For Investing | |
| 12Stocks.com: Investing in Europe Index using Exchange Traded Funds | |
|
The following table shows list of key exchange traded funds (ETF) that
help investors play Europe stock market. For detailed view, check out our ETF Funds section of our website. Quick View: Move mouse or cursor over ETF symbol (ticker) to view short-term technical chart and over ETF name to view long term chart. Click on ticker or stock name for detailed view. Click on to add stock symbol to your watchlist and to view watchlist. |
12Stocks.com List of ETFs that track Europe Index
| Ticker | ETF Name | Watchlist | Recent Price | Smart Investing & Trading Score | Change % | Week % | Year-to-date % |
| IEV | Europe | | 55.22 | 95 | 0.88 | 0.31 | 4.46% |
| VGK | Europe | | 66.79 | 90 | 0.91 | 0.6 | 3.58% |
| EURL | Europe Bull 3X | | 25.07 | 90 | 2.58 | 0.95 | 5.74% |
| EPV | Short Europe | | 7.97 | 10 | -1.60 | -1.06 | -7.22% |
| IEUS | Europe Small-Cap | | 56.52 | 100 | 0.53 | 1.87 | 0.57% |
| HEDJ | Europe Hedged Equity | | 46.60 | 55 | 0.47 | -2.41 | 8.75% |
| EUSC | Europe Hedged SmallCap | | 38.97 | 100 | 0.67 | 1.33 | 8.24% |
| EUFN | Europe Financials | | 22.65 | 85 | 0.24 | 0.82 | 8.04% |
| EWU | United Kingdom | | 35.34 | 100 | 0.83 | 1.46 | 6.93% |
| EWQ | France | | 40.64 | 80 | 0.87 | -0.07 | 3.73% |
| EWG | Germany | | 30.95 | 85 | 0.78 | -0.03 | 4.24% |
| EWL | Switzerland | | 46.23 | 57 | 1.18 | 0.63 | -4.23% |
| EWN | Netherlands | | 49.24 | 95 | 1.80 | 1.71 | 10.33% |
| EWI | Italy | | 36.96 | 73 | 0.24 | -0.75 | 8.93% |
| FEP | Europe AlphaDEX | | 37.64 | 95 | 0.72 | 0.4 | 3.63% |
| FDD | European Sel Div | | 12.10 | 100 | 0.67 | 1.18 | 0.25% |
| FXE | Euro | | 99.34 | 70 | 0.39 | 0.43 | -2.65% |
| 12Stocks.com: Charts, Trends, Fundamental Data and Performances of Europe Stocks | |
|
We now take in-depth look at all Europe stocks including charts, multi-period performances and overall trends (as measured by Smart Investing & Trading Score). One can sort Europe stocks (click link to choose) by Daily, Weekly and by Year-to-Date performances. Also, one can sort by size of the company or by market capitalization. |
| Select Your Default Chart Type: | |||||
| |||||
| Click on stock symbol or name for detailed view. Click on to add stock symbol to your watchlist and to view watchlist. Quick View: Move mouse or cursor over "Daily" to quickly view daily technical stock chart and over "Weekly" to view weekly technical stock chart. | |||||

 | LXFR Luxfer Holdings PLC |
| Sector: Industrials | |
| SubSector: Diversified Machinery | |
| MarketCap: 406.716 Millions | |
| Recent Price: 11.70 Smart Investing & Trading Score: 100 | |
| Day Percent Change: 5.69% Day Change: 0.63 | |
| Week Change: 20.25% Year-to-date Change: 30.9% | |
| LXFR Links: Profile News Message Board | |
| Charts:- Daily , Weekly | |
| Add LXFR to Watchlist: View: Get Complete LXFR Trend Analysis ➞ | |
 | SGHC Super Group (SGHC) Limited |
| Sector: Services & Goods | |
| SubSector: Gambling | |
| MarketCap: 1390 Millions | |
| Recent Price: 3.47 Smart Investing & Trading Score: 100 | |
| Day Percent Change: 4.83% Day Change: 0.16 | |
| Week Change: 15.28% Year-to-date Change: 8.6% | |
| SGHC Links: Profile News Message Board | |
| Charts:- Daily , Weekly | |
| Add SGHC to Watchlist: View: Get Complete SGHC Trend Analysis ➞ | |
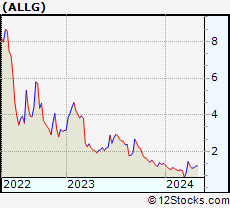 | ALLG Allego N.V. |
| Sector: Services & Goods | |
| SubSector: Auto Parts | |
| MarketCap: 720 Millions | |
| Recent Price: 1.27 Smart Investing & Trading Score: 100 | |
| Day Percent Change: 4.53% Day Change: 0.05 | |
| Week Change: 5.83% Year-to-date Change: -6.6% | |
| ALLG Links: Profile News Message Board | |
| Charts:- Daily , Weekly | |
| Add ALLG to Watchlist: View: Get Complete ALLG Trend Analysis ➞ | |
 | LIVN LivaNova PLC |
| Sector: Health Care | |
| SubSector: Medical Appliances & Equipment | |
| MarketCap: 2060.5 Millions | |
| Recent Price: 64.15 Smart Investing & Trading Score: 100 | |
| Day Percent Change: 1.95% Day Change: 1.23 | |
| Week Change: 15.52% Year-to-date Change: 24.0% | |
| LIVN Links: Profile News Message Board | |
| Charts:- Daily , Weekly | |
| Add LIVN to Watchlist: View: Get Complete LIVN Trend Analysis ➞ | |
 | ST Sensata Technologies Holding plc |
| Sector: Technology | |
| SubSector: Scientific & Technical Instruments | |
| MarketCap: 4434.23 Millions | |
| Recent Price: 40.07 Smart Investing & Trading Score: 100 | |
| Day Percent Change: 1.70% Day Change: 0.67 | |
| Week Change: 14.55% Year-to-date Change: 6.7% | |
| ST Links: Profile News Message Board | |
| Charts:- Daily , Weekly | |
| Add ST to Watchlist: View: Get Complete ST Trend Analysis ➞ | |
 | AMCR Amcor plc |
| Sector: Consumer Staples | |
| SubSector: Packaging & Containers | |
| MarketCap: 13964 Millions | |
| Recent Price: 10.01 Smart Investing & Trading Score: 100 | |
| Day Percent Change: 1.42% Day Change: 0.14 | |
| Week Change: 11.59% Year-to-date Change: 3.8% | |
| AMCR Links: Profile News Message Board | |
| Charts:- Daily , Weekly | |
| Add AMCR to Watchlist: View: Get Complete AMCR Trend Analysis ➞ | |
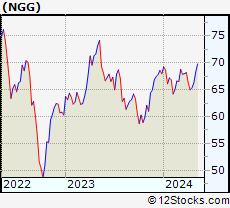 | NGG National Grid plc |
| Sector: Utilities | |
| SubSector: Gas Utilities | |
| MarketCap: 38366.5 Millions | |
| Recent Price: 68.33 Smart Investing & Trading Score: 100 | |
| Day Percent Change: 1.06% Day Change: 0.72 | |
| Week Change: 3.05% Year-to-date Change: 0.5% | |
| NGG Links: Profile News Message Board | |
| Charts:- Daily , Weekly | |
| Add NGG to Watchlist: View: Get Complete NGG Trend Analysis ➞ | |
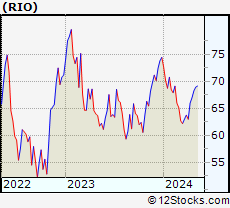 | RIO Rio Tinto Group |
| Sector: Materials | |
| SubSector: Industrial Metals & Minerals | |
| MarketCap: 69399.7 Millions | |
| Recent Price: 68.94 Smart Investing & Trading Score: 100 | |
| Day Percent Change: 0.97% Day Change: 0.66 | |
| Week Change: 1.03% Year-to-date Change: -7.4% | |
| RIO Links: Profile News Message Board | |
| Charts:- Daily , Weekly | |
| Add RIO to Watchlist: View: Get Complete RIO Trend Analysis ➞ | |
 | ING ING Groep N.V. |
| Sector: Financials | |
| SubSector: Life Insurance | |
| MarketCap: 24280.9 Millions | |
| Recent Price: 17.18 Smart Investing & Trading Score: 100 | |
| Day Percent Change: 0.76% Day Change: 0.13 | |
| Week Change: 7.78% Year-to-date Change: 14.4% | |
| ING Links: Profile News Message Board | |
| Charts:- Daily , Weekly | |
| Add ING to Watchlist: View: Get Complete ING Trend Analysis ➞ | |
 | BNTX BioNTech SE |
| Sector: Health Care | |
| SubSector: Biotechnology | |
| MarketCap: 11933.7 Millions | |
| Recent Price: 92.72 Smart Investing & Trading Score: 100 | |
| Day Percent Change: 0.52% Day Change: 0.48 | |
| Week Change: 6.32% Year-to-date Change: -12.2% | |
| BNTX Links: Profile News Message Board | |
| Charts:- Daily , Weekly | |
| Add BNTX to Watchlist: View: Get Complete BNTX Trend Analysis ➞ | |
 | AEF Aberdeen Emerging Markets Equity Income Fund, Inc. |
| Sector: Financials | |
| SubSector: Asset Management | |
| MarketCap: 245.803 Millions | |
| Recent Price: 5.19 Smart Investing & Trading Score: 100 | |
| Day Percent Change: 0.39% Day Change: 0.02 | |
| Week Change: 3.08% Year-to-date Change: 1.6% | |
| AEF Links: Profile News Message Board | |
| Charts:- Daily , Weekly | |
| Add AEF to Watchlist: View: Get Complete AEF Trend Analysis ➞ | |
 | GRMN Garmin Ltd. |
| Sector: Technology | |
| SubSector: Scientific & Technical Instruments | |
| MarketCap: 13909.3 Millions | |
| Recent Price: 165.97 Smart Investing & Trading Score: 100 | |
| Day Percent Change: 0.39% Day Change: 0.64 | |
| Week Change: 15.7% Year-to-date Change: 29.1% | |
| GRMN Links: Profile News Message Board | |
| Charts:- Daily , Weekly | |
| Add GRMN to Watchlist: View: Get Complete GRMN Trend Analysis ➞ | |
 | GSK GlaxoSmithKline plc |
| Sector: Health Care | |
| SubSector: Drug Manufacturers - Major | |
| MarketCap: 89428.2 Millions | |
| Recent Price: 43.50 Smart Investing & Trading Score: 100 | |
| Day Percent Change: 0.35% Day Change: 0.15 | |
| Week Change: 5.81% Year-to-date Change: 17.4% | |
| GSK Links: Profile News Message Board | |
| Charts:- Daily , Weekly | |
| Add GSK to Watchlist: View: Get Complete GSK Trend Analysis ➞ | |
 | ARGX argenx SE |
| Sector: Health Care | |
| SubSector: Biotechnology | |
| MarketCap: 5077.05 Millions | |
| Recent Price: 388.20 Smart Investing & Trading Score: 100 | |
| Day Percent Change: -1.33% Day Change: -5.22 | |
| Week Change: 4.13% Year-to-date Change: 2.0% | |
| ARGX Links: Profile News Message Board | |
| Charts:- Daily , Weekly | |
| Add ARGX to Watchlist: View: Get Complete ARGX Trend Analysis ➞ | |
 | HSBC HSBC Holdings plc |
| Sector: Financials | |
| SubSector: Foreign Money Center Banks | |
| MarketCap: 127701 Millions | |
| Recent Price: 44.45 Smart Investing & Trading Score: 100 | |
| Day Percent Change: -0.13% Day Change: -0.06 | |
| Week Change: 6.09% Year-to-date Change: 9.6% | |
| HSBC Links: Profile News Message Board | |
| Charts:- Daily , Weekly | |
| Add HSBC to Watchlist: View: Get Complete HSBC Trend Analysis ➞ | |
 | IHS IHS Holding Limited |
| Sector: Services & Goods | |
| SubSector: Telecom Services | |
| MarketCap: 3310 Millions | |
| Recent Price: 3.81 Smart Investing & Trading Score: 95 | |
| Day Percent Change: 5.26% Day Change: 0.19 | |
| Week Change: 7.79% Year-to-date Change: -17.3% | |
| IHS Links: Profile News Message Board | |
| Charts:- Daily , Weekly | |
| Add IHS to Watchlist: View: Get Complete IHS Trend Analysis ➞ | |
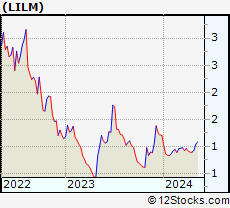 | LILM Lilium N.V. |
| Sector: Industrials | |
| SubSector: Aerospace & Defense | |
| MarketCap: 747 Millions | |
| Recent Price: 1.04 Smart Investing & Trading Score: 95 | |
| Day Percent Change: 4.00% Day Change: 0.04 | |
| Week Change: 12.86% Year-to-date Change: -13.7% | |
| LILM Links: Profile News Message Board | |
| Charts:- Daily , Weekly | |
| Add LILM to Watchlist: View: Get Complete LILM Trend Analysis ➞ | |
 | JHG Janus Henderson Group plc |
| Sector: Financials | |
| SubSector: Asset Management | |
| MarketCap: 2992.33 Millions | |
| Recent Price: 32.55 Smart Investing & Trading Score: 95 | |
| Day Percent Change: 1.85% Day Change: 0.59 | |
| Week Change: 2.71% Year-to-date Change: 8.0% | |
| JHG Links: Profile News Message Board | |
| Charts:- Daily , Weekly | |
| Add JHG to Watchlist: View: Get Complete JHG Trend Analysis ➞ | |
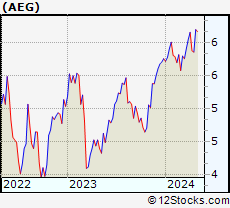 | AEG Aegon N.V. |
| Sector: Financials | |
| SubSector: Life Insurance | |
| MarketCap: 6154.26 Millions | |
| Recent Price: 6.33 Smart Investing & Trading Score: 95 | |
| Day Percent Change: 1.12% Day Change: 0.07 | |
| Week Change: 2.1% Year-to-date Change: 9.9% | |
| AEG Links: Profile News Message Board | |
| Charts:- Daily , Weekly | |
| Add AEG to Watchlist: View: Get Complete AEG Trend Analysis ➞ | |
 | PHG Koninklijke Philips N.V. |
| Sector: Technology | |
| SubSector: Electronic Equipment | |
| MarketCap: 32405.2 Millions | |
| Recent Price: 26.82 Smart Investing & Trading Score: 95 | |
| Day Percent Change: 0.98% Day Change: 0.26 | |
| Week Change: 27.29% Year-to-date Change: 15.0% | |
| PHG Links: Profile News Message Board | |
| Charts:- Daily , Weekly | |
| Add PHG to Watchlist: View: Get Complete PHG Trend Analysis ➞ | |
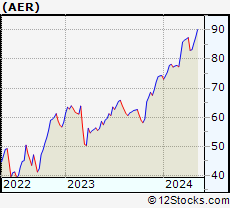 | AER AerCap Holdings N.V. |
| Sector: Transports | |
| SubSector: Air Services, Other | |
| MarketCap: 3633.68 Millions | |
| Recent Price: 87.60 Smart Investing & Trading Score: 95 | |
| Day Percent Change: 0.90% Day Change: 0.78 | |
| Week Change: 2.47% Year-to-date Change: 17.9% | |
| AER Links: Profile News Message Board | |
| Charts:- Daily , Weekly | |
| Add AER to Watchlist: View: Get Complete AER Trend Analysis ➞ | |
 | LYG Lloyds Banking Group plc |
| Sector: Financials | |
| SubSector: Foreign Money Center Banks | |
| MarketCap: 28885.4 Millions | |
| Recent Price: 2.60 Smart Investing & Trading Score: 95 | |
| Day Percent Change: 0.78% Day Change: 0.02 | |
| Week Change: -0.38% Year-to-date Change: 8.8% | |
| LYG Links: Profile News Message Board | |
| Charts:- Daily , Weekly | |
| Add LYG to Watchlist: View: Get Complete LYG Trend Analysis ➞ | |
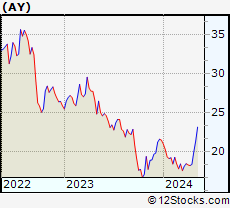 | AY Atlantica Yield plc |
| Sector: Utilities | |
| SubSector: Electric Utilities | |
| MarketCap: 2509.84 Millions | |
| Recent Price: 21.41 Smart Investing & Trading Score: 95 | |
| Day Percent Change: -0.05% Day Change: -0.01 | |
| Week Change: 7.05% Year-to-date Change: -0.4% | |
| AY Links: Profile News Message Board | |
| Charts:- Daily , Weekly | |
| Add AY to Watchlist: View: Get Complete AY Trend Analysis ➞ | |
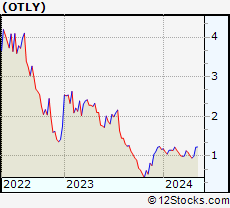 | OTLY Oatly Group AB |
| Sector: Consumer Staples | |
| SubSector: Beverages - Non-Alcoholic | |
| MarketCap: 1120 Millions | |
| Recent Price: 1.22 Smart Investing & Trading Score: 90 | |
| Day Percent Change: 2.52% Day Change: 0.03 | |
| Week Change: 22.98% Year-to-date Change: 4.3% | |
| OTLY Links: Profile News Message Board | |
| Charts:- Daily , Weekly | |
| Add OTLY to Watchlist: View: Get Complete OTLY Trend Analysis ➞ | |
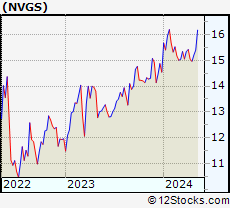 | NVGS Navigator Holdings Ltd. |
| Sector: Transports | |
| SubSector: Shipping | |
| MarketCap: 280.914 Millions | |
| Recent Price: 15.41 Smart Investing & Trading Score: 90 | |
| Day Percent Change: 1.38% Day Change: 0.21 | |
| Week Change: 1.31% Year-to-date Change: 5.9% | |
| NVGS Links: Profile News Message Board | |
| Charts:- Daily , Weekly | |
| Add NVGS to Watchlist: View: Get Complete NVGS Trend Analysis ➞ | |
| For tabular summary view of above stock list: Summary View ➞ 0 - 25 , 25 - 50 , 50 - 75 , 75 - 100 , 100 - 125 , 125 - 150 | ||
| Click To Change The Sort Order: By Market Cap or Company Size Performance: Year-to-date, Week and Day | |
| Select Chart Type: | ||
|
Best Stocks Today 12Stocks.com |
© 2024 12Stocks.com Terms & Conditions Privacy Contact Us
All Information Provided Only For Education And Not To Be Used For Investing or Trading. See Terms & Conditions


One More Thing ... Get Best Stocks Delivered Daily!
Never Ever Miss A Move With Our Top Ten Stocks Lists
Find Best Stocks In Any Market - Bull or Bear Market
Take A Peek At Our Top Ten Stocks Lists: Daily, Weekly, Year-to-Date & Top Trends
Find Best Stocks In Any Market - Bull or Bear Market
Take A Peek At Our Top Ten Stocks Lists: Daily, Weekly, Year-to-Date & Top Trends
Europe Stocks With Best Up Trends [0-bearish to 100-bullish]: Luxfer [100], Super [100], Allego N.V[100], LivaNova [100], Sensata [100], Amcor [100], National Grid[100], Rio Tinto[100], ING Groep[100], BioNTech SE[100], Aberdeen Emerging[100]
Best Europe Stocks Year-to-Date:
NuCana [1252.27%], Affimed N.V[767.2%], ADC [195.18%], NewAmsterdam Pharma[96.66%], MorphoSys AG[80.71%], Renalytix AI[80.2%], Merus N.V[75.85%], Summit [68.2%], Spotify [57.56%], Addex [53.53%], Adaptimmune [50.06%] Best Europe Stocks This Week:
CureVac N.V[33.91%], Koninklijke Philips[27.29%], Exscientia [23.17%], Oatly [22.98%], Luxfer [20.25%], Cellectis S.A[19.31%], Garmin [15.7%], LivaNova [15.52%], Super [15.28%], Sensata [14.55%], Polestar Automotive[13.98%] Best Europe Stocks Daily:
CureVac N.V[12.64%], Summit [8.13%], ReNew Energy[7.48%], Luxfer [5.69%], Addex [5.65%], nVent Electric[5.55%], IHS Holding[5.26%], Super [4.83%], Innate Pharma[4.73%], On Holding[4.69%], Allego N.V[4.53%]