
 Login Sign Up


| |||||
 |  | ||||

| 12Stocks.com Market Intelligence |
Best Europe Stocks
|
On this page, you will find the most comprehensive analysis of European stocks and ETFs - from latest trends to performances to charts ➞. First, here are the year-to-date (YTD) performances of the most requested Europe stocks at 12Stocks.com (click stock for review):
| ASML Holding 20% | ||
| Deutsche Bank 20% | ||
| SAP SE 19% | ||
| Koninklijke Philips 14% | ||
| GlaxoSmithKline 12% | ||
| AstraZeneca 12% | ||
| BP 12% | ||
| HSBC 4% | ||
| British American 1% | ||
| Fresenius Medical -1% | ||
| Novartis AG -4% | ||
| Diageo -4% | ||
| Transocean -8% | ||
| UBS -11% | ||
| In a hurry? Europe Stocks Lists: Performance Trends Table, Stock Charts
Sort Europe stocks: Daily, Weekly, Year-to-Date, Market Cap & Trends. Filter Europe stocks list by sector: Show all, Tech, Finance, Energy, Staples, Retail, Industrial, Materials, Utilities and HealthCare Filter Europe stocks list by size:All Europe Large Medium Small and MicroCap |
| 12Stocks.com Europe Stocks Performances & Trends Daily | |||||||||
|
|  The overall Smart Investing & Trading Score is 100 (0-bearish to 100-bullish) which puts Europe index in short term bullish trend. The Smart Investing & Trading Score from previous trading session is 88 and hence an improvement of trend.
| ||||||||
Here are the Smart Investing & Trading Scores of the most requested Europe stocks at 12Stocks.com (click stock name for detailed review):
|


| 12Stocks.com: Top Performing Europe Index Stocks | ||||||||||||||||||||||||||||||||||||||||||||||||
 The top performing Europe Index stocks year to date are
Now, more recently, over last week, the top performing Europe Index stocks on the move are


|
||||||||||||||||||||||||||||||||||||||||||||||||
| 12Stocks.com: Investing in Europe Index with Stocks | |
|
The following table helps investors and traders sort through current performance and trends (as measured by Smart Investing & Trading Score) of various
stocks in the Europe Index. Quick View: Move mouse or cursor over stock symbol (ticker) to view short-term technical chart and over stock name to view long term chart. Click on  to add stock symbol to your watchlist and to add stock symbol to your watchlist and  to view watchlist. Click on any ticker or stock name for detailed market intelligence report for that stock. to view watchlist. Click on any ticker or stock name for detailed market intelligence report for that stock. |
12Stocks.com Performance of Stocks in Europe Index
| Ticker | Stock Name | Watchlist | Category | Recent Price | Smart Investing & Trading Score | Change % | Weekly Change% |
| AUTL | Autolus |   | Health Care | 3.94 | 10 | -1.38% | -1.38% |
| AON | Aon | | Financials | 281.04 | 0 | -1.40% | -1.40% |
| MLTX | MoonLake Immuno | | Health Care | 41.73 | 10 | -1.75% | -1.75% |
| CNTG | Centogene N.V | | Health Care | 0.48 | 42 | -1.82% | -1.82% |
| LYG | Lloyds Banking | | Financials | 2.56 | 83 | -1.92% | -1.92% |
| EVTL | Vertical Aerospace | | Industrials | 0.78 | 61 | -2.35% | -2.35% |
| QURE | uniQure N.V | | Health Care | 4.39 | 35 | -3.09% | -3.09% |
| MOR | MorphoSys AG | | Health Care | 17.28 | 31 | -4.21% | -4.21% |
| MTAL | Metals Acquisition | | Financials | 13.30 | 41 | -4.25% | -4.25% |
| PHAR | Pharming | | Health Care | 9.80 | 20 | -6.22% | -6.22% |
| ARQQ | Arqit Quantum | | Technology | 0.46 | 10 | -6.44% | -6.44% |
| MYNA | Mynaric AG | | Technology | 5.30 | 45 | -8.46% | -8.46% |
| DB | Deutsche Bank | | Financials | 16.24 | 51 | -8.61% | -8.61% |
| PSNYW | Polestar Automotive | | Services & Goods | 0.14 | 25 | -10.12% | -10.12% |
| ADXN | Addex | | Health Care | 7.56 | 0 | -53.04% | -53.04% |
| For chart view version of above stock list: Chart View ➞ 0 - 25 , 25 - 50 , 50 - 75 , 75 - 100 , 100 - 125 , 125 - 150 | ||
 | Click To Change The Sort Order: By Market Cap or Company Size Performance: Year-to-date, Week and Day |  |
|
Get the most comprehensive stock market coverage daily at 12Stocks.com ➞ Best Stocks Today ➞ Best Stocks Weekly ➞ Best Stocks Year-to-Date ➞ Best Stocks Trends ➞  Best Stocks Today 12Stocks.com Best Nasdaq Stocks ➞ Best S&P 500 Stocks ➞ Best Tech Stocks ➞ Best Biotech Stocks ➞ |
| Detailed Overview of Europe Stocks |
| Europe Technical Overview, Leaders & Laggards, Top Europe ETF Funds & Detailed Europe Stocks List, Charts, Trends & More |
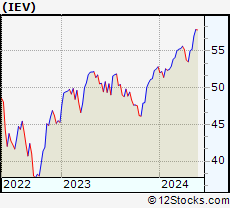
| Europe: Technical Analysis, Trends & YTD Performance | |
 IEV Weekly Chart |
|
| Long Term Trend: Very Good | |
| Medium Term Trend: Good | |
 IEV Daily Chart |
|
| Short Term Trend: Very Good | |
| Overall Trend Score: 100 | |
| YTD Performance: 4.31% | |
| **Trend Scores & Views Are Only For Educational Purposes And Not For Investing | |
| 12Stocks.com: Investing in Europe Index using Exchange Traded Funds | |
|
The following table shows list of key exchange traded funds (ETF) that
help investors play Europe stock market. For detailed view, check out our ETF Funds section of our website. Quick View: Move mouse or cursor over ETF symbol (ticker) to view short-term technical chart and over ETF name to view long term chart. Click on ticker or stock name for detailed view. Click on to add stock symbol to your watchlist and to view watchlist. |
12Stocks.com List of ETFs that track Europe Index
| Ticker | ETF Name | Watchlist | Recent Price | Smart Investing & Trading Score | Change % | Week % | Year-to-date % |
| IEV | Europe | | 55.14 | 100 | 0.16 | 0.16 | 4.31% |
| VGK | Europe | | 66.60 | 88 | 0.32 | 0.32 | 3.29% |
| EURL | Europe Bull 3X | | 25.03 | 95 | 0.79 | 0.79 | 5.57% |
| EPV | Short Europe | | 8.02 | 5 | -0.43 | -0.43 | -6.64% |
| IEUS | Europe Small-Cap | | 55.36 | 71 | -0.22 | -0.22 | -1.49% |
| HEDJ | Europe Hedged Equity | | 47.78 | 83 | 0.06 | 0.06 | 11.51% |
| EUSC | Europe Hedged SmallCap | | 38.71 | 95 | 0.65 | 0.65 | 7.52% |
| EUFN | Europe Financials | | 22.50 | 83 | 0.18 | 0.18 | 7.35% |
| EWU | United Kingdom | | 34.98 | 100 | 0.43 | 0.43 | 5.84% |
| EWQ | France | | 40.60 | 73 | -0.17 | -0.17 | 3.62% |
| EWG | Germany | | 30.98 | 78 | 0.06 | 0.06 | 4.34% |
| EWL | Switzerland | | 46.08 | 57 | 0.30 | 0.3 | -4.54% |
| EWN | Netherlands | | 48.76 | 90 | 0.72 | 0.72 | 9.25% |
| EWI | Italy | | 37.32 | 78 | 0.21 | 0.21 | 9.99% |
| FEP | Europe AlphaDEX | | 37.54 | 83 | 0.13 | 0.13 | 3.36% |
| FDD | European Sel Div | | 12.05 | 100 | 0.71 | 0.71 | -0.21% |
| FXE | Euro | | 99.07 | 57 | 0.16 | 0.16 | -2.91% |
| 12Stocks.com: Charts, Trends, Fundamental Data and Performances of Europe Stocks | |
|
We now take in-depth look at all Europe stocks including charts, multi-period performances and overall trends (as measured by Smart Investing & Trading Score). One can sort Europe stocks (click link to choose) by Daily, Weekly and by Year-to-Date performances. Also, one can sort by size of the company or by market capitalization. |
| Select Your Default Chart Type: | |||||
| |||||
| Click on stock symbol or name for detailed view. Click on to add stock symbol to your watchlist and to view watchlist. Quick View: Move mouse or cursor over "Daily" to quickly view daily technical stock chart and over "Weekly" to view weekly technical stock chart. | |||||

 | AUTL Autolus Therapeutics plc |
| Sector: Health Care | |
| SubSector: Biotechnology | |
| MarketCap: 296.285 Millions | |
| Recent Price: 3.94 Smart Investing & Trading Score: 10 | |
| Day Percent Change: -1.38% Day Change: -0.06 | |
| Week Change: -1.38% Year-to-date Change: -38.7% | |
| AUTL Links: Profile News Message Board | |
| Charts:- Daily , Weekly | |
| Add AUTL to Watchlist: View: Get Complete AUTL Trend Analysis ➞ | |
 | AON Aon plc |
| Sector: Financials | |
| SubSector: Insurance Brokers | |
| MarketCap: 36870.1 Millions | |
| Recent Price: 281.04 Smart Investing & Trading Score: 0 | |
| Day Percent Change: -1.40% Day Change: -3.99 | |
| Week Change: -1.4% Year-to-date Change: -3.4% | |
| AON Links: Profile News Message Board | |
| Charts:- Daily , Weekly | |
| Add AON to Watchlist: View: Get Complete AON Trend Analysis ➞ | |
 | MLTX MoonLake Immunotherapeutics |
| Sector: Health Care | |
| SubSector: Biotechnology | |
| MarketCap: 2670 Millions | |
| Recent Price: 41.73 Smart Investing & Trading Score: 10 | |
| Day Percent Change: -1.75% Day Change: -0.74 | |
| Week Change: -1.75% Year-to-date Change: -33.5% | |
| MLTX Links: Profile News Message Board | |
| Charts:- Daily , Weekly | |
| Add MLTX to Watchlist: View: Get Complete MLTX Trend Analysis ➞ | |
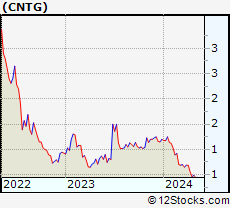 | CNTG Centogene N.V. |
| Sector: Health Care | |
| SubSector: Medical Laboratories & Research | |
| MarketCap: 455.8 Millions | |
| Recent Price: 0.48 Smart Investing & Trading Score: 42 | |
| Day Percent Change: -1.82% Day Change: -0.01 | |
| Week Change: -1.82% Year-to-date Change: -60.0% | |
| CNTG Links: Profile News Message Board | |
| Charts:- Daily , Weekly | |
| Add CNTG to Watchlist: View: Get Complete CNTG Trend Analysis ➞ | |
 | LYG Lloyds Banking Group plc |
| Sector: Financials | |
| SubSector: Foreign Money Center Banks | |
| MarketCap: 28885.4 Millions | |
| Recent Price: 2.56 Smart Investing & Trading Score: 83 | |
| Day Percent Change: -1.92% Day Change: -0.05 | |
| Week Change: -1.92% Year-to-date Change: 7.1% | |
| LYG Links: Profile News Message Board | |
| Charts:- Daily , Weekly | |
| Add LYG to Watchlist: View: Get Complete LYG Trend Analysis ➞ | |
 | EVTL Vertical Aerospace Ltd. |
| Sector: Industrials | |
| SubSector: Aerospace & Defense | |
| MarketCap: 403 Millions | |
| Recent Price: 0.78 Smart Investing & Trading Score: 61 | |
| Day Percent Change: -2.35% Day Change: -0.02 | |
| Week Change: -2.35% Year-to-date Change: 14.2% | |
| EVTL Links: Profile News Message Board | |
| Charts:- Daily , Weekly | |
| Add EVTL to Watchlist: View: Get Complete EVTL Trend Analysis ➞ | |
 | QURE uniQure N.V. |
| Sector: Health Care | |
| SubSector: Biotechnology | |
| MarketCap: 2267.25 Millions | |
| Recent Price: 4.39 Smart Investing & Trading Score: 35 | |
| Day Percent Change: -3.09% Day Change: -0.14 | |
| Week Change: -3.09% Year-to-date Change: -35.2% | |
| QURE Links: Profile News Message Board | |
| Charts:- Daily , Weekly | |
| Add QURE to Watchlist: View: Get Complete QURE Trend Analysis ➞ | |
 | MOR MorphoSys AG |
| Sector: Health Care | |
| SubSector: Biotechnology | |
| MarketCap: 2636.85 Millions | |
| Recent Price: 17.28 Smart Investing & Trading Score: 31 | |
| Day Percent Change: -4.21% Day Change: -0.76 | |
| Week Change: -4.21% Year-to-date Change: 74.6% | |
| MOR Links: Profile News Message Board | |
| Charts:- Daily , Weekly | |
| Add MOR to Watchlist: View: Get Complete MOR Trend Analysis ➞ | |
 | MTAL Metals Acquisition Limited |
| Sector: Financials | |
| SubSector: SPAC | |
| MarketCap: 497 Millions | |
| Recent Price: 13.30 Smart Investing & Trading Score: 41 | |
| Day Percent Change: -4.25% Day Change: -0.59 | |
| Week Change: -4.25% Year-to-date Change: 20.5% | |
| MTAL Links: Profile News Message Board | |
| Charts:- Daily , Weekly | |
| Add MTAL to Watchlist: View: Get Complete MTAL Trend Analysis ➞ | |
 | PHAR Pharming Group N.V. |
| Sector: Health Care | |
| SubSector: Biotechnology | |
| MarketCap: 808 Millions | |
| Recent Price: 9.80 Smart Investing & Trading Score: 20 | |
| Day Percent Change: -6.22% Day Change: -0.65 | |
| Week Change: -6.22% Year-to-date Change: -14.3% | |
| PHAR Links: Profile News Message Board | |
| Charts:- Daily , Weekly | |
| Add PHAR to Watchlist: View: Get Complete PHAR Trend Analysis ➞ | |
 | ARQQ Arqit Quantum Inc. |
| Sector: Technology | |
| SubSector: Software - Infrastructure | |
| MarketCap: 165 Millions | |
| Recent Price: 0.46 Smart Investing & Trading Score: 10 | |
| Day Percent Change: -6.44% Day Change: -0.03 | |
| Week Change: -6.44% Year-to-date Change: -0.2% | |
| ARQQ Links: Profile News Message Board | |
| Charts:- Daily , Weekly | |
| Add ARQQ to Watchlist: View: Get Complete ARQQ Trend Analysis ➞ | |
 | MYNA Mynaric AG |
| Sector: Technology | |
| SubSector: Communication Equipment | |
| MarketCap: 152 Millions | |
| Recent Price: 5.30 Smart Investing & Trading Score: 45 | |
| Day Percent Change: -8.46% Day Change: -0.49 | |
| Week Change: -8.46% Year-to-date Change: -14.4% | |
| MYNA Links: Profile News Message Board | |
| Charts:- Daily , Weekly | |
| Add MYNA to Watchlist: View: Get Complete MYNA Trend Analysis ➞ | |
 | DB Deutsche Bank Aktiengesellschaft |
| Sector: Financials | |
| SubSector: Foreign Regional Banks | |
| MarketCap: 14500.5 Millions | |
| Recent Price: 16.24 Smart Investing & Trading Score: 51 | |
| Day Percent Change: -8.61% Day Change: -1.53 | |
| Week Change: -8.61% Year-to-date Change: 19.9% | |
| DB Links: Profile News Message Board | |
| Charts:- Daily , Weekly | |
| Add DB to Watchlist: View: Get Complete DB Trend Analysis ➞ | |
 | PSNYW Polestar Automotive Holding UK PLC |
| Sector: Services & Goods | |
| SubSector: Auto Manufacturers | |
| MarketCap: 1450 Millions | |
| Recent Price: 0.14 Smart Investing & Trading Score: 25 | |
| Day Percent Change: -10.12% Day Change: -0.02 | |
| Week Change: -10.12% Year-to-date Change: -41.0% | |
| PSNYW Links: Profile News Message Board | |
| Charts:- Daily , Weekly | |
| Add PSNYW to Watchlist: View: Get Complete PSNYW Trend Analysis ➞ | |
 | ADXN Addex Therapeutics Ltd |
| Sector: Health Care | |
| SubSector: Biotechnology | |
| MarketCap: 51487 Millions | |
| Recent Price: 7.56 Smart Investing & Trading Score: 0 | |
| Day Percent Change: -53.04% Day Change: -8.54 | |
| Week Change: -53.04% Year-to-date Change: 24.1% | |
| ADXN Links: Profile News Message Board | |
| Charts:- Daily , Weekly | |
| Add ADXN to Watchlist: View: Get Complete ADXN Trend Analysis ➞ | |
| For tabular summary view of above stock list: Summary View ➞ 0 - 25 , 25 - 50 , 50 - 75 , 75 - 100 , 100 - 125 , 125 - 150 | ||
| Click To Change The Sort Order: By Market Cap or Company Size Performance: Year-to-date, Week and Day | |
| Select Chart Type: | ||
|
Best Stocks Today 12Stocks.com |
© 2024 12Stocks.com Terms & Conditions Privacy Contact Us
All Information Provided Only For Education And Not To Be Used For Investing or Trading. See Terms & Conditions


One More Thing ... Get Best Stocks Delivered Daily!
Never Ever Miss A Move With Our Top Ten Stocks Lists
Find Best Stocks In Any Market - Bull or Bear Market
Take A Peek At Our Top Ten Stocks Lists: Daily, Weekly, Year-to-Date & Top Trends
Find Best Stocks In Any Market - Bull or Bear Market
Take A Peek At Our Top Ten Stocks Lists: Daily, Weekly, Year-to-Date & Top Trends
Europe Stocks With Best Up Trends [0-bearish to 100-bullish]: Koninklijke Philips[100], NXP Semiconductors[100], Aberdeen Emerging[100], Aegon N.V[100], WPP [100], HSBC [100], Unilever [100], AstraZeneca [100], GlaxoSmithKline [95], Coca-Cola European[95], LivaNova [93]
Best Europe Stocks Year-to-Date:
NuCana [1265.79%], Affimed N.V[776.8%], ADC [171.08%], NewAmsterdam Pharma[93.51%], MorphoSys AG[74.55%], Renalytix AI[72.56%], Merus N.V[64.07%], Spotify [53.34%], Summit [49.23%], Adaptimmune [44.39%], Criteo S.A[43.33%] Best Europe Stocks This Week:
Koninklijke Philips[26.77%], Exscientia [14.5%], Affimed N.V[8.95%], Innate Pharma[8.37%], CureVac N.V[8.15%], Renalytix AI[7.3%], KNOT Offshore[7.21%], Adaptimmune [6.51%], Oculis Holding[5.99%], Super [4.65%], Nanobiotix S.A[4.36%] Best Europe Stocks Daily:
Koninklijke Philips[26.77%], Exscientia [14.50%], Affimed N.V[8.95%], Innate Pharma[8.37%], CureVac N.V[8.15%], Renalytix AI[7.30%], KNOT Offshore[7.21%], Adaptimmune [6.51%], Oculis Holding[5.99%], Super [4.65%], Nanobiotix S.A[4.36%]