
 Login Sign Up


| |||||
 |  | ||||

| 12Stocks.com Market Intelligence |
Best Consumer Services Stocks
| In a hurry? Services & Goods Stocks: Performance Trends Table, Stock Charts
Sort Consumer Services: Daily, Weekly, Year-to-Date, Market Cap & Trends. Filter Services & Goods stocks list by size: All Large Mid-Range Small |
| 12Stocks.com Consumer Services Stocks Performances & Trends Daily | |||||||||
|
|  The overall Smart Investing & Trading Score is 35 (0-bearish to 100-bullish) which puts Consumer Services sector in short term bearish to neutral trend. The Smart Investing & Trading Score from previous trading session is 7 and hence an improvement of trend.
| ||||||||
Here are the Smart Investing & Trading Scores of the most requested Consumer Services stocks at 12Stocks.com (click stock name for detailed review):
|


| Consider signing up for our daily 12Stocks.com "Best Stocks Newsletter". You will never ever miss a big stock move again! |
| 12Stocks.com: Investing in Consumer Services sector with Stocks | |
|
The following table helps investors and traders sort through current performance and trends (as measured by Smart Investing & Trading Score) of various
stocks in the Consumer Services sector. Quick View: Move mouse or cursor over stock symbol (ticker) to view short-term Technical chart and over stock name to view long term chart. Click on  to add stock symbol to your watchlist and to add stock symbol to your watchlist and  to view watchlist. Click on any ticker or stock name for detailed market intelligence report for that stock. to view watchlist. Click on any ticker or stock name for detailed market intelligence report for that stock. |
12Stocks.com Performance of Stocks in Consumer Services Sector
| Ticker | Stock Name | Watchlist | Category | Recent Price | Smart Investing & Trading Score | Change % | YTD Change% |
| PRDO | Perdoceo Education |   | Education | 24.17 | 100 | 31.79 | 37.64% |
| GCI | Gannett Co | | Publishing | 3.06 | 100 | 26.97 | 33.04% |
| CSSEP | Chicken Soup | | Broadcasting | 2.95 | 93 | 20.41 | -34.30% |
| GME | GameStop | | Retail | 12.76 | 74 | 16.96 | -27.21% |
| PLCE | Children s | | Apparel | 7.70 | 42 | 14.58 | -66.84% |
| BIRD | Allbirds | | Apparel Retail | 0.61 | 22 | 12.36 | -50.40% |
| BLNK | Blink Charging | | Services | 2.88 | 74 | 10.96 | -14.90% |
| JMIA | Jumia Technologies | | Retail | 4.90 | 52 | 9.13 | 38.81% |
| EM | Smart Share | | Services | 0.87 | 100 | 8.63 | 68.74% |
| LL | Lumber Liquidators | | Retail | 1.65 | 44 | 8.55 | -57.69% |
| SSP | E.W. Scripps | | Broadcasting | 4.22 | 69 | 8.21 | -47.18% |
| EVI | EVI Industries | | Consumer Services | 23.24 | 65 | 7.25 | -2.06% |
| CNTY | Century Casinos | | Casinos | 3.12 | 39 | 7.22 | -36.07% |
| WCC | WESCO | | Equipment | 165.08 | 100 | 6.92 | -5.06% |
| CCO | Clear Channel | | Marketing | 1.55 | 64 | 6.90 | -14.84% |
| TCS | Container Store | | Retail | 0.91 | 37 | 6.85 | -60.09% |
| EVC | Entravision | | Broadcasting | 2.30 | 69 | 5.50 | -44.84% |
| ELA | Envela | | Retail | 4.62 | 100 | 5.48 | -4.94% |
| AMC | AMC Entertainment | | Entertainment | 3.13 | 40 | 5.39 | -48.86% |
| REKR | Rekor Systems | | Security | 1.88 | 27 | 5.03 | -43.29% |
| DFIN | Donnelley Financial | | Services | 62.42 | 0 | 4.85 | 0.08% |
| AMRC | Ameresco | | Services | 21.45 | 93 | 4.69 | -32.27% |
| ASPS | Altisource Portfolio | | Services | 2.06 | 74 | 4.57 | -42.13% |
| OB | Outbrain | | Internet Content & Information | 4.42 | 100 | 4.49 | 0.91% |
| LE | Lands | | Retail | 14.17 | 93 | 4.42 | 48.22% |
| For chart view version of above stock list: Chart View ➞ 0 - 25 , 25 - 50 , 50 - 75 , 75 - 100 , 100 - 125 , 125 - 150 , 150 - 175 , 175 - 200 , 200 - 225 | ||
 | Click To Change The Sort Order: By Market Cap or Company Size Performance: Year-to-date, Week and Day |  |
|
Get the most comprehensive stock market coverage daily at 12Stocks.com ➞ Best Stocks Today ➞ Best Stocks Weekly ➞ Best Stocks Year-to-Date ➞ Best Stocks Trends ➞  Best Stocks Today 12Stocks.com Best Nasdaq Stocks ➞ Best S&P 500 Stocks ➞ Best Tech Stocks ➞ Best Biotech Stocks ➞ |
| Detailed Overview of Consumer Services Stocks |
| Consumer Services Technical Overview, Leaders & Laggards, Top Consumer Services ETF Funds & Detailed Consumer Services Stocks List, Charts, Trends & More |
| Consumer Services Sector: Technical Analysis, Trends & YTD Performance | |
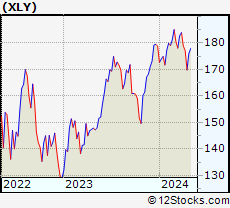
| Consumer Services sector is composed of stocks
from retail, entertainment, media/publishing, consumer goods
and services subsectors. Consumer Services sector, as represented by XLY, an exchange-traded fund [ETF] that holds basket of Consumer Services stocks (e.g, Walmart, Alibaba) is down by -1.17% and is currently underperforming the overall market by -6.79% year-to-date. Below is a quick view of Technical charts and trends: |
|
 XLY Weekly Chart |
|
| Long Term Trend: Not Good | |
| Medium Term Trend: Deteriorating | |
 XLY Daily Chart |
|
| Short Term Trend: Deteriorating | |
| Overall Trend Score: 35 | |
| YTD Performance: -1.17% | |
| **Trend Scores & Views Are Only For Educational Purposes And Not For Investing | |
| 12Stocks.com: Top Performing Consumer Services Sector Stocks | ||||||||||||||||||||||||||||||||||||||||||||||||
 The top performing Consumer Services sector stocks year to date are
Now, more recently, over last week, the top performing Consumer Services sector stocks on the move are


|
||||||||||||||||||||||||||||||||||||||||||||||||
| 12Stocks.com: Investing in Consumer Services Sector using Exchange Traded Funds | |
|
The following table shows list of key exchange traded funds (ETF) that
help investors track Consumer Services Index. For detailed view, check out our ETF Funds section of our website. Quick View: Move mouse or cursor over ETF symbol (ticker) to view short-term Technical chart and over ETF name to view long term chart. Click on ticker or stock name for detailed view. Click on to add stock symbol to your watchlist and to view watchlist. |
12Stocks.com List of ETFs that track Consumer Services Index
| Ticker | ETF Name | Watchlist | Recent Price | Smart Investing & Trading Score | Change % | Week % | Year-to-date % |
| XLY | Consumer Discret Sel | | 176.72 | 35 | 1.26 | 0.46 | -1.17% |
| RTH | Retail | | 199.00 | 7 | 1.49 | -1.03 | 5.72% |
| IYC | Consumer Services | | 78.35 | 7 | 1.28 | -0.01 | 3.41% |
| XRT | Retail | | 72.49 | 25 | 1.70 | -1 | 0.24% |
| IYK | Consumer Goods | | 66.46 | 63 | 0.51 | -0.45 | 4% |
| UCC | Consumer Services | | 33.96 | 49 | 1.98 | -0.59 | -5.42% |
| RETL | Retail Bull 3X | | 8.53 | 5 | 5.44 | -3.4 | -6.47% |
| RXI | Globl Consumer Discretionary | | 161.47 | 27 | 1.46 | 0.18 | 1.52% |
| SCC | Short Consumer Services | | 15.66 | 88 | -1.97 | -0.73 | 2.23% |
| UGE | Consumer Goods | | 16.92 | 80 | 0.39 | -1.46 | 7.49% |
| 12Stocks.com: Charts, Trends, Fundamental Data and Performances of Consumer Services Stocks | |
|
We now take in-depth look at all Consumer Services stocks including charts, multi-period performances and overall trends (as measured by Smart Investing & Trading Score). One can sort Consumer Services stocks (click link to choose) by Daily, Weekly and by Year-to-Date performances. Also, one can sort by size of the company or by market capitalization. |
| Select Your Default Chart Type: | |||||
| |||||
| Click on stock symbol or name for detailed view. Click on to add stock symbol to your watchlist and to view watchlist. Quick View: Move mouse or cursor over "Daily" to quickly view daily Technical stock chart and over "Weekly" to view weekly Technical stock chart. | |||||

 | PRDO Perdoceo Education Corporation |
| Sector: Services & Goods | |
| SubSector: Education & Training Services | |
| MarketCap: 631.006 Millions | |
| Recent Price: 24.17 Smart Investing & Trading Score: 100 | |
| Day Percent Change: 31.79% Day Change: 5.83 | |
| Week Change: 28.15% Year-to-date Change: 37.6% | |
| PRDO Links: Profile News Message Board | |
| Charts:- Daily , Weekly | |
| Add PRDO to Watchlist: View: Get Complete PRDO Trend Analysis ➞ | |
 | GCI Gannett Co., Inc. |
| Sector: Services & Goods | |
| SubSector: Publishing - Newspapers | |
| MarketCap: 222.322 Millions | |
| Recent Price: 3.06 Smart Investing & Trading Score: 100 | |
| Day Percent Change: 26.97% Day Change: 0.65 | |
| Week Change: 18.6% Year-to-date Change: 33.0% | |
| GCI Links: Profile News Message Board | |
| Charts:- Daily , Weekly | |
| Add GCI to Watchlist: View: Get Complete GCI Trend Analysis ➞ | |
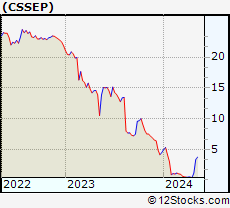 | CSSEP Chicken Soup for the Soul Entertainment, Inc. |
| Sector: Services & Goods | |
| SubSector: Broadcasting - TV | |
| MarketCap: 195.763 Millions | |
| Recent Price: 2.95 Smart Investing & Trading Score: 93 | |
| Day Percent Change: 20.41% Day Change: 0.50 | |
| Week Change: 156.52% Year-to-date Change: -34.3% | |
| CSSEP Links: Profile News Message Board | |
| Charts:- Daily , Weekly | |
| Add CSSEP to Watchlist: View: Get Complete CSSEP Trend Analysis ➞ | |
 | GME GameStop Corp. |
| Sector: Services & Goods | |
| SubSector: Electronics Stores | |
| MarketCap: 257.8 Millions | |
| Recent Price: 12.76 Smart Investing & Trading Score: 74 | |
| Day Percent Change: 16.96% Day Change: 1.85 | |
| Week Change: 7.23% Year-to-date Change: -27.2% | |
| GME Links: Profile News Message Board | |
| Charts:- Daily , Weekly | |
| Add GME to Watchlist: View: Get Complete GME Trend Analysis ➞ | |
 | PLCE The Children s Place, Inc. |
| Sector: Services & Goods | |
| SubSector: Apparel Stores | |
| MarketCap: 303.608 Millions | |
| Recent Price: 7.70 Smart Investing & Trading Score: 42 | |
| Day Percent Change: 14.58% Day Change: 0.98 | |
| Week Change: 8.6% Year-to-date Change: -66.8% | |
| PLCE Links: Profile News Message Board | |
| Charts:- Daily , Weekly | |
| Add PLCE to Watchlist: View: Get Complete PLCE Trend Analysis ➞ | |
 | BIRD Allbirds, Inc. |
| Sector: Services & Goods | |
| SubSector: Apparel Retail | |
| MarketCap: 184 Millions | |
| Recent Price: 0.61 Smart Investing & Trading Score: 22 | |
| Day Percent Change: 12.36% Day Change: 0.07 | |
| Week Change: -0.41% Year-to-date Change: -50.4% | |
| BIRD Links: Profile News Message Board | |
| Charts:- Daily , Weekly | |
| Add BIRD to Watchlist: View: Get Complete BIRD Trend Analysis ➞ | |
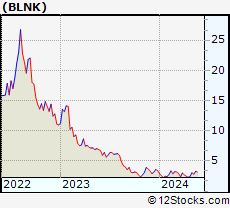 | BLNK Blink Charging Co. |
| Sector: Services & Goods | |
| SubSector: Business Services | |
| MarketCap: 44.4782 Millions | |
| Recent Price: 2.88 Smart Investing & Trading Score: 74 | |
| Day Percent Change: 10.96% Day Change: 0.28 | |
| Week Change: 19.21% Year-to-date Change: -14.9% | |
| BLNK Links: Profile News Message Board | |
| Charts:- Daily , Weekly | |
| Add BLNK to Watchlist: View: Get Complete BLNK Trend Analysis ➞ | |
 | JMIA Jumia Technologies AG |
| Sector: Services & Goods | |
| SubSector: Specialty Retail, Other | |
| MarketCap: 203.644 Millions | |
| Recent Price: 4.90 Smart Investing & Trading Score: 52 | |
| Day Percent Change: 9.13% Day Change: 0.41 | |
| Week Change: 7.93% Year-to-date Change: 38.8% | |
| JMIA Links: Profile News Message Board | |
| Charts:- Daily , Weekly | |
| Add JMIA to Watchlist: View: Get Complete JMIA Trend Analysis ➞ | |
 | EM Smart Share Global Limited |
| Sector: Services & Goods | |
| SubSector: Personal Services | |
| MarketCap: 238 Millions | |
| Recent Price: 0.87 Smart Investing & Trading Score: 100 | |
| Day Percent Change: 8.63% Day Change: 0.07 | |
| Week Change: 39.89% Year-to-date Change: 68.7% | |
| EM Links: Profile News Message Board | |
| Charts:- Daily , Weekly | |
| Add EM to Watchlist: View: Get Complete EM Trend Analysis ➞ | |
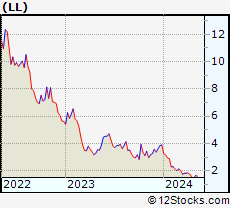 | LL Lumber Liquidators Holdings, Inc. |
| Sector: Services & Goods | |
| SubSector: Home Improvement Stores | |
| MarketCap: 143.352 Millions | |
| Recent Price: 1.65 Smart Investing & Trading Score: 44 | |
| Day Percent Change: 8.55% Day Change: 0.13 | |
| Week Change: 10% Year-to-date Change: -57.7% | |
| LL Links: Profile News Message Board | |
| Charts:- Daily , Weekly | |
| Add LL to Watchlist: View: Get Complete LL Trend Analysis ➞ | |
 | SSP The E.W. Scripps Company |
| Sector: Services & Goods | |
| SubSector: Broadcasting - TV | |
| MarketCap: 766.163 Millions | |
| Recent Price: 4.22 Smart Investing & Trading Score: 69 | |
| Day Percent Change: 8.21% Day Change: 0.32 | |
| Week Change: 14.05% Year-to-date Change: -47.2% | |
| SSP Links: Profile News Message Board | |
| Charts:- Daily , Weekly | |
| Add SSP to Watchlist: View: Get Complete SSP Trend Analysis ➞ | |
 | EVI EVI Industries, Inc. |
| Sector: Services & Goods | |
| SubSector: Consumer Services | |
| MarketCap: 207.448 Millions | |
| Recent Price: 23.24 Smart Investing & Trading Score: 65 | |
| Day Percent Change: 7.25% Day Change: 1.57 | |
| Week Change: 8.4% Year-to-date Change: -2.1% | |
| EVI Links: Profile News Message Board | |
| Charts:- Daily , Weekly | |
| Add EVI to Watchlist: View: Get Complete EVI Trend Analysis ➞ | |
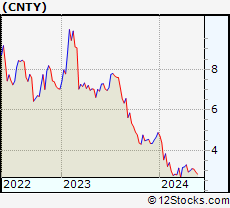 | CNTY Century Casinos, Inc. |
| Sector: Services & Goods | |
| SubSector: Resorts & Casinos | |
| MarketCap: 41.3794 Millions | |
| Recent Price: 3.12 Smart Investing & Trading Score: 39 | |
| Day Percent Change: 7.22% Day Change: 0.21 | |
| Week Change: 4% Year-to-date Change: -36.1% | |
| CNTY Links: Profile News Message Board | |
| Charts:- Daily , Weekly | |
| Add CNTY to Watchlist: View: Get Complete CNTY Trend Analysis ➞ | |
 | WCC WESCO International, Inc. |
| Sector: Services & Goods | |
| SubSector: Industrial Equipment Wholesale | |
| MarketCap: 824.358 Millions | |
| Recent Price: 165.08 Smart Investing & Trading Score: 100 | |
| Day Percent Change: 6.92% Day Change: 10.68 | |
| Week Change: 5.96% Year-to-date Change: -5.1% | |
| WCC Links: Profile News Message Board | |
| Charts:- Daily , Weekly | |
| Add WCC to Watchlist: View: Get Complete WCC Trend Analysis ➞ | |
 | CCO Clear Channel Outdoor Holdings, Inc. |
| Sector: Services & Goods | |
| SubSector: Marketing Services | |
| MarketCap: 312.715 Millions | |
| Recent Price: 1.55 Smart Investing & Trading Score: 64 | |
| Day Percent Change: 6.90% Day Change: 0.10 | |
| Week Change: 7.64% Year-to-date Change: -14.8% | |
| CCO Links: Profile News Message Board | |
| Charts:- Daily , Weekly | |
| Add CCO to Watchlist: View: Get Complete CCO Trend Analysis ➞ | |
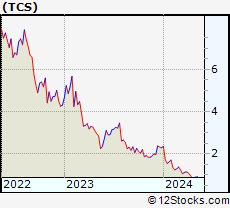 | TCS The Container Store Group, Inc. |
| Sector: Services & Goods | |
| SubSector: Specialty Retail, Other | |
| MarketCap: 142.644 Millions | |
| Recent Price: 0.91 Smart Investing & Trading Score: 37 | |
| Day Percent Change: 6.85% Day Change: 0.06 | |
| Week Change: 5.18% Year-to-date Change: -60.1% | |
| TCS Links: Profile News Message Board | |
| Charts:- Daily , Weekly | |
| Add TCS to Watchlist: View: Get Complete TCS Trend Analysis ➞ | |
 | EVC Entravision Communications Corporation |
| Sector: Services & Goods | |
| SubSector: Broadcasting - TV | |
| MarketCap: 171.763 Millions | |
| Recent Price: 2.30 Smart Investing & Trading Score: 69 | |
| Day Percent Change: 5.50% Day Change: 0.12 | |
| Week Change: 10.05% Year-to-date Change: -44.8% | |
| EVC Links: Profile News Message Board | |
| Charts:- Daily , Weekly | |
| Add EVC to Watchlist: View: Get Complete EVC Trend Analysis ➞ | |
 | ELA Envela Corporation |
| Sector: Services & Goods | |
| SubSector: Specialty Retail, Other | |
| MarketCap: 73.5944 Millions | |
| Recent Price: 4.62 Smart Investing & Trading Score: 100 | |
| Day Percent Change: 5.48% Day Change: 0.24 | |
| Week Change: 5.48% Year-to-date Change: -4.9% | |
| ELA Links: Profile News Message Board | |
| Charts:- Daily , Weekly | |
| Add ELA to Watchlist: View: Get Complete ELA Trend Analysis ➞ | |
 | AMC AMC Entertainment Holdings, Inc. |
| Sector: Services & Goods | |
| SubSector: Movie Production, Theaters | |
| MarketCap: 415.929 Millions | |
| Recent Price: 3.13 Smart Investing & Trading Score: 40 | |
| Day Percent Change: 5.39% Day Change: 0.16 | |
| Week Change: -8.21% Year-to-date Change: -48.9% | |
| AMC Links: Profile News Message Board | |
| Charts:- Daily , Weekly | |
| Add AMC to Watchlist: View: Get Complete AMC Trend Analysis ➞ | |
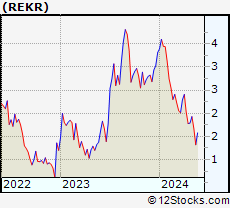 | REKR Rekor Systems, Inc. |
| Sector: Services & Goods | |
| SubSector: Security & Protection Services | |
| MarketCap: 59.2903 Millions | |
| Recent Price: 1.88 Smart Investing & Trading Score: 27 | |
| Day Percent Change: 5.03% Day Change: 0.09 | |
| Week Change: 5.03% Year-to-date Change: -43.3% | |
| REKR Links: Profile News Message Board | |
| Charts:- Daily , Weekly | |
| Add REKR to Watchlist: View: Get Complete REKR Trend Analysis ➞ | |
 | DFIN Donnelley Financial Solutions, Inc. |
| Sector: Services & Goods | |
| SubSector: Business Services | |
| MarketCap: 229.882 Millions | |
| Recent Price: 62.42 Smart Investing & Trading Score: 0 | |
| Day Percent Change: 4.85% Day Change: 2.89 | |
| Week Change: -0.95% Year-to-date Change: 0.1% | |
| DFIN Links: Profile News Message Board | |
| Charts:- Daily , Weekly | |
| Add DFIN to Watchlist: View: Get Complete DFIN Trend Analysis ➞ | |
 | AMRC Ameresco, Inc. |
| Sector: Services & Goods | |
| SubSector: Technical Services | |
| MarketCap: 898.91 Millions | |
| Recent Price: 21.45 Smart Investing & Trading Score: 93 | |
| Day Percent Change: 4.69% Day Change: 0.96 | |
| Week Change: -0.14% Year-to-date Change: -32.3% | |
| AMRC Links: Profile News Message Board | |
| Charts:- Daily , Weekly | |
| Add AMRC to Watchlist: View: Get Complete AMRC Trend Analysis ➞ | |
 | ASPS Altisource Portfolio Solutions S.A. |
| Sector: Services & Goods | |
| SubSector: Business Services | |
| MarketCap: 120.382 Millions | |
| Recent Price: 2.06 Smart Investing & Trading Score: 74 | |
| Day Percent Change: 4.57% Day Change: 0.09 | |
| Week Change: 4.57% Year-to-date Change: -42.1% | |
| ASPS Links: Profile News Message Board | |
| Charts:- Daily , Weekly | |
| Add ASPS to Watchlist: View: Get Complete ASPS Trend Analysis ➞ | |
 | OB Outbrain Inc. |
| Sector: Services & Goods | |
| SubSector: Internet Content & Information | |
| MarketCap: 250 Millions | |
| Recent Price: 4.42 Smart Investing & Trading Score: 100 | |
| Day Percent Change: 4.49% Day Change: 0.19 | |
| Week Change: 5.74% Year-to-date Change: 0.9% | |
| OB Links: Profile News Message Board | |
| Charts:- Daily , Weekly | |
| Add OB to Watchlist: View: Get Complete OB Trend Analysis ➞ | |
 | LE Lands End, Inc. |
| Sector: Services & Goods | |
| SubSector: Catalog & Mail Order Houses | |
| MarketCap: 268.692 Millions | |
| Recent Price: 14.17 Smart Investing & Trading Score: 93 | |
| Day Percent Change: 4.42% Day Change: 0.60 | |
| Week Change: 8.92% Year-to-date Change: 48.2% | |
| LE Links: Profile News Message Board | |
| Charts:- Daily , Weekly | |
| Add LE to Watchlist: View: Get Complete LE Trend Analysis ➞ | |
| For tabular summary view of above stock list: Summary View ➞ 0 - 25 , 25 - 50 , 50 - 75 , 75 - 100 , 100 - 125 , 125 - 150 , 150 - 175 , 175 - 200 , 200 - 225 | ||
| Click To Change The Sort Order: By Market Cap or Company Size Performance: Year-to-date, Week and Day | |
| Select Chart Type: | ||
|
Best Stocks Today 12Stocks.com |
© 2024 12Stocks.com Terms & Conditions Privacy Contact Us
All Information Provided Only For Education And Not To Be Used For Investing or Trading. See Terms & Conditions


One More Thing ... Get Best Stocks Delivered Daily!
Never Ever Miss A Move With Our Top Ten Stocks Lists
Find Best Stocks In Any Market - Bull or Bear Market
Take A Peek At Our Top Ten Stocks Lists: Daily, Weekly, Year-to-Date & Top Trends
Find Best Stocks In Any Market - Bull or Bear Market
Take A Peek At Our Top Ten Stocks Lists: Daily, Weekly, Year-to-Date & Top Trends
Consumer Services Stocks With Best Up Trends [0-bearish to 100-bullish]: Perdoceo Education[100], Gannett Co[100], Sprouts Farmers[100], MINISO [100], Smart Share[100], Thomson Reuters[100], Gray Television[100], WESCO [100], Alibaba [100], Tetra Tech[100], Hesai [100]
Best Consumer Services Stocks Year-to-Date:
U Power[2974.78%], Vroom [1965.31%], Yatsen Holding[475.45%], Fluent [397.76%], Research[136.47%], Codere Online[132.88%], Carvana Co[120.06%], Sweetgreen [88.85%], RealReal [87.06%], Smart Share[68.74%], PaySign [65.36%] Best Consumer Services Stocks This Week:
Chicken Soup[156.52%], Smart Share[39.89%], Carvana Co[38.18%], Perdoceo Education[28.15%], Olaplex [24.63%], CareDx [22.75%], Polestar Automotive[21.61%], XPeng [19.9%], Gannett Co[18.6%], OneSpaWorld [16.2%], Li Auto[15.79%] Best Consumer Services Stocks Daily:
Carvana Co[33.77%], Perdoceo Education[31.79%], Gannett Co[26.97%], Sunnova Energy[25.21%], Chicken Soup[20.41%], Olaplex [19.29%], GameStop [16.96%], Wayfair [16.05%], XPeng [15.76%], Children s[14.58%], OneWater Marine[14.09%]