
 Login Sign Up


| |||||
 |  | ||||

| 12Stocks.com Market Intelligence |
Best Consumer Services Stocks
| In a hurry? Services & Goods Stocks: Performance Trends Table, Stock Charts
Sort Consumer Services: Daily, Weekly, Year-to-Date, Market Cap & Trends. Filter Services & Goods stocks list by size: All Large Mid-Range Small |
| 12Stocks.com Consumer Services Stocks Performances & Trends Daily | |||||||||
|
|  The overall Smart Investing & Trading Score is 26 (0-bearish to 100-bullish) which puts Consumer Services sector in short term bearish to neutral trend. The Smart Investing & Trading Score from previous trading session is 51 and a deterioration of trend continues.
| ||||||||
Here are the Smart Investing & Trading Scores of the most requested Consumer Services stocks at 12Stocks.com (click stock name for detailed review):
|


| Consider signing up for our daily 12Stocks.com "Best Stocks Newsletter". You will never ever miss a big stock move again! |
| 12Stocks.com: Investing in Consumer Services sector with Stocks | |
|
The following table helps investors and traders sort through current performance and trends (as measured by Smart Investing & Trading Score) of various
stocks in the Consumer Services sector. Quick View: Move mouse or cursor over stock symbol (ticker) to view short-term Technical chart and over stock name to view long term chart. Click on  to add stock symbol to your watchlist and to add stock symbol to your watchlist and  to view watchlist. Click on any ticker or stock name for detailed market intelligence report for that stock. to view watchlist. Click on any ticker or stock name for detailed market intelligence report for that stock. |
12Stocks.com Performance of Stocks in Consumer Services Sector
| Ticker | Stock Name | Watchlist | Category | Recent Price | Smart Investing & Trading Score | Change % | YTD Change% |
| LPX | Louisiana-Pacific |   | Wholesale | 72.75 | 26 | -0.33 | 2.71% |
| TW | Tradeweb Markets | | Services | 100.31 | 36 | -0.34 | 10.38% |
| DG | Dollar General | | Retail | 144.49 | 53 | -0.34 | 6.28% |
| REYN | Reynolds Consumer | | Packaging | 28.06 | 51 | -0.36 | 4.55% |
| HGV | Hilton Grand | | Casinos | 43.06 | 43 | -0.37 | 7.17% |
| EEFT | Euronet Worldwide | | Services | 101.22 | 33 | -0.38 | -0.27% |
| GPN | Global Payments | | Services | 122.95 | 18 | -0.39 | -3.19% |
| FC | Franklin Covey | | Education | 38.20 | 10 | -0.39 | -12.24% |
| SBH | Sally Beauty | | Retail | 10.31 | 17 | -0.39 | -22.36% |
| APEI | American Public | | Education | 12.52 | 48 | -0.40 | 29.74% |
| BLMN | Bloomin | | Restaurants | 26.91 | 58 | -0.41 | -4.40% |
| LYV | Live Nation | | Entertainment | 91.82 | 33 | -0.42 | -1.90% |
| INCR | Research | | Research | 2.36 | 15 | -0.42 | 82.97% |
| FAST | Fastenal | | Equipment | 68.48 | 23 | -0.45 | 5.73% |
| SFIX | Stitch Fix | | Retail | 2.23 | 22 | -0.45 | -37.54% |
| MCK | McKesson | | Pharmacy | 525.92 | 44 | -0.46 | 13.59% |
| ALLE | Allegion | | Security | 125.78 | 43 | -0.47 | -0.72% |
| BBSI | Barrett Business | | Staffing | 120.58 | 51 | -0.48 | 4.13% |
| COOK | Traeger | | Furnishings, Fixtures & Appliances | 2.08 | 22 | -0.48 | -26.37% |
| ICFI | ICF | | Services | 140.07 | 30 | -0.49 | 4.46% |
| RRGB | Red Robin | | Restaurants | 5.95 | 27 | -0.50 | -52.29% |
| FWRG | First Watch | | Restaurants | 22.03 | 26 | -0.50 | 10.54% |
| HRB | H&R Block | | Services | 46.87 | 45 | -0.51 | -3.10% |
| VLGEA | Village Super | | Grocery | 27.16 | 26 | -0.51 | 3.55% |
| EXPO | Exponent | | Services | 77.73 | 10 | -0.54 | -11.71% |
| For chart view version of above stock list: Chart View ➞ 0 - 25 , 25 - 50 , 50 - 75 , 75 - 100 , 100 - 125 , 125 - 150 , 150 - 175 , 175 - 200 , 200 - 225 , 225 - 250 , 250 - 275 , 275 - 300 , 300 - 325 , 325 - 350 , 350 - 375 , 375 - 400 , 400 - 425 , 425 - 450 , 450 - 475 | ||
 | Click To Change The Sort Order: By Market Cap or Company Size Performance: Year-to-date, Week and Day |  |
|
Get the most comprehensive stock market coverage daily at 12Stocks.com ➞ Best Stocks Today ➞ Best Stocks Weekly ➞ Best Stocks Year-to-Date ➞ Best Stocks Trends ➞  Best Stocks Today 12Stocks.com Best Nasdaq Stocks ➞ Best S&P 500 Stocks ➞ Best Tech Stocks ➞ Best Biotech Stocks ➞ |
| Detailed Overview of Consumer Services Stocks |
| Consumer Services Technical Overview, Leaders & Laggards, Top Consumer Services ETF Funds & Detailed Consumer Services Stocks List, Charts, Trends & More |
| Consumer Services Sector: Technical Analysis, Trends & YTD Performance | |
| Consumer Services sector is composed of stocks
from retail, entertainment, media/publishing, consumer goods
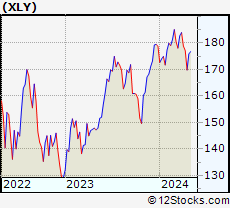
and services subsectors. Consumer Services sector, as represented by XLY, an exchange-traded fund [ETF] that holds basket of Consumer Services stocks (e.g, Walmart, Alibaba) is down by -3.62% and is currently underperforming the overall market by -8.03% year-to-date. Below is a quick view of Technical charts and trends: |
|
 XLY Weekly Chart |
|
| Long Term Trend: Good | |
| Medium Term Trend: Not Good | |
 XLY Daily Chart |
|
| Short Term Trend: Not Good | |
| Overall Trend Score: 26 | |
| YTD Performance: -3.62% | |
| **Trend Scores & Views Are Only For Educational Purposes And Not For Investing | |
| 12Stocks.com: Top Performing Consumer Services Sector Stocks | ||||||||||||||||||||||||||||||||||||||||||||||||
 The top performing Consumer Services sector stocks year to date are
Now, more recently, over last week, the top performing Consumer Services sector stocks on the move are


|
||||||||||||||||||||||||||||||||||||||||||||||||
| 12Stocks.com: Investing in Consumer Services Sector using Exchange Traded Funds | |
|
The following table shows list of key exchange traded funds (ETF) that
help investors track Consumer Services Index. For detailed view, check out our ETF Funds section of our website. Quick View: Move mouse or cursor over ETF symbol (ticker) to view short-term Technical chart and over ETF name to view long term chart. Click on ticker or stock name for detailed view. Click on to add stock symbol to your watchlist and to view watchlist. |
12Stocks.com List of ETFs that track Consumer Services Index
| Ticker | ETF Name | Watchlist | Recent Price | Smart Investing & Trading Score | Change % | Week % | Year-to-date % |
| XLY | Consumer Discret Sel | | 172.33 | 26 | -0.49 | -2.7 | -3.62% |
| RTH | Retail | | 199.02 | 36 | -0.19 | -1.32 | 5.73% |
| IYC | Consumer Services | | 77.44 | 26 | -0.40 | -2.21 | 2.2% |
| XRT | Retail | | 70.66 | 43 | -0.44 | -1.7 | -2.3% |
| IYK | Consumer Goods | | 64.52 | 48 | 0.44 | 0.56 | 0.97% |
| UCC | Consumer Services | | 32.76 | 53 | -0.12 | -4.84 | -8.77% |
| RETL | Retail Bull 3X | | 7.97 | 48 | -1.12 | -5.23 | -12.61% |
| RXI | Globl Consumer Discretionary | | 157.60 | 26 | -0.16 | -1.98 | -0.92% |
| SCC | Short Consumer Services | | 16.44 | 74 | 0.93 | 5.61 | 7.28% |
| UGE | Consumer Goods | | 16.13 | 60 | 0.43 | -0.36 | 2.47% |
| 12Stocks.com: Charts, Trends, Fundamental Data and Performances of Consumer Services Stocks | |
|
We now take in-depth look at all Consumer Services stocks including charts, multi-period performances and overall trends (as measured by Smart Investing & Trading Score). One can sort Consumer Services stocks (click link to choose) by Daily, Weekly and by Year-to-Date performances. Also, one can sort by size of the company or by market capitalization. |
| Select Your Default Chart Type: | |||||
| |||||
| Click on stock symbol or name for detailed view. Click on to add stock symbol to your watchlist and to view watchlist. Quick View: Move mouse or cursor over "Daily" to quickly view daily Technical stock chart and over "Weekly" to view weekly Technical stock chart. | |||||

 | LPX Louisiana-Pacific Corporation |
| Sector: Services & Goods | |
| SubSector: Building Materials Wholesale | |
| MarketCap: 1943.43 Millions | |
| Recent Price: 72.75 Smart Investing & Trading Score: 26 | |
| Day Percent Change: -0.33% Day Change: -0.24 | |
| Week Change: -5.24% Year-to-date Change: 2.7% | |
| LPX Links: Profile News Message Board | |
| Charts:- Daily , Weekly | |
| Add LPX to Watchlist: View: Get Complete LPX Trend Analysis ➞ | |
 | TW Tradeweb Markets Inc. |
| Sector: Services & Goods | |
| SubSector: Management Services | |
| MarketCap: 9913.35 Millions | |
| Recent Price: 100.31 Smart Investing & Trading Score: 36 | |
| Day Percent Change: -0.34% Day Change: -0.34 | |
| Week Change: -1.78% Year-to-date Change: 10.4% | |
| TW Links: Profile News Message Board | |
| Charts:- Daily , Weekly | |
| Add TW to Watchlist: View: Get Complete TW Trend Analysis ➞ | |
 | DG Dollar General Corporation |
| Sector: Services & Goods | |
| SubSector: Discount, Variety Stores | |
| MarketCap: 39611.9 Millions | |
| Recent Price: 144.49 Smart Investing & Trading Score: 53 | |
| Day Percent Change: -0.34% Day Change: -0.50 | |
| Week Change: -2.23% Year-to-date Change: 6.3% | |
| DG Links: Profile News Message Board | |
| Charts:- Daily , Weekly | |
| Add DG to Watchlist: View: Get Complete DG Trend Analysis ➞ | |
 | REYN Reynolds Consumer Products Inc. |
| Sector: Services & Goods | |
| SubSector: Packaging & Containers | |
| MarketCap: 62927 Millions | |
| Recent Price: 28.06 Smart Investing & Trading Score: 51 | |
| Day Percent Change: -0.36% Day Change: -0.10 | |
| Week Change: -0.71% Year-to-date Change: 4.6% | |
| REYN Links: Profile News Message Board | |
| Charts:- Daily , Weekly | |
| Add REYN to Watchlist: View: Get Complete REYN Trend Analysis ➞ | |
 | HGV Hilton Grand Vacations Inc. |
| Sector: Services & Goods | |
| SubSector: Resorts & Casinos | |
| MarketCap: 1333.04 Millions | |
| Recent Price: 43.06 Smart Investing & Trading Score: 43 | |
| Day Percent Change: -0.37% Day Change: -0.16 | |
| Week Change: -1.08% Year-to-date Change: 7.2% | |
| HGV Links: Profile News Message Board | |
| Charts:- Daily , Weekly | |
| Add HGV to Watchlist: View: Get Complete HGV Trend Analysis ➞ | |
 | EEFT Euronet Worldwide, Inc. |
| Sector: Services & Goods | |
| SubSector: Business Services | |
| MarketCap: 4809.62 Millions | |
| Recent Price: 101.22 Smart Investing & Trading Score: 33 | |
| Day Percent Change: -0.38% Day Change: -0.39 | |
| Week Change: -2.82% Year-to-date Change: -0.3% | |
| EEFT Links: Profile News Message Board | |
| Charts:- Daily , Weekly | |
| Add EEFT to Watchlist: View: Get Complete EEFT Trend Analysis ➞ | |
 | GPN Global Payments Inc. |
| Sector: Services & Goods | |
| SubSector: Business Services | |
| MarketCap: 39068.8 Millions | |
| Recent Price: 122.95 Smart Investing & Trading Score: 18 | |
| Day Percent Change: -0.39% Day Change: -0.48 | |
| Week Change: -0.64% Year-to-date Change: -3.2% | |
| GPN Links: Profile News Message Board | |
| Charts:- Daily , Weekly | |
| Add GPN to Watchlist: View: Get Complete GPN Trend Analysis ➞ | |
 | FC Franklin Covey Co. |
| Sector: Services & Goods | |
| SubSector: Education & Training Services | |
| MarketCap: 243.306 Millions | |
| Recent Price: 38.20 Smart Investing & Trading Score: 10 | |
| Day Percent Change: -0.39% Day Change: -0.15 | |
| Week Change: -1.9% Year-to-date Change: -12.2% | |
| FC Links: Profile News Message Board | |
| Charts:- Daily , Weekly | |
| Add FC to Watchlist: View: Get Complete FC Trend Analysis ➞ | |
 | SBH Sally Beauty Holdings, Inc. |
| Sector: Services & Goods | |
| SubSector: Specialty Retail, Other | |
| MarketCap: 1229.44 Millions | |
| Recent Price: 10.31 Smart Investing & Trading Score: 17 | |
| Day Percent Change: -0.39% Day Change: -0.04 | |
| Week Change: -5.59% Year-to-date Change: -22.4% | |
| SBH Links: Profile News Message Board | |
| Charts:- Daily , Weekly | |
| Add SBH to Watchlist: View: Get Complete SBH Trend Analysis ➞ | |
 | APEI American Public Education, Inc. |
| Sector: Services & Goods | |
| SubSector: Education & Training Services | |
| MarketCap: 361.306 Millions | |
| Recent Price: 12.52 Smart Investing & Trading Score: 48 | |
| Day Percent Change: -0.40% Day Change: -0.05 | |
| Week Change: -1.34% Year-to-date Change: 29.7% | |
| APEI Links: Profile News Message Board | |
| Charts:- Daily , Weekly | |
| Add APEI to Watchlist: View: Get Complete APEI Trend Analysis ➞ | |
 | BLMN Bloomin Brands, Inc. |
| Sector: Services & Goods | |
| SubSector: Restaurants | |
| MarketCap: 503.47 Millions | |
| Recent Price: 26.91 Smart Investing & Trading Score: 58 | |
| Day Percent Change: -0.41% Day Change: -0.11 | |
| Week Change: 1.51% Year-to-date Change: -4.4% | |
| BLMN Links: Profile News Message Board | |
| Charts:- Daily , Weekly | |
| Add BLMN to Watchlist: View: Get Complete BLMN Trend Analysis ➞ | |
 | LYV Live Nation Entertainment, Inc. |
| Sector: Services & Goods | |
| SubSector: Entertainment - Diversified | |
| MarketCap: 8457.17 Millions | |
| Recent Price: 91.82 Smart Investing & Trading Score: 33 | |
| Day Percent Change: -0.42% Day Change: -0.39 | |
| Week Change: -9.13% Year-to-date Change: -1.9% | |
| LYV Links: Profile News Message Board | |
| Charts:- Daily , Weekly | |
| Add LYV to Watchlist: View: Get Complete LYV Trend Analysis ➞ | |
 | INCR INC Research Holdings, Inc. |
| Sector: Services & Goods | |
| SubSector: Research Services | |
| MarketCap: 2486.94 Millions | |
| Recent Price: 2.36 Smart Investing & Trading Score: 15 | |
| Day Percent Change: -0.42% Day Change: -0.01 | |
| Week Change: 0% Year-to-date Change: 83.0% | |
| INCR Links: Profile News Message Board | |
| Charts:- Daily , Weekly | |
| Add INCR to Watchlist: View: Get Complete INCR Trend Analysis ➞ | |
 | FAST Fastenal Company |
| Sector: Services & Goods | |
| SubSector: Industrial Equipment Wholesale | |
| MarketCap: 17609.9 Millions | |
| Recent Price: 68.48 Smart Investing & Trading Score: 23 | |
| Day Percent Change: -0.45% Day Change: -0.31 | |
| Week Change: -2% Year-to-date Change: 5.7% | |
| FAST Links: Profile News Message Board | |
| Charts:- Daily , Weekly | |
| Add FAST to Watchlist: View: Get Complete FAST Trend Analysis ➞ | |
 | SFIX Stitch Fix, Inc. |
| Sector: Services & Goods | |
| SubSector: Specialty Retail, Other | |
| MarketCap: 1693.64 Millions | |
| Recent Price: 2.23 Smart Investing & Trading Score: 22 | |
| Day Percent Change: -0.45% Day Change: -0.01 | |
| Week Change: -3.46% Year-to-date Change: -37.5% | |
| SFIX Links: Profile News Message Board | |
| Charts:- Daily , Weekly | |
| Add SFIX to Watchlist: View: Get Complete SFIX Trend Analysis ➞ | |
 | MCK McKesson Corporation |
| Sector: Services & Goods | |
| SubSector: Drugs Wholesale | |
| MarketCap: 24096.7 Millions | |
| Recent Price: 525.92 Smart Investing & Trading Score: 44 | |
| Day Percent Change: -0.46% Day Change: -2.43 | |
| Week Change: 0.56% Year-to-date Change: 13.6% | |
| MCK Links: Profile News Message Board | |
| Charts:- Daily , Weekly | |
| Add MCK to Watchlist: View: Get Complete MCK Trend Analysis ➞ | |
 | ALLE Allegion plc |
| Sector: Services & Goods | |
| SubSector: Security & Protection Services | |
| MarketCap: 8515.93 Millions | |
| Recent Price: 125.78 Smart Investing & Trading Score: 43 | |
| Day Percent Change: -0.47% Day Change: -0.60 | |
| Week Change: -1.29% Year-to-date Change: -0.7% | |
| ALLE Links: Profile News Message Board | |
| Charts:- Daily , Weekly | |
| Add ALLE to Watchlist: View: Get Complete ALLE Trend Analysis ➞ | |
 | BBSI Barrett Business Services, Inc. |
| Sector: Services & Goods | |
| SubSector: Staffing & Outsourcing Services | |
| MarketCap: 262.028 Millions | |
| Recent Price: 120.58 Smart Investing & Trading Score: 51 | |
| Day Percent Change: -0.48% Day Change: -0.58 | |
| Week Change: 0.31% Year-to-date Change: 4.1% | |
| BBSI Links: Profile News Message Board | |
| Charts:- Daily , Weekly | |
| Add BBSI to Watchlist: View: Get Complete BBSI Trend Analysis ➞ | |
 | COOK Traeger, Inc. |
| Sector: Services & Goods | |
| SubSector: Furnishings, Fixtures & Appliances | |
| MarketCap: 524 Millions | |
| Recent Price: 2.08 Smart Investing & Trading Score: 22 | |
| Day Percent Change: -0.48% Day Change: -0.01 | |
| Week Change: -3.7% Year-to-date Change: -26.4% | |
| COOK Links: Profile News Message Board | |
| Charts:- Daily , Weekly | |
| Add COOK to Watchlist: View: Get Complete COOK Trend Analysis ➞ | |
 | ICFI ICF International, Inc. |
| Sector: Services & Goods | |
| SubSector: Management Services | |
| MarketCap: 1218.75 Millions | |
| Recent Price: 140.07 Smart Investing & Trading Score: 30 | |
| Day Percent Change: -0.49% Day Change: -0.69 | |
| Week Change: -2.49% Year-to-date Change: 4.5% | |
| ICFI Links: Profile News Message Board | |
| Charts:- Daily , Weekly | |
| Add ICFI to Watchlist: View: Get Complete ICFI Trend Analysis ➞ | |
 | RRGB Red Robin Gourmet Burgers, Inc. |
| Sector: Services & Goods | |
| SubSector: Restaurants | |
| MarketCap: 121.57 Millions | |
| Recent Price: 5.95 Smart Investing & Trading Score: 27 | |
| Day Percent Change: -0.50% Day Change: -0.03 | |
| Week Change: -0.83% Year-to-date Change: -52.3% | |
| RRGB Links: Profile News Message Board | |
| Charts:- Daily , Weekly | |
| Add RRGB to Watchlist: View: Get Complete RRGB Trend Analysis ➞ | |
 | FWRG First Watch Restaurant Group, Inc. |
| Sector: Services & Goods | |
| SubSector: Restaurants | |
| MarketCap: 1000 Millions | |
| Recent Price: 22.03 Smart Investing & Trading Score: 26 | |
| Day Percent Change: -0.50% Day Change: -0.11 | |
| Week Change: -5.25% Year-to-date Change: 10.5% | |
| FWRG Links: Profile News Message Board | |
| Charts:- Daily , Weekly | |
| Add FWRG to Watchlist: View: Get Complete FWRG Trend Analysis ➞ | |
 | HRB H&R Block, Inc. |
| Sector: Services & Goods | |
| SubSector: Personal Services | |
| MarketCap: 3052.45 Millions | |
| Recent Price: 46.87 Smart Investing & Trading Score: 45 | |
| Day Percent Change: -0.51% Day Change: -0.24 | |
| Week Change: 1.32% Year-to-date Change: -3.1% | |
| HRB Links: Profile News Message Board | |
| Charts:- Daily , Weekly | |
| Add HRB to Watchlist: View: Get Complete HRB Trend Analysis ➞ | |
 | VLGEA Village Super Market, Inc. |
| Sector: Services & Goods | |
| SubSector: Grocery Stores | |
| MarketCap: 222.375 Millions | |
| Recent Price: 27.16 Smart Investing & Trading Score: 26 | |
| Day Percent Change: -0.51% Day Change: -0.14 | |
| Week Change: -2.55% Year-to-date Change: 3.6% | |
| VLGEA Links: Profile News Message Board | |
| Charts:- Daily , Weekly | |
| Add VLGEA to Watchlist: View: Get Complete VLGEA Trend Analysis ➞ | |
 | EXPO Exponent, Inc. |
| Sector: Services & Goods | |
| SubSector: Management Services | |
| MarketCap: 3605.95 Millions | |
| Recent Price: 77.73 Smart Investing & Trading Score: 10 | |
| Day Percent Change: -0.54% Day Change: -0.42 | |
| Week Change: -2.68% Year-to-date Change: -11.7% | |
| EXPO Links: Profile News Message Board | |
| Charts:- Daily , Weekly | |
| Add EXPO to Watchlist: View: Get Complete EXPO Trend Analysis ➞ | |
| For tabular summary view of above stock list: Summary View ➞ 0 - 25 , 25 - 50 , 50 - 75 , 75 - 100 , 100 - 125 , 125 - 150 , 150 - 175 , 175 - 200 , 200 - 225 , 225 - 250 , 250 - 275 , 275 - 300 , 300 - 325 , 325 - 350 , 350 - 375 , 375 - 400 , 400 - 425 , 425 - 450 , 450 - 475 | ||
| Click To Change The Sort Order: By Market Cap or Company Size Performance: Year-to-date, Week and Day | |
| Select Chart Type: | ||
|
Best Stocks Today 12Stocks.com |
© 2024 12Stocks.com Terms & Conditions Privacy Contact Us
All Information Provided Only For Education And Not To Be Used For Investing or Trading. See Terms & Conditions


One More Thing ... Get Best Stocks Delivered Daily!
Never Ever Miss A Move With Our Top Ten Stocks Lists
Find Best Stocks In Any Market - Bull or Bear Market
Take A Peek At Our Top Ten Stocks Lists: Daily, Weekly, Year-to-Date & Top Trends
Find Best Stocks In Any Market - Bull or Bear Market
Take A Peek At Our Top Ten Stocks Lists: Daily, Weekly, Year-to-Date & Top Trends
Consumer Services Stocks With Best Up Trends [0-bearish to 100-bullish]: IMAX [100], Envestnet [100], Coupang [100], Winmark [90], Yatsen Holding[90], Wendy s[87], Boot Barn[85], Cinemark [83], Lands [83], Mastech Digital[81], TAL Education[78]
Best Consumer Services Stocks Year-to-Date:
U Power[2651.12%], Vroom [1734.91%], Yatsen Holding[393.44%], Fluent [261.19%], Codere Online[133.56%], Sweetgreen [84.16%], Research[82.97%], RealReal [57.21%], Spotify Technology[56.23%], Bright Scholar[55.2%], PaySign [51.43%] Best Consumer Services Stocks This Week:
Yatsen Holding[19.93%], AMC Entertainment[12.45%], Envestnet [8.55%], Winmark [7.25%], Children s[6.7%], Coupang [6.49%], Bright Scholar[5.43%], Smart Share[5.06%], Advance Auto[5.04%], United Homes[4.99%], SunCar Technology[4.43%] Best Consumer Services Stocks Daily:
Children s[16.46%], WW [14.10%], U Power[10.29%], AMC Entertainment[9.56%], MINISO [8.10%], PRA [7.75%], DoubleDown Interactive[6.43%], CareDx [5.34%], Studio City[5.05%], Hesai [4.50%], Winmark [4.49%]