
 Login Sign Up


| |||||
 |  | ||||

| 12Stocks.com Market Intelligence |
Best Consumer Services Stocks
| In a hurry? Services & Goods Stocks: Performance Trends Table, Stock Charts
Sort Consumer Services: Daily, Weekly, Year-to-Date, Market Cap & Trends. Filter Services & Goods stocks list by size: All Large Mid-Range Small |
| 12Stocks.com Consumer Services Stocks Performances & Trends Daily | |||||||||
|
|  The overall Smart Investing & Trading Score is 40 (0-bearish to 100-bullish) which puts Consumer Services sector in short term bearish to neutral trend. The Smart Investing & Trading Score from previous trading session is 52 and hence a deterioration of trend.
| ||||||||
Here are the Smart Investing & Trading Scores of the most requested Consumer Services stocks at 12Stocks.com (click stock name for detailed review):
|


| Consider signing up for our daily 12Stocks.com "Best Stocks Newsletter". You will never ever miss a big stock move again! |
| 12Stocks.com: Investing in Consumer Services sector with Stocks | |
|
The following table helps investors and traders sort through current performance and trends (as measured by Smart Investing & Trading Score) of various
stocks in the Consumer Services sector. Quick View: Move mouse or cursor over stock symbol (ticker) to view short-term Technical chart and over stock name to view long term chart. Click on  to add stock symbol to your watchlist and to add stock symbol to your watchlist and  to view watchlist. Click on any ticker or stock name for detailed market intelligence report for that stock. to view watchlist. Click on any ticker or stock name for detailed market intelligence report for that stock. |
12Stocks.com Performance of Stocks in Consumer Services Sector
| Ticker | Stock Name | Watchlist | Category | Recent Price | Smart Investing & Trading Score | Change % | YTD Change% |
| DENN | Denny s |   | Restaurants | 7.97 | 10 | -0.19 | -26.70% |
| MGA | Magna | | Auto Parts | 46.51 | 18 | -0.19 | -21.28% |
| ATGE | Adtalem Global | | Education | 62.92 | 93 | -0.19 | 6.73% |
| SG | Sweetgreen | | Restaurants | 23.20 | 83 | -0.19 | 105.35% |
| CHUY | Chuy s | | Restaurants | 29.25 | 35 | -0.20 | -23.49% |
| OSW | OneSpaWorld | | Casinos | 14.79 | 81 | -0.20 | 4.89% |
| LVS | Las Vegas | | Casinos | 46.62 | 50 | -0.21 | -5.26% |
| MCD | McDonald s | | Restaurants | 266.93 | 10 | -0.21 | -9.98% |
| IMKTA | Ingles Markets | | Grocery | 72.01 | 38 | -0.22 | -16.63% |
| MMS | MAXIMUS | | Services | 84.06 | 80 | -0.23 | 0.24% |
| DLTH | Duluth | | Apparel | 4.17 | 17 | -0.24 | -22.49% |
| AAP | Advance Auto | | Auto Parts | 74.32 | 53 | -0.25 | 21.78% |
| MSA | MSA Safety | | Security | 187.49 | 73 | -0.26 | 11.05% |
| CHDN | Churchill Downs | | Gaming | 137.71 | 100 | -0.27 | 2.06% |
| HD | Home Depot | | Retail | 339.71 | 37 | -0.29 | -1.97% |
| SFM | Sprouts Farmers | | Grocery | 74.55 | 95 | -0.29 | 54.96% |
| LOCO | El Pollo | | Restaurants | 10.18 | 93 | -0.29 | 15.42% |
| MCRI | Monarch Casino | | Casinos | 68.73 | 57 | -0.30 | -0.60% |
| AFYA | Afya | | Education | 17.98 | 52 | -0.30 | -18.01% |
| LAUR | Laureate Education | | Education | 15.76 | 93 | -0.32 | 14.95% |
| TJX | TJX | | Department | 97.61 | 64 | -0.32 | 4.05% |
| COST | Costco Wholesale | | Retail | 768.87 | 95 | -0.32 | 16.48% |
| IPG | Interpublic | | Advertising | 30.86 | 45 | -0.34 | -5.47% |
| WING | Wingstop | | Restaurants | 396.50 | 95 | -0.34 | 54.53% |
| WBA | Walgreens Boots | | Drug Stores | 17.29 | 20 | -0.35 | -33.78% |
| For chart view version of above stock list: Chart View ➞ 0 - 25 , 25 - 50 , 50 - 75 , 75 - 100 , 100 - 125 , 125 - 150 , 150 - 175 , 175 - 200 , 200 - 225 , 225 - 250 , 250 - 275 , 275 - 300 , 300 - 325 , 325 - 350 , 350 - 375 | ||
 | Click To Change The Sort Order: By Market Cap or Company Size Performance: Year-to-date, Week and Day |  |
|
Get the most comprehensive stock market coverage daily at 12Stocks.com ➞ Best Stocks Today ➞ Best Stocks Weekly ➞ Best Stocks Year-to-Date ➞ Best Stocks Trends ➞  Best Stocks Today 12Stocks.com Best Nasdaq Stocks ➞ Best S&P 500 Stocks ➞ Best Tech Stocks ➞ Best Biotech Stocks ➞ |
| Detailed Overview of Consumer Services Stocks |
| Consumer Services Technical Overview, Leaders & Laggards, Top Consumer Services ETF Funds & Detailed Consumer Services Stocks List, Charts, Trends & More |
| Consumer Services Sector: Technical Analysis, Trends & YTD Performance | |
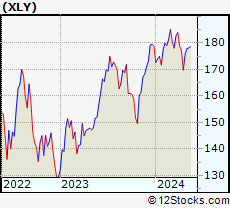
| Consumer Services sector is composed of stocks
from retail, entertainment, media/publishing, consumer goods
and services subsectors. Consumer Services sector, as represented by XLY, an exchange-traded fund [ETF] that holds basket of Consumer Services stocks (e.g, Walmart, Alibaba) is down by -0.86% and is currently underperforming the overall market by -8.76% year-to-date. Below is a quick view of Technical charts and trends: |
|
 XLY Weekly Chart |
|
| Long Term Trend: Not Good | |
| Medium Term Trend: Very Good | |
 XLY Daily Chart |
|
| Short Term Trend: Not Good | |
| Overall Trend Score: 40 | |
| YTD Performance: -0.86% | |
| **Trend Scores & Views Are Only For Educational Purposes And Not For Investing | |
| 12Stocks.com: Top Performing Consumer Services Sector Stocks | ||||||||||||||||||||||||||||||||||||||||||||||||
 The top performing Consumer Services sector stocks year to date are
Now, more recently, over last week, the top performing Consumer Services sector stocks on the move are


|
||||||||||||||||||||||||||||||||||||||||||||||||
| 12Stocks.com: Investing in Consumer Services Sector using Exchange Traded Funds | |
|
The following table shows list of key exchange traded funds (ETF) that
help investors track Consumer Services Index. For detailed view, check out our ETF Funds section of our website. Quick View: Move mouse or cursor over ETF symbol (ticker) to view short-term Technical chart and over ETF name to view long term chart. Click on ticker or stock name for detailed view. Click on to add stock symbol to your watchlist and to view watchlist. |
12Stocks.com List of ETFs that track Consumer Services Index
| Ticker | ETF Name | Watchlist | Recent Price | Smart Investing & Trading Score | Change % | Week % | Year-to-date % |
| XLY | Consumer Discret Sel | | 177.28 | 40 | -0.69 | -0.35 | -0.86% |
| RTH | Retail | | 202.36 | 57 | -0.06 | 0.92 | 7.51% |
| IYC | Consumer Services | | 78.85 | 57 | -1.00 | -0.3 | 4.06% |
| XRT | Retail | | 73.31 | 40 | -1.14 | -0.14 | 1.38% |
| IYK | Consumer Goods | | 67.31 | 100 | 0.18 | 1.08 | 5.33% |
| UCC | Consumer Services | | 34.83 | 64 | -1.10 | 2.25 | -2.99% |
| RETL | Retail Bull 3X | | 8.76 | 62 | -3.58 | -0.85 | -4% |
| RXI | Globl Consumer Discretionary | | 161.67 | 52 | -0.93 | -0.88 | 1.64% |
| SCC | Short Consumer Services | | 15.29 | 46 | -0.08 | -0.63 | -0.24% |
| UGE | Consumer Goods | | 17.61 | 95 | -0.04 | 1.94 | 11.84% |
| 12Stocks.com: Charts, Trends, Fundamental Data and Performances of Consumer Services Stocks | |
|
We now take in-depth look at all Consumer Services stocks including charts, multi-period performances and overall trends (as measured by Smart Investing & Trading Score). One can sort Consumer Services stocks (click link to choose) by Daily, Weekly and by Year-to-Date performances. Also, one can sort by size of the company or by market capitalization. |
| Select Your Default Chart Type: | |||||
| |||||
| Click on stock symbol or name for detailed view. Click on to add stock symbol to your watchlist and to view watchlist. Quick View: Move mouse or cursor over "Daily" to quickly view daily Technical stock chart and over "Weekly" to view weekly Technical stock chart. | |||||

 | DENN Denny s Corporation |
| Sector: Services & Goods | |
| SubSector: Restaurants | |
| MarketCap: 367.47 Millions | |
| Recent Price: 7.97 Smart Investing & Trading Score: 10 | |
| Day Percent Change: -0.19% Day Change: -0.02 | |
| Week Change: -1.42% Year-to-date Change: -26.7% | |
| DENN Links: Profile News Message Board | |
| Charts:- Daily , Weekly | |
| Add DENN to Watchlist: View: Get Complete DENN Trend Analysis ➞ | |
 | MGA Magna International Inc. |
| Sector: Services & Goods | |
| SubSector: Auto Parts Wholesale | |
| MarketCap: 8967.3 Millions | |
| Recent Price: 46.51 Smart Investing & Trading Score: 18 | |
| Day Percent Change: -0.19% Day Change: -0.09 | |
| Week Change: -0.41% Year-to-date Change: -21.3% | |
| MGA Links: Profile News Message Board | |
| Charts:- Daily , Weekly | |
| Add MGA to Watchlist: View: Get Complete MGA Trend Analysis ➞ | |
 | ATGE Adtalem Global Education Inc. |
| Sector: Services & Goods | |
| SubSector: Education & Training Services | |
| MarketCap: 1273.86 Millions | |
| Recent Price: 62.92 Smart Investing & Trading Score: 93 | |
| Day Percent Change: -0.19% Day Change: -0.12 | |
| Week Change: 4.73% Year-to-date Change: 6.7% | |
| ATGE Links: Profile News Message Board | |
| Charts:- Daily , Weekly | |
| Add ATGE to Watchlist: View: Get Complete ATGE Trend Analysis ➞ | |
 | SG Sweetgreen, Inc. |
| Sector: Services & Goods | |
| SubSector: Restaurants | |
| MarketCap: 1420 Millions | |
| Recent Price: 23.20 Smart Investing & Trading Score: 83 | |
| Day Percent Change: -0.19% Day Change: -0.05 | |
| Week Change: 5% Year-to-date Change: 105.4% | |
| SG Links: Profile News Message Board | |
| Charts:- Daily , Weekly | |
| Add SG to Watchlist: View: Get Complete SG Trend Analysis ➞ | |
 | CHUY Chuy s Holdings, Inc. |
| Sector: Services & Goods | |
| SubSector: Restaurants | |
| MarketCap: 159.17 Millions | |
| Recent Price: 29.25 Smart Investing & Trading Score: 35 | |
| Day Percent Change: -0.20% Day Change: -0.06 | |
| Week Change: 0.41% Year-to-date Change: -23.5% | |
| CHUY Links: Profile News Message Board | |
| Charts:- Daily , Weekly | |
| Add CHUY to Watchlist: View: Get Complete CHUY Trend Analysis ➞ | |
 | OSW OneSpaWorld Holdings Limited |
| Sector: Services & Goods | |
| SubSector: Resorts & Casinos | |
| MarketCap: 228.394 Millions | |
| Recent Price: 14.79 Smart Investing & Trading Score: 81 | |
| Day Percent Change: -0.20% Day Change: -0.03 | |
| Week Change: -0.34% Year-to-date Change: 4.9% | |
| OSW Links: Profile News Message Board | |
| Charts:- Daily , Weekly | |
| Add OSW to Watchlist: View: Get Complete OSW Trend Analysis ➞ | |
 | LVS Las Vegas Sands Corp. |
| Sector: Services & Goods | |
| SubSector: Resorts & Casinos | |
| MarketCap: 36431.6 Millions | |
| Recent Price: 46.62 Smart Investing & Trading Score: 50 | |
| Day Percent Change: -0.21% Day Change: -0.10 | |
| Week Change: -0.53% Year-to-date Change: -5.3% | |
| LVS Links: Profile News Message Board | |
| Charts:- Daily , Weekly | |
| Add LVS to Watchlist: View: Get Complete LVS Trend Analysis ➞ | |
 | MCD McDonald s Corporation |
| Sector: Services & Goods | |
| SubSector: Restaurants | |
| MarketCap: 122481 Millions | |
| Recent Price: 266.93 Smart Investing & Trading Score: 10 | |
| Day Percent Change: -0.21% Day Change: -0.57 | |
| Week Change: -1.25% Year-to-date Change: -10.0% | |
| MCD Links: Profile News Message Board | |
| Charts:- Daily , Weekly | |
| Add MCD to Watchlist: View: Get Complete MCD Trend Analysis ➞ | |
 | IMKTA Ingles Markets, Incorporated |
| Sector: Services & Goods | |
| SubSector: Grocery Stores | |
| MarketCap: 827.075 Millions | |
| Recent Price: 72.01 Smart Investing & Trading Score: 38 | |
| Day Percent Change: -0.22% Day Change: -0.16 | |
| Week Change: -0.4% Year-to-date Change: -16.6% | |
| IMKTA Links: Profile News Message Board | |
| Charts:- Daily , Weekly | |
| Add IMKTA to Watchlist: View: Get Complete IMKTA Trend Analysis ➞ | |
 | MMS MAXIMUS, Inc. |
| Sector: Services & Goods | |
| SubSector: Business Services | |
| MarketCap: 3833.02 Millions | |
| Recent Price: 84.06 Smart Investing & Trading Score: 80 | |
| Day Percent Change: -0.23% Day Change: -0.19 | |
| Week Change: 1.51% Year-to-date Change: 0.2% | |
| MMS Links: Profile News Message Board | |
| Charts:- Daily , Weekly | |
| Add MMS to Watchlist: View: Get Complete MMS Trend Analysis ➞ | |
 | DLTH Duluth Holdings Inc. |
| Sector: Services & Goods | |
| SubSector: Apparel Stores | |
| MarketCap: 180.008 Millions | |
| Recent Price: 4.17 Smart Investing & Trading Score: 17 | |
| Day Percent Change: -0.24% Day Change: -0.01 | |
| Week Change: 0% Year-to-date Change: -22.5% | |
| DLTH Links: Profile News Message Board | |
| Charts:- Daily , Weekly | |
| Add DLTH to Watchlist: View: Get Complete DLTH Trend Analysis ➞ | |
 | AAP Advance Auto Parts, Inc. |
| Sector: Services & Goods | |
| SubSector: Auto Parts Stores | |
| MarketCap: 5977.7 Millions | |
| Recent Price: 74.32 Smart Investing & Trading Score: 53 | |
| Day Percent Change: -0.25% Day Change: -0.19 | |
| Week Change: -2.61% Year-to-date Change: 21.8% | |
| AAP Links: Profile News Message Board | |
| Charts:- Daily , Weekly | |
| Add AAP to Watchlist: View: Get Complete AAP Trend Analysis ➞ | |
 | MSA MSA Safety Incorporated |
| Sector: Services & Goods | |
| SubSector: Security & Protection Services | |
| MarketCap: 4167.83 Millions | |
| Recent Price: 187.49 Smart Investing & Trading Score: 73 | |
| Day Percent Change: -0.26% Day Change: -0.49 | |
| Week Change: 1.94% Year-to-date Change: 11.1% | |
| MSA Links: Profile News Message Board | |
| Charts:- Daily , Weekly | |
| Add MSA to Watchlist: View: Get Complete MSA Trend Analysis ➞ | |
 | CHDN Churchill Downs Incorporated |
| Sector: Services & Goods | |
| SubSector: Gaming Activities | |
| MarketCap: 3693.29 Millions | |
| Recent Price: 137.71 Smart Investing & Trading Score: 100 | |
| Day Percent Change: -0.27% Day Change: -0.38 | |
| Week Change: 2.75% Year-to-date Change: 2.1% | |
| CHDN Links: Profile News Message Board | |
| Charts:- Daily , Weekly | |
| Add CHDN to Watchlist: View: Get Complete CHDN Trend Analysis ➞ | |
 | HD The Home Depot, Inc. |
| Sector: Services & Goods | |
| SubSector: Home Improvement Stores | |
| MarketCap: 185389 Millions | |
| Recent Price: 339.71 Smart Investing & Trading Score: 37 | |
| Day Percent Change: -0.29% Day Change: -0.98 | |
| Week Change: -0.92% Year-to-date Change: -2.0% | |
| HD Links: Profile News Message Board | |
| Charts:- Daily , Weekly | |
| Add HD to Watchlist: View: Get Complete HD Trend Analysis ➞ | |
 | SFM Sprouts Farmers Market, Inc. |
| Sector: Services & Goods | |
| SubSector: Grocery Stores | |
| MarketCap: 2495.85 Millions | |
| Recent Price: 74.55 Smart Investing & Trading Score: 95 | |
| Day Percent Change: -0.29% Day Change: -0.22 | |
| Week Change: 1.18% Year-to-date Change: 55.0% | |
| SFM Links: Profile News Message Board | |
| Charts:- Daily , Weekly | |
| Add SFM to Watchlist: View: Get Complete SFM Trend Analysis ➞ | |
 | LOCO El Pollo Loco Holdings, Inc. |
| Sector: Services & Goods | |
| SubSector: Restaurants | |
| MarketCap: 296.97 Millions | |
| Recent Price: 10.18 Smart Investing & Trading Score: 93 | |
| Day Percent Change: -0.29% Day Change: -0.03 | |
| Week Change: 1.7% Year-to-date Change: 15.4% | |
| LOCO Links: Profile News Message Board | |
| Charts:- Daily , Weekly | |
| Add LOCO to Watchlist: View: Get Complete LOCO Trend Analysis ➞ | |
 | MCRI Monarch Casino & Resort, Inc. |
| Sector: Services & Goods | |
| SubSector: Resorts & Casinos | |
| MarketCap: 352.894 Millions | |
| Recent Price: 68.73 Smart Investing & Trading Score: 57 | |
| Day Percent Change: -0.30% Day Change: -0.20 | |
| Week Change: -0.4% Year-to-date Change: -0.6% | |
| MCRI Links: Profile News Message Board | |
| Charts:- Daily , Weekly | |
| Add MCRI to Watchlist: View: Get Complete MCRI Trend Analysis ➞ | |
 | AFYA Afya Limited |
| Sector: Services & Goods | |
| SubSector: Education & Training Services | |
| MarketCap: 1559.26 Millions | |
| Recent Price: 17.98 Smart Investing & Trading Score: 52 | |
| Day Percent Change: -0.30% Day Change: -0.05 | |
| Week Change: 0.06% Year-to-date Change: -18.0% | |
| AFYA Links: Profile News Message Board | |
| Charts:- Daily , Weekly | |
| Add AFYA to Watchlist: View: Get Complete AFYA Trend Analysis ➞ | |
 | LAUR Laureate Education, Inc. |
| Sector: Services & Goods | |
| SubSector: Education & Training Services | |
| MarketCap: 2258.56 Millions | |
| Recent Price: 15.76 Smart Investing & Trading Score: 93 | |
| Day Percent Change: -0.32% Day Change: -0.05 | |
| Week Change: 5.21% Year-to-date Change: 15.0% | |
| LAUR Links: Profile News Message Board | |
| Charts:- Daily , Weekly | |
| Add LAUR to Watchlist: View: Get Complete LAUR Trend Analysis ➞ | |
 | TJX The TJX Companies, Inc. |
| Sector: Services & Goods | |
| SubSector: Department Stores | |
| MarketCap: 50656.2 Millions | |
| Recent Price: 97.61 Smart Investing & Trading Score: 64 | |
| Day Percent Change: -0.32% Day Change: -0.31 | |
| Week Change: 2.63% Year-to-date Change: 4.1% | |
| TJX Links: Profile News Message Board | |
| Charts:- Daily , Weekly | |
| Add TJX to Watchlist: View: Get Complete TJX Trend Analysis ➞ | |
 | COST Costco Wholesale Corporation |
| Sector: Services & Goods | |
| SubSector: Discount, Variety Stores | |
| MarketCap: 136355 Millions | |
| Recent Price: 768.87 Smart Investing & Trading Score: 95 | |
| Day Percent Change: -0.32% Day Change: -2.44 | |
| Week Change: 3.36% Year-to-date Change: 16.5% | |
| COST Links: Profile News Message Board | |
| Charts:- Daily , Weekly | |
| Add COST to Watchlist: View: Get Complete COST Trend Analysis ➞ | |
 | IPG The Interpublic Group of Companies, Inc. |
| Sector: Services & Goods | |
| SubSector: Advertising Agencies | |
| MarketCap: 5730.55 Millions | |
| Recent Price: 30.86 Smart Investing & Trading Score: 45 | |
| Day Percent Change: -0.34% Day Change: -0.11 | |
| Week Change: 0.44% Year-to-date Change: -5.5% | |
| IPG Links: Profile News Message Board | |
| Charts:- Daily , Weekly | |
| Add IPG to Watchlist: View: Get Complete IPG Trend Analysis ➞ | |
 | WING Wingstop Inc. |
| Sector: Services & Goods | |
| SubSector: Restaurants | |
| MarketCap: 1744.7 Millions | |
| Recent Price: 396.50 Smart Investing & Trading Score: 95 | |
| Day Percent Change: -0.34% Day Change: -1.34 | |
| Week Change: 2.05% Year-to-date Change: 54.5% | |
| WING Links: Profile News Message Board | |
| Charts:- Daily , Weekly | |
| Add WING to Watchlist: View: Get Complete WING Trend Analysis ➞ | |
 | WBA Walgreens Boots Alliance, Inc. |
| Sector: Services & Goods | |
| SubSector: Drug Stores | |
| MarketCap: 46184.1 Millions | |
| Recent Price: 17.29 Smart Investing & Trading Score: 20 | |
| Day Percent Change: -0.35% Day Change: -0.06 | |
| Week Change: -2.92% Year-to-date Change: -33.8% | |
| WBA Links: Profile News Message Board | |
| Charts:- Daily , Weekly | |
| Add WBA to Watchlist: View: Get Complete WBA Trend Analysis ➞ | |
| For tabular summary view of above stock list: Summary View ➞ 0 - 25 , 25 - 50 , 50 - 75 , 75 - 100 , 100 - 125 , 125 - 150 , 150 - 175 , 175 - 200 , 200 - 225 , 225 - 250 , 250 - 275 , 275 - 300 , 300 - 325 , 325 - 350 , 350 - 375 | ||
| Click To Change The Sort Order: By Market Cap or Company Size Performance: Year-to-date, Week and Day | |
| Select Chart Type: | ||
|
Best Stocks Today 12Stocks.com |
© 2024 12Stocks.com Terms & Conditions Privacy Contact Us
All Information Provided Only For Education And Not To Be Used For Investing or Trading. See Terms & Conditions


One More Thing ... Get Best Stocks Delivered Daily!
Never Ever Miss A Move With Our Top Ten Stocks Lists
Find Best Stocks In Any Market - Bull or Bear Market
Take A Peek At Our Top Ten Stocks Lists: Daily, Weekly, Year-to-Date & Top Trends
Find Best Stocks In Any Market - Bull or Bear Market
Take A Peek At Our Top Ten Stocks Lists: Daily, Weekly, Year-to-Date & Top Trends
Consumer Services Stocks With Best Up Trends [0-bearish to 100-bullish]: Myriad Genetics[100], Fox [100], Twenty-First Century[100], Thomson Reuters[100], Casey s[100], Avnet [100], Verra Mobility[100], GreenTree Hospitality[100], Village Super[100], Tetra Tech[100], Daily Journal[100]
Best Consumer Services Stocks Year-to-Date:
Research[161.28%], Carvana Co[115.23%], Sweetgreen [105.35%], American Public[102.18%], RealReal [96.52%], Jumia Technologies[77.2%], PaySign [68.93%], CRA [64.46%], Spotify Technology[60.28%], DXP Enterprises[59.36%], Sprouts Farmers[54.96%] Best Consumer Services Stocks This Week:
American Public[29.38%], Jumia Technologies[23.62%], Myriad Genetics[20.08%], Children s[18.64%], Grand Canyon[12.75%], Louisiana-Pacific [12.4%], Ameresco [12.14%], Noodles & [10.13%], Universal Technical[8.9%], Newtek Business[8.87%], Research[8.01%] Best Consumer Services Stocks Daily:
American Public[28.52%], Chicken Soup[18.58%], Myriad Genetics[18.20%], Louisiana-Pacific [14.44%], Ameresco [12.99%], Grand Canyon[9.79%], Brink s[6.20%], Formula One[5.23%], Research[4.98%], Formula One[4.92%], RealReal [4.50%]