
 Login Sign Up


| |||||
 |  | ||||

| 12Stocks.com Market Intelligence |
Best China Stocks
|
On this page, you will find the most comprehensive analysis of Chinese stocks and ETFs - from latest trends to performances to charts ➞. First, here are the year-to-date (YTD) performances of the most requested China stocks at 12Stocks.com (click stock for review):
| Sohu.com 13% | ||
| New Oriental 9% | ||
| NetEase 1% | ||
| JD.com -1% | ||
| Alibaba -3% | ||
| Vipshop -11% | ||
| Baidu -16% | ||
| JOYY -16% | ||
| Weibo -23% | ||
| In a hurry? China Stocks Lists: Performance Trends Table, Stock Charts
Sort China stocks: Daily, Weekly, Year-to-Date, Market Cap & Trends. Filter China stocks list by sector: Show all, Tech, Finance, Energy, Staples, Retail, Industrial, Materials, Utilities and HealthCare Filter China stocks list by size: All China Large Medium Small and MicroCap |
| April 26, 2024 - 12Stocks.com China Stocks Performances & Trends Daily | |||||||||
|
|  The overall Smart Investing & Trading Score is 100 (0-bearish to 100-bullish) which puts China index in short term bullish trend. The Smart Investing & Trading Score from previous trading session is 74 and an improvement of trend continues.
| ||||||||
| Here are the Smart Investing & Trading Scores of the most requested China stocks at 12Stocks.com (click stock name for detailed review): |


| 12Stocks.com: Top Performing China Index Stocks | ||||||||||||||||||||||||||||||||||||||||||||||||
 The top performing China Index stocks year to date are
Now, more recently, over last week, the top performing China Index stocks on the move are


|
||||||||||||||||||||||||||||||||||||||||||||||||
| 12Stocks.com: Investing in China Index with Stocks | |
|
The following table helps investors and traders sort through current performance and trends (as measured by Smart Investing & Trading Score) of various
stocks in the China Index. Quick View: Move mouse or cursor over stock symbol (ticker) to view short-term technical chart and over stock name to view long term chart. Click on  to add stock symbol to your watchlist and to add stock symbol to your watchlist and  to view watchlist. Click on any ticker or stock name for detailed market intelligence report for that stock. to view watchlist. Click on any ticker or stock name for detailed market intelligence report for that stock. |
12Stocks.com Performance of Stocks in China Index
| Ticker | Stock Name | Watchlist | Category | Recent Price | Smart Investing & Trading Score | Change % | YTD Change% |
| HTHT | Huazhu |   | Services & Goods | 39.74 | 80 | 1.48% | 18.84% |
| BZ | Kanzhun | | Industrials | 19.60 | 100 | 3.29% | 18.61% |
| EM | Smart Share | | Services & Goods | 0.60 | 71 | -4.76% | 16.50% |
| WIMI | WiMi Hologram | | Technology | 0.93 | 93 | -19.01% | 15.70% |
| WDH | Waterdrop | | Financials | 1.20 | 53 | 0.84% | 14.61% |
| SOHU | Sohu.com | | Technology | 11.20 | 68 | -0.27% | 12.79% |
| JG | Aurora Mobile | | Technology | 3.14 | 32 | 0.00% | 10.10% |
| EDU | New Oriental | | Services & Goods | 79.64 | 26 | 3.32% | 8.68% |
| EH | EHang | | Industrials | 18.20 | 68 | 4.12% | 8.33% |
| MNSO | MINISO | | Services & Goods | 22.09 | 93 | -2.17% | 8.28% |
| MSC | Studio City | | Services & Goods | 7.00 | 46 | -3.18% | 8.02% |
| TWN | Taiwan Fund | | Financials | 36.72 | 36 | -1.67% | 6.16% |
| TAL | TAL Education | | Services & Goods | 13.35 | 90 | 8.89% | 5.70% |
| YJ | Yunji | | Services & Goods | 0.75 | 48 | -3.04% | 5.51% |
| LKCO | Luokung | | Technology | 0.52 | 33 | 0.00% | 5.43% |
| ATAT | Atour Lifestyle | | Services & Goods | 18.41 | 83 | 0.85% | 5.08% |
| SRL | Scully Royalty | | Financials | 6.40 | 30 | 2.09% | 4.92% |
| HCM | Hutchison China | | Health Care | 18.99 | 85 | 3.15% | 4.86% |
| XYF | X Financial | | Financials | 3.77 | 25 | -1.44% | 3.14% |
| BILI | Bilibili | | Technology | 12.51 | 73 | -1.88% | 2.79% |
| MOGU | MOGU | | Services & Goods | 1.93 | 93 | 8.43% | 1.05% |
| NTES | NetEase | | Technology | 94.12 | 25 | 0.11% | 1.03% |
| PT | Pintec | | Technology | 1.11 | 32 | 0.00% | 0.00% |
| XIN | Xinyuan Real | | Financials | 2.72 | 49 | -0.37% | 0.00% |
| SVA | Sinovac Biotech | | Health Care | 6.47 | 27 | 0.00% | 0.00% |
| For chart view version of above stock list: Chart View ➞ 0 - 25 , 25 - 50 , 50 - 75 , 75 - 100 , 100 - 125 , 125 - 150 | ||
 | Click To Change The Sort Order: By Market Cap or Company Size Performance: Year-to-date, Week and Day |  |
|
Get the most comprehensive stock market coverage daily at 12Stocks.com ➞ Best Stocks Today ➞ Best Stocks Weekly ➞ Best Stocks Year-to-Date ➞ Best Stocks Trends ➞  Best Stocks Today 12Stocks.com Best Nasdaq Stocks ➞ Best S&P 500 Stocks ➞ Best Tech Stocks ➞ Best Biotech Stocks ➞ |
| Detailed Overview of China Stocks |
| China Technical Overview, Leaders & Laggards, Top China ETF Funds & Detailed China Stocks List, Charts, Trends & More |
| China: Technical Analysis, Trends & YTD Performance | |
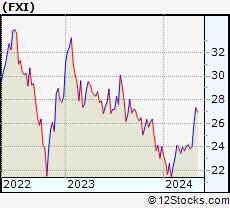
 FXI Weekly Chart |
|
| Long Term Trend: Very Good | |
| Medium Term Trend: Very Good | |
 FXI Daily Chart |
|
| Short Term Trend: Very Good | |
| Overall Trend Score: 100 | |
| YTD Performance: 5.87% | |
| **Trend Scores & Views Are Only For Educational Purposes And Not For Investing | |
| 12Stocks.com: Investing in China Index using Exchange Traded Funds | |
|
The following table shows list of key exchange traded funds (ETF) that
help investors play China stock market. For detailed view, check out our ETF Funds section of our website. Quick View: Move mouse or cursor over ETF symbol (ticker) to view short-term technical chart and over ETF name to view long term chart. Click on ticker or stock name for detailed view. Click on to add stock symbol to your watchlist and to view watchlist. |
12Stocks.com List of ETFs that track China Index
| Ticker | ETF Name | Watchlist | Recent Price | Smart Investing & Trading Score | Change % | Week % | Year-to-date % |
| FXI | China Large-Cap | | 25.44 | 100 | 0.67 | 5.96 | 5.87% |
| EWH | Hong Kong | | 15.71 | 80 | 1.35 | 6.87 | -9.56% |
| YINN | China Bull 3X | | 22.09 | 100 | 2.27 | 17.69 | 5.49% |
| YANG | China Bear 3X | | 9.83 | 0 | -2.09 | -15.77 | -23.2% |
| XPP | China 50 | | 14.45 | 100 | 0.63 | 11.43 | 5.13% |
| MCHI | China | | 41.55 | 100 | 0.51 | 5.43 | 1.99% |
| GXC | China | | 68.20 | 100 | 0.65 | 4.39 | 0.12% |
| CBON | ChinaAMC China Bond | | 21.89 | 48 | 0.37 | -0.16 | -0.95% |
| 12Stocks.com: Charts, Trends, Fundamental Data and Performances of China Stocks | |
|
We now take in-depth look at all China stocks including charts, multi-period performances and overall trends (as measured by Smart Investing & Trading Score). One can sort China stocks (click link to choose) by Daily, Weekly and by Year-to-Date performances. Also, one can sort by size of the company or by market capitalization. |
| Select Your Default Chart Type: | |||||
| |||||
| Click on stock symbol or name for detailed view. Click on to add stock symbol to your watchlist and to view watchlist. Quick View: Move mouse or cursor over "Daily" to quickly view daily technical stock chart and over "Weekly" to view weekly technical stock chart. | |||||

 | HTHT Huazhu Group Limited |
| Sector: Services & Goods | |
| SubSector: Lodging | |
| MarketCap: 9164.46 Millions | |
| Recent Price: 39.74 Smart Investing & Trading Score: 80 | |
| Day Percent Change: 1.48% Day Change: 0.58 | |
| Week Change: 7.73% Year-to-date Change: 18.8% | |
| HTHT Links: Profile News Message Board | |
| Charts:- Daily , Weekly | |
| Add HTHT to Watchlist: View: Get Complete HTHT Trend Analysis ➞ | |
 | BZ Kanzhun Limited |
| Sector: Industrials | |
| SubSector: Staffing & Employment Services | |
| MarketCap: 6680 Millions | |
| Recent Price: 19.60 Smart Investing & Trading Score: 100 | |
| Day Percent Change: 3.29% Day Change: 0.63 | |
| Week Change: 9.87% Year-to-date Change: 18.6% | |
| BZ Links: Profile News Message Board | |
| Charts:- Daily , Weekly | |
| Add BZ to Watchlist: View: Get Complete BZ Trend Analysis ➞ | |
 | EM Smart Share Global Limited |
| Sector: Services & Goods | |
| SubSector: Personal Services | |
| MarketCap: 238 Millions | |
| Recent Price: 0.60 Smart Investing & Trading Score: 71 | |
| Day Percent Change: -4.76% Day Change: -0.03 | |
| Week Change: -6.25% Year-to-date Change: 16.5% | |
| EM Links: Profile News Message Board | |
| Charts:- Daily , Weekly | |
| Add EM to Watchlist: View: Get Complete EM Trend Analysis ➞ | |
 | WIMI WiMi Hologram Cloud Inc. |
| Sector: Technology | |
| SubSector: Advertising Agencies | |
| MarketCap: 41837 Millions | |
| Recent Price: 0.93 Smart Investing & Trading Score: 93 | |
| Day Percent Change: -19.01% Day Change: -0.22 | |
| Week Change: 33.51% Year-to-date Change: 15.7% | |
| WIMI Links: Profile News Message Board | |
| Charts:- Daily , Weekly | |
| Add WIMI to Watchlist: View: Get Complete WIMI Trend Analysis ➞ | |
 | WDH Waterdrop Inc. |
| Sector: Financials | |
| SubSector: Insurance - Diversified | |
| MarketCap: 874 Millions | |
| Recent Price: 1.20 Smart Investing & Trading Score: 53 | |
| Day Percent Change: 0.84% Day Change: 0.01 | |
| Week Change: -1.64% Year-to-date Change: 14.6% | |
| WDH Links: Profile News Message Board | |
| Charts:- Daily , Weekly | |
| Add WDH to Watchlist: View: Get Complete WDH Trend Analysis ➞ | |
 | SOHU Sohu.com Limited |
| Sector: Technology | |
| SubSector: Internet Information Providers | |
| MarketCap: 243.48 Millions | |
| Recent Price: 11.20 Smart Investing & Trading Score: 68 | |
| Day Percent Change: -0.27% Day Change: -0.03 | |
| Week Change: 2.1% Year-to-date Change: 12.8% | |
| SOHU Links: Profile News Message Board | |
| Charts:- Daily , Weekly | |
| Add SOHU to Watchlist: View: Get Complete SOHU Trend Analysis ➞ | |
 | JG Aurora Mobile Limited |
| Sector: Technology | |
| SubSector: Application Software | |
| MarketCap: 268.762 Millions | |
| Recent Price: 3.14 Smart Investing & Trading Score: 32 | |
| Day Percent Change: 0.00% Day Change: 0.00 | |
| Week Change: 7.53% Year-to-date Change: 10.1% | |
| JG Links: Profile News Message Board | |
| Charts:- Daily , Weekly | |
| Add JG to Watchlist: View: Get Complete JG Trend Analysis ➞ | |
 | EDU New Oriental Education & Technology Group Inc. |
| Sector: Services & Goods | |
| SubSector: Education & Training Services | |
| MarketCap: 18673.7 Millions | |
| Recent Price: 79.64 Smart Investing & Trading Score: 26 | |
| Day Percent Change: 3.32% Day Change: 2.56 | |
| Week Change: -6.29% Year-to-date Change: 8.7% | |
| EDU Links: Profile News Message Board | |
| Charts:- Daily , Weekly | |
| Add EDU to Watchlist: View: Get Complete EDU Trend Analysis ➞ | |
 | EH EHang Holdings Limited |
| Sector: Industrials | |
| SubSector: Aerospace/Defense Products & Services | |
| MarketCap: 513.401 Millions | |
| Recent Price: 18.20 Smart Investing & Trading Score: 68 | |
| Day Percent Change: 4.12% Day Change: 0.72 | |
| Week Change: 3.94% Year-to-date Change: 8.3% | |
| EH Links: Profile News Message Board | |
| Charts:- Daily , Weekly | |
| Add EH to Watchlist: View: Get Complete EH Trend Analysis ➞ | |
 | MNSO MINISO Group Holding Limited |
| Sector: Services & Goods | |
| SubSector: Specialty Retail | |
| MarketCap: 69427 Millions | |
| Recent Price: 22.09 Smart Investing & Trading Score: 93 | |
| Day Percent Change: -2.17% Day Change: -0.49 | |
| Week Change: 7.73% Year-to-date Change: 8.3% | |
| MNSO Links: Profile News Message Board | |
| Charts:- Daily , Weekly | |
| Add MNSO to Watchlist: View: Get Complete MNSO Trend Analysis ➞ | |
 | MSC Studio City International Holdings Limited |
| Sector: Services & Goods | |
| SubSector: Resorts & Casinos | |
| MarketCap: 1420.54 Millions | |
| Recent Price: 7.00 Smart Investing & Trading Score: 46 | |
| Day Percent Change: -3.18% Day Change: -0.23 | |
| Week Change: -6.54% Year-to-date Change: 8.0% | |
| MSC Links: Profile News Message Board | |
| Charts:- Daily , Weekly | |
| Add MSC to Watchlist: View: Get Complete MSC Trend Analysis ➞ | |
 | TWN The Taiwan Fund, Inc. |
| Sector: Financials | |
| SubSector: Closed-End Fund - Foreign | |
| MarketCap: 110.547 Millions | |
| Recent Price: 36.72 Smart Investing & Trading Score: 36 | |
| Day Percent Change: -1.67% Day Change: -0.62 | |
| Week Change: -2.86% Year-to-date Change: 6.2% | |
| TWN Links: Profile News Message Board | |
| Charts:- Daily , Weekly | |
| Add TWN to Watchlist: View: Get Complete TWN Trend Analysis ➞ | |
 | TAL TAL Education Group |
| Sector: Services & Goods | |
| SubSector: Education & Training Services | |
| MarketCap: 30103.1 Millions | |
| Recent Price: 13.35 Smart Investing & Trading Score: 90 | |
| Day Percent Change: 8.89% Day Change: 1.09 | |
| Week Change: 16.8% Year-to-date Change: 5.7% | |
| TAL Links: Profile News Message Board | |
| Charts:- Daily , Weekly | |
| Add TAL to Watchlist: View: Get Complete TAL Trend Analysis ➞ | |
 | YJ Yunji Inc. |
| Sector: Services & Goods | |
| SubSector: Specialty Retail, Other | |
| MarketCap: 770.644 Millions | |
| Recent Price: 0.75 Smart Investing & Trading Score: 48 | |
| Day Percent Change: -3.04% Day Change: -0.02 | |
| Week Change: 0.62% Year-to-date Change: 5.5% | |
| YJ Links: Profile News Message Board | |
| Charts:- Daily , Weekly | |
| Add YJ to Watchlist: View: Get Complete YJ Trend Analysis ➞ | |
 | LKCO Luokung Technology Corp. |
| Sector: Technology | |
| SubSector: Application Software | |
| MarketCap: 84 Millions | |
| Recent Price: 0.52 Smart Investing & Trading Score: 33 | |
| Day Percent Change: 0.00% Day Change: 0.00 | |
| Week Change: -3.04% Year-to-date Change: 5.4% | |
| LKCO Links: Profile News Message Board | |
| Charts:- Daily , Weekly | |
| Add LKCO to Watchlist: View: Get Complete LKCO Trend Analysis ➞ | |
 | ATAT Atour Lifestyle Holdings Limited |
| Sector: Services & Goods | |
| SubSector: Lodging | |
| MarketCap: 2120 Millions | |
| Recent Price: 18.41 Smart Investing & Trading Score: 83 | |
| Day Percent Change: 0.85% Day Change: 0.16 | |
| Week Change: 6.79% Year-to-date Change: 5.1% | |
| ATAT Links: Profile News Message Board | |
| Charts:- Daily , Weekly | |
| Add ATAT to Watchlist: View: Get Complete ATAT Trend Analysis ➞ | |
 | SRL Scully Royalty Ltd. |
| Sector: Financials | |
| SubSector: Asset Management | |
| MarketCap: 88.3203 Millions | |
| Recent Price: 6.40 Smart Investing & Trading Score: 30 | |
| Day Percent Change: 2.09% Day Change: 0.13 | |
| Week Change: -1.99% Year-to-date Change: 4.9% | |
| SRL Links: Profile News Message Board | |
| Charts:- Daily , Weekly | |
| Add SRL to Watchlist: View: Get Complete SRL Trend Analysis ➞ | |
 | HCM Hutchison China MediTech Limited |
| Sector: Health Care | |
| SubSector: Drug Manufacturers - Major | |
| MarketCap: 2324.43 Millions | |
| Recent Price: 18.99 Smart Investing & Trading Score: 85 | |
| Day Percent Change: 3.15% Day Change: 0.58 | |
| Week Change: 15.16% Year-to-date Change: 4.9% | |
| HCM Links: Profile News Message Board | |
| Charts:- Daily , Weekly | |
| Add HCM to Watchlist: View: Get Complete HCM Trend Analysis ➞ | |
 | XYF X Financial |
| Sector: Financials | |
| SubSector: Credit Services | |
| MarketCap: 168.008 Millions | |
| Recent Price: 3.77 Smart Investing & Trading Score: 25 | |
| Day Percent Change: -1.44% Day Change: -0.06 | |
| Week Change: -0.13% Year-to-date Change: 3.1% | |
| XYF Links: Profile News Message Board | |
| Charts:- Daily , Weekly | |
| Add XYF to Watchlist: View: Get Complete XYF Trend Analysis ➞ | |
 | BILI Bilibili Inc. |
| Sector: Technology | |
| SubSector: Internet Information Providers | |
| MarketCap: 7043.1 Millions | |
| Recent Price: 12.51 Smart Investing & Trading Score: 73 | |
| Day Percent Change: -1.88% Day Change: -0.24 | |
| Week Change: 14.67% Year-to-date Change: 2.8% | |
| BILI Links: Profile News Message Board | |
| Charts:- Daily , Weekly | |
| Add BILI to Watchlist: View: Get Complete BILI Trend Analysis ➞ | |
 | MOGU MOGU Inc. |
| Sector: Services & Goods | |
| SubSector: Specialty Retail, Other | |
| MarketCap: 168.844 Millions | |
| Recent Price: 1.93 Smart Investing & Trading Score: 93 | |
| Day Percent Change: 8.43% Day Change: 0.15 | |
| Week Change: -3.02% Year-to-date Change: 1.1% | |
| MOGU Links: Profile News Message Board | |
| Charts:- Daily , Weekly | |
| Add MOGU to Watchlist: View: Get Complete MOGU Trend Analysis ➞ | |
 | NTES NetEase, Inc. |
| Sector: Technology | |
| SubSector: Internet Software & Services | |
| MarketCap: 40105.1 Millions | |
| Recent Price: 94.12 Smart Investing & Trading Score: 25 | |
| Day Percent Change: 0.11% Day Change: 0.10 | |
| Week Change: 0.65% Year-to-date Change: 1.0% | |
| NTES Links: Profile News Message Board | |
| Charts:- Daily , Weekly | |
| Add NTES to Watchlist: View: Get Complete NTES Trend Analysis ➞ | |
 | PT Pintec Technology Holdings Limited |
| Sector: Technology | |
| SubSector: Wireless Communications | |
| MarketCap: 87.7827 Millions | |
| Recent Price: 1.11 Smart Investing & Trading Score: 32 | |
| Day Percent Change: 0.00% Day Change: 0.00 | |
| Week Change: 3.74% Year-to-date Change: 0.0% | |
| PT Links: Profile News Message Board | |
| Charts:- Daily , Weekly | |
| Add PT to Watchlist: View: Get Complete PT Trend Analysis ➞ | |
 | XIN Xinyuan Real Estate Co., Ltd. |
| Sector: Financials | |
| SubSector: Real Estate Development | |
| MarketCap: 136.119 Millions | |
| Recent Price: 2.72 Smart Investing & Trading Score: 49 | |
| Day Percent Change: -0.37% Day Change: -0.01 | |
| Week Change: 4.62% Year-to-date Change: 0.0% | |
| XIN Links: Profile News Message Board | |
| Charts:- Daily , Weekly | |
| Add XIN to Watchlist: View: Get Complete XIN Trend Analysis ➞ | |
 | SVA Sinovac Biotech Ltd. |
| Sector: Health Care | |
| SubSector: Biotechnology | |
| MarketCap: 336.88 Millions | |
| Recent Price: 6.47 Smart Investing & Trading Score: 27 | |
| Day Percent Change: 0.00% Day Change: 0.00 | |
| Week Change: 0% Year-to-date Change: 0.0% | |
| SVA Links: Profile News Message Board | |
| Charts:- Daily , Weekly | |
| Add SVA to Watchlist: View: Get Complete SVA Trend Analysis ➞ | |
| For tabular summary view of above stock list: Summary View ➞ 0 - 25 , 25 - 50 , 50 - 75 , 75 - 100 , 100 - 125 , 125 - 150 | ||
| Click To Change The Sort Order: By Market Cap or Company Size Performance: Year-to-date, Week and Day | |
| Select Chart Type: | ||
|
Best Stocks Today 12Stocks.com |
© 2024 12Stocks.com Terms & Conditions Privacy Contact Us
All Information Provided Only For Education And Not To Be Used For Investing or Trading. See Terms & Conditions


One More Thing ... Get Best Stocks Delivered Daily!
Never Ever Miss A Move With Our Top Ten Stocks Lists
Find Best Stocks In Any Market - Bull or Bear Market
Take A Peek At Our Top Ten Stocks Lists: Daily, Weekly, Year-to-Date & Top Trends
Find Best Stocks In Any Market - Bull or Bear Market
Take A Peek At Our Top Ten Stocks Lists: Daily, Weekly, Year-to-Date & Top Trends
China Stocks With Best Up Trends [0-bearish to 100-bullish]: Yatsen Holding[100], Kanzhun [100], JD.com [100], Dada Nexus[100], ZTO Express[100], Alibaba [100], Baozun [95], MOGU [93], Full Truck[93], MINISO [93], U Power[93]
Best China Stocks Year-to-Date:
U Power[2852.01%], DouYu [791.58%], MicroCloud Hologram[668.35%], China Liberal[520.81%], Yatsen Holding[502.79%], Zhongchao [312.22%], Uxin [172.47%], QuantaSing [103.7%], GigaCloud [97.54%], Cheetah Mobile[88.16%], Yiren Digital[61.54%] Best China Stocks This Week:
WiMi Hologram[33.51%], Yatsen Holding[21.99%], Cheetah Mobile[21.19%], iQIYI [17.99%], Aesthetic Medical[17.77%], TAL Education[16.8%], Golden Heaven[15.91%], Hutchison China[15.16%], BeiGene [14.7%], Bilibili [14.67%], TOP Financial[14.04%] Best China Stocks Daily:
Boqii Holding[15.69%], MicroCloud Hologram[13.86%], TAL Education[8.89%], MOGU [8.43%], Cheetah Mobile[8.33%], Shengfeng Development[7.69%], Viomi [7.13%], Fangdd Network[5.41%], Secoo Holding[5.19%], 21Vianet [5.06%], Regencell Bioscience[4.90%]