
 Login Sign Up


| |||||
 |  | ||||

| 12Stocks.com Market Intelligence |
Best China Stocks
|
On this page, you will find the most comprehensive analysis of Chinese stocks and ETFs - from latest trends to performances to charts ➞. First, here are the year-to-date (YTD) performances of the most requested China stocks at 12Stocks.com (click stock for review):
| Sohu.com 16% | ||
| New Oriental 5% | ||
| NetEase 0% | ||
| JD.com 0% | ||
| Alibaba -3% | ||
| Baidu -13% | ||
| Vipshop -15% | ||
| JOYY -18% | ||
| Weibo -21% | ||
| In a hurry? China Stocks Lists: Performance Trends Table, Stock Charts
Sort China stocks: Daily, Weekly, Year-to-Date, Market Cap & Trends. Filter China stocks list by sector: Show all, Tech, Finance, Energy, Staples, Retail, Industrial, Materials, Utilities and HealthCare Filter China stocks list by size: All China Large Medium Small and MicroCap |
| May 1, 2024 - 12Stocks.com China Stocks Performances & Trends Daily | |||||||||
|
|  The overall Smart Investing & Trading Score is 76 (0-bearish to 100-bullish) which puts China index in short term neutral to bullish trend. The Smart Investing & Trading Score from previous trading session is 100 and hence a deterioration of trend.
| ||||||||
| Here are the Smart Investing & Trading Scores of the most requested China stocks at 12Stocks.com (click stock name for detailed review): |

| 12Stocks.com: Top Performing China Index Stocks | ||||||||||||||||||||||||||||||||||||||||||||||||
 The top performing China Index stocks year to date are
Now, more recently, over last week, the top performing China Index stocks on the move are


|
||||||||||||||||||||||||||||||||||||||||||||||||
| 12Stocks.com: Investing in China Index with Stocks | |
|
The following table helps investors and traders sort through current performance and trends (as measured by Smart Investing & Trading Score) of various
stocks in the China Index. Quick View: Move mouse or cursor over stock symbol (ticker) to view short-term technical chart and over stock name to view long term chart. Click on  to add stock symbol to your watchlist and to add stock symbol to your watchlist and  to view watchlist. Click on any ticker or stock name for detailed market intelligence report for that stock. to view watchlist. Click on any ticker or stock name for detailed market intelligence report for that stock. |
12Stocks.com Performance of Stocks in China Index
| Ticker | Stock Name | Watchlist | Category | Recent Price | Smart Investing & Trading Score | Change % | YTD Change% |
| HKD | AMTD Digital |   | Technology | 3.29 | 30 | -2.37% | -20.34% |
| THCH | TH | | Services & Goods | 1.13 | 30 | -1.74% | -35.06% |
| NTES | NetEase | | Technology | 93.47 | 30 | -3.27% | 0.33% |
| SVA | Sinovac Biotech | | Health Care | 6.47 | 27 | 0.00% | 0.00% |
| YRD | Yiren Digital | | Financials | 5.04 | 26 | 0.40% | 61.54% |
| JFIN | Jiayin | | Technology | 6.28 | 26 | -2.64% | 21.24% |
| CLEU | China Liberal | | Consumer Staples | 1.08 | 25 | -3.31% | 504.03% |
| UXIN | Uxin | | Technology | 1.85 | 25 | 0.54% | 163.91% |
| EBON | Ebang | | Technology | 7.59 | 24 | -0.13% | -50.31% |
| HYW | Hywin | | Financials | 0.81 | 20 | 0.00% | -56.22% |
| AIXI | Xiao-I | | Technology | 1.22 | 20 | -6.15% | -45.78% |
| UTSI | UTStarcom | | Technology | 2.68 | 20 | -2.54% | -22.09% |
| YI | 111 | | Services & Goods | 1.04 | 20 | -2.35% | -32.90% |
| TOP | TOP Financial | | Financials | 2.54 | 20 | -0.78% | -31.72% |
| STG | Sunlands | | Services & Goods | 7.99 | 17 | 6.39% | -21.44% |
| RGC | Regencell Bioscience | | Health Care | 5.27 | 17 | 13.33% | -49.81% |
| LX | LexinFintech | | Financials | 1.68 | 17 | -4.00% | -8.70% |
| PT | Pintec | | Technology | 1.07 | 17 | -0.65% | -3.60% |
| EDU | New Oriental | | Services & Goods | 77.10 | 13 | -6.33% | 5.21% |
| FINV | FinVolution | | Financials | 4.77 | 13 | -1.85% | -2.65% |
| BNR | Burning Rock | | Health Care | 0.76 | 13 | -9.73% | -21.74% |
| CNF | CNFinance | | Financials | 1.85 | 10 | 1.09% | -16.67% |
| QSG | QuantaSing | | Consumer Staples | 3.01 | 10 | -11.21% | 85.80% |
| AGMH | AGM | | Technology | 1.04 | 10 | -0.95% | -42.54% |
| IH | iHuman | | Consumer Staples | 1.73 | 10 | -0.29% | -43.44% |
| For chart view version of above stock list: Chart View ➞ 0 - 25 , 25 - 50 , 50 - 75 , 75 - 100 , 100 - 125 , 125 - 150 | ||
 | Click To Change The Sort Order: By Market Cap or Company Size Performance: Year-to-date, Week and Day |  |
|
Get the most comprehensive stock market coverage daily at 12Stocks.com ➞ Best Stocks Today ➞ Best Stocks Weekly ➞ Best Stocks Year-to-Date ➞ Best Stocks Trends ➞  Best Stocks Today 12Stocks.com Best Nasdaq Stocks ➞ Best S&P 500 Stocks ➞ Best Tech Stocks ➞ Best Biotech Stocks ➞ |
| Detailed Overview of China Stocks |
| China Technical Overview, Leaders & Laggards, Top China ETF Funds & Detailed China Stocks List, Charts, Trends & More |
| China: Technical Analysis, Trends & YTD Performance | |
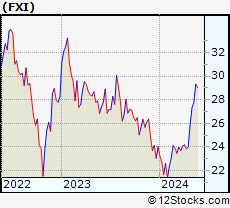
 FXI Weekly Chart |
|
| Long Term Trend: Very Good | |
| Medium Term Trend: Very Good | |
 FXI Daily Chart |
|
| Short Term Trend: Good | |
| Overall Trend Score: 76 | |
| YTD Performance: 6.08% | |
| **Trend Scores & Views Are Only For Educational Purposes And Not For Investing | |
| 12Stocks.com: Investing in China Index using Exchange Traded Funds | |
|
The following table shows list of key exchange traded funds (ETF) that
help investors play China stock market. For detailed view, check out our ETF Funds section of our website. Quick View: Move mouse or cursor over ETF symbol (ticker) to view short-term technical chart and over ETF name to view long term chart. Click on ticker or stock name for detailed view. Click on to add stock symbol to your watchlist and to view watchlist. |
12Stocks.com List of ETFs that track China Index
| Ticker | ETF Name | Watchlist | Recent Price | Smart Investing & Trading Score | Change % | Week % | Year-to-date % |
| FXI | China Large-Cap | | 25.49 | 76 | -2.37 | -1.47 | 6.08% |
| EWH | Hong Kong | | 16.04 | 88 | -1.23 | 0.38 | -7.66% |
| YINN | China Bull 3X | | 22.22 | 76 | -6.52 | -4.27 | 6.11% |
| YANG | China Bear 3X | | 9.67 | 27 | 6.38 | 3.53 | -24.45% |
| XPP | China 50 | | 14.54 | 76 | -4.40 | -3.25 | 5.79% |
| MCHI | China | | 41.88 | 83 | -2.08 | -1.11 | 2.8% |
| GXC | China | | 68.89 | 83 | -1.73 | -0.79 | 1.13% |
| CBON | ChinaAMC China Bond | | 21.86 | 38 | -0.02 | 0.09 | -1.08% |
| 12Stocks.com: Charts, Trends, Fundamental Data and Performances of China Stocks | |
|
We now take in-depth look at all China stocks including charts, multi-period performances and overall trends (as measured by Smart Investing & Trading Score). One can sort China stocks (click link to choose) by Daily, Weekly and by Year-to-Date performances. Also, one can sort by size of the company or by market capitalization. |
| Select Your Default Chart Type: | |||||
| |||||
| Click on stock symbol or name for detailed view. Click on to add stock symbol to your watchlist and to view watchlist. Quick View: Move mouse or cursor over "Daily" to quickly view daily technical stock chart and over "Weekly" to view weekly technical stock chart. | |||||

 | HKD AMTD Digital Inc. |
| Sector: Technology | |
| SubSector: Software - Application | |
| MarketCap: 1200 Millions | |
| Recent Price: 3.29 Smart Investing & Trading Score: 30 | |
| Day Percent Change: -2.37% Day Change: -0.08 | |
| Week Change: 1.54% Year-to-date Change: -20.3% | |
| HKD Links: Profile News Message Board | |
| Charts:- Daily , Weekly | |
| Add HKD to Watchlist: View: Get Complete HKD Trend Analysis ➞ | |
 | THCH TH International Limited |
| Sector: Services & Goods | |
| SubSector: Restaurants | |
| MarketCap: 452 Millions | |
| Recent Price: 1.13 Smart Investing & Trading Score: 30 | |
| Day Percent Change: -1.74% Day Change: -0.02 | |
| Week Change: -0.88% Year-to-date Change: -35.1% | |
| THCH Links: Profile News Message Board | |
| Charts:- Daily , Weekly | |
| Add THCH to Watchlist: View: Get Complete THCH Trend Analysis ➞ | |
 | NTES NetEase, Inc. |
| Sector: Technology | |
| SubSector: Internet Software & Services | |
| MarketCap: 40105.1 Millions | |
| Recent Price: 93.47 Smart Investing & Trading Score: 30 | |
| Day Percent Change: -3.27% Day Change: -3.16 | |
| Week Change: -2.63% Year-to-date Change: 0.3% | |
| NTES Links: Profile News Message Board | |
| Charts:- Daily , Weekly | |
| Add NTES to Watchlist: View: Get Complete NTES Trend Analysis ➞ | |
 | SVA Sinovac Biotech Ltd. |
| Sector: Health Care | |
| SubSector: Biotechnology | |
| MarketCap: 336.88 Millions | |
| Recent Price: 6.47 Smart Investing & Trading Score: 27 | |
| Day Percent Change: 0.00% Day Change: 0.00 | |
| Week Change: 0% Year-to-date Change: 0.0% | |
| SVA Links: Profile News Message Board | |
| Charts:- Daily , Weekly | |
| Add SVA to Watchlist: View: Get Complete SVA Trend Analysis ➞ | |
 | YRD Yiren Digital Ltd. |
| Sector: Financials | |
| SubSector: Credit Services | |
| MarketCap: 330.208 Millions | |
| Recent Price: 5.04 Smart Investing & Trading Score: 26 | |
| Day Percent Change: 0.40% Day Change: 0.02 | |
| Week Change: -0.79% Year-to-date Change: 61.5% | |
| YRD Links: Profile News Message Board | |
| Charts:- Daily , Weekly | |
| Add YRD to Watchlist: View: Get Complete YRD Trend Analysis ➞ | |
 | JFIN Jiayin Group Inc. |
| Sector: Technology | |
| SubSector: Internet Information Providers | |
| MarketCap: 131.48 Millions | |
| Recent Price: 6.28 Smart Investing & Trading Score: 26 | |
| Day Percent Change: -2.64% Day Change: -0.17 | |
| Week Change: -5.42% Year-to-date Change: 21.2% | |
| JFIN Links: Profile News Message Board | |
| Charts:- Daily , Weekly | |
| Add JFIN to Watchlist: View: Get Complete JFIN Trend Analysis ➞ | |
 | CLEU China Liberal Education Holdings Limited |
| Sector: Consumer Staples | |
| SubSector: Education & Training Services | |
| MarketCap: 32347 Millions | |
| Recent Price: 1.08 Smart Investing & Trading Score: 25 | |
| Day Percent Change: -3.31% Day Change: -0.04 | |
| Week Change: 0% Year-to-date Change: 504.0% | |
| CLEU Links: Profile News Message Board | |
| Charts:- Daily , Weekly | |
| Add CLEU to Watchlist: View: Get Complete CLEU Trend Analysis ➞ | |
 | UXIN Uxin Limited |
| Sector: Technology | |
| SubSector: Internet Information Providers | |
| MarketCap: 414.58 Millions | |
| Recent Price: 1.85 Smart Investing & Trading Score: 25 | |
| Day Percent Change: 0.54% Day Change: 0.01 | |
| Week Change: 1.65% Year-to-date Change: 163.9% | |
| UXIN Links: Profile News Message Board | |
| Charts:- Daily , Weekly | |
| Add UXIN to Watchlist: View: Get Complete UXIN Trend Analysis ➞ | |
 | EBON Ebang International Holdings Inc. |
| Sector: Technology | |
| SubSector: Computer Hardware | |
| MarketCap: 33787 Millions | |
| Recent Price: 7.59 Smart Investing & Trading Score: 24 | |
| Day Percent Change: -0.13% Day Change: -0.01 | |
| Week Change: -2.75% Year-to-date Change: -50.3% | |
| EBON Links: Profile News Message Board | |
| Charts:- Daily , Weekly | |
| Add EBON to Watchlist: View: Get Complete EBON Trend Analysis ➞ | |
 | HYW Hywin Holdings Ltd. |
| Sector: Financials | |
| SubSector: Asset Management | |
| MarketCap: 161 Millions | |
| Recent Price: 0.81 Smart Investing & Trading Score: 20 | |
| Day Percent Change: 0.00% Day Change: 0.00 | |
| Week Change: -4.41% Year-to-date Change: -56.2% | |
| HYW Links: Profile News Message Board | |
| Charts:- Daily , Weekly | |
| Add HYW to Watchlist: View: Get Complete HYW Trend Analysis ➞ | |
 | AIXI Xiao-I Corporation |
| Sector: Technology | |
| SubSector: Software - Application | |
| MarketCap: 431 Millions | |
| Recent Price: 1.22 Smart Investing & Trading Score: 20 | |
| Day Percent Change: -6.15% Day Change: -0.08 | |
| Week Change: -4.69% Year-to-date Change: -45.8% | |
| AIXI Links: Profile News Message Board | |
| Charts:- Daily , Weekly | |
| Add AIXI to Watchlist: View: Get Complete AIXI Trend Analysis ➞ | |
 | UTSI UTStarcom Holdings Corp. |
| Sector: Technology | |
| SubSector: Communication Equipment | |
| MarketCap: 76.6539 Millions | |
| Recent Price: 2.68 Smart Investing & Trading Score: 20 | |
| Day Percent Change: -2.54% Day Change: -0.07 | |
| Week Change: -2.55% Year-to-date Change: -22.1% | |
| UTSI Links: Profile News Message Board | |
| Charts:- Daily , Weekly | |
| Add UTSI to Watchlist: View: Get Complete UTSI Trend Analysis ➞ | |
 | YI 111, Inc. |
| Sector: Services & Goods | |
| SubSector: Drug Stores | |
| MarketCap: 520.351 Millions | |
| Recent Price: 1.04 Smart Investing & Trading Score: 20 | |
| Day Percent Change: -2.35% Day Change: -0.02 | |
| Week Change: 1.46% Year-to-date Change: -32.9% | |
| YI Links: Profile News Message Board | |
| Charts:- Daily , Weekly | |
| Add YI to Watchlist: View: Get Complete YI Trend Analysis ➞ | |
 | TOP TOP Financial Group Limited |
| Sector: Financials | |
| SubSector: Capital Markets | |
| MarketCap: 329 Millions | |
| Recent Price: 2.54 Smart Investing & Trading Score: 20 | |
| Day Percent Change: -0.78% Day Change: -0.02 | |
| Week Change: -4.87% Year-to-date Change: -31.7% | |
| TOP Links: Profile News Message Board | |
| Charts:- Daily , Weekly | |
| Add TOP to Watchlist: View: Get Complete TOP Trend Analysis ➞ | |
 | STG Sunlands Technology Group |
| Sector: Services & Goods | |
| SubSector: Education & Training Services | |
| MarketCap: 295.706 Millions | |
| Recent Price: 7.99 Smart Investing & Trading Score: 17 | |
| Day Percent Change: 6.39% Day Change: 0.48 | |
| Week Change: 0.44% Year-to-date Change: -21.4% | |
| STG Links: Profile News Message Board | |
| Charts:- Daily , Weekly | |
| Add STG to Watchlist: View: Get Complete STG Trend Analysis ➞ | |
 | RGC Regencell Bioscience Holdings Limited |
| Sector: Health Care | |
| SubSector: Drug Manufacturers - Specialty & Generic | |
| MarketCap: 284 Millions | |
| Recent Price: 5.27 Smart Investing & Trading Score: 17 | |
| Day Percent Change: 13.33% Day Change: 0.62 | |
| Week Change: -1.5% Year-to-date Change: -49.8% | |
| RGC Links: Profile News Message Board | |
| Charts:- Daily , Weekly | |
| Add RGC to Watchlist: View: Get Complete RGC Trend Analysis ➞ | |
 | LX LexinFintech Holdings Ltd. |
| Sector: Financials | |
| SubSector: Credit Services | |
| MarketCap: 1674.18 Millions | |
| Recent Price: 1.68 Smart Investing & Trading Score: 17 | |
| Day Percent Change: -4.00% Day Change: -0.07 | |
| Week Change: -1.75% Year-to-date Change: -8.7% | |
| LX Links: Profile News Message Board | |
| Charts:- Daily , Weekly | |
| Add LX to Watchlist: View: Get Complete LX Trend Analysis ➞ | |
 | PT Pintec Technology Holdings Limited |
| Sector: Technology | |
| SubSector: Wireless Communications | |
| MarketCap: 87.7827 Millions | |
| Recent Price: 1.07 Smart Investing & Trading Score: 17 | |
| Day Percent Change: -0.65% Day Change: -0.01 | |
| Week Change: -0.93% Year-to-date Change: -3.6% | |
| PT Links: Profile News Message Board | |
| Charts:- Daily , Weekly | |
| Add PT to Watchlist: View: Get Complete PT Trend Analysis ➞ | |
 | EDU New Oriental Education & Technology Group Inc. |
| Sector: Services & Goods | |
| SubSector: Education & Training Services | |
| MarketCap: 18673.7 Millions | |
| Recent Price: 77.10 Smart Investing & Trading Score: 13 | |
| Day Percent Change: -6.33% Day Change: -5.21 | |
| Week Change: -7.4% Year-to-date Change: 5.2% | |
| EDU Links: Profile News Message Board | |
| Charts:- Daily , Weekly | |
| Add EDU to Watchlist: View: Get Complete EDU Trend Analysis ➞ | |
 | FINV FinVolution Group |
| Sector: Financials | |
| SubSector: Credit Services | |
| MarketCap: 476.208 Millions | |
| Recent Price: 4.77 Smart Investing & Trading Score: 13 | |
| Day Percent Change: -1.85% Day Change: -0.09 | |
| Week Change: -2.45% Year-to-date Change: -2.7% | |
| FINV Links: Profile News Message Board | |
| Charts:- Daily , Weekly | |
| Add FINV to Watchlist: View: Get Complete FINV Trend Analysis ➞ | |
 | BNR Burning Rock Biotech Limited |
| Sector: Health Care | |
| SubSector: Diagnostics & Research | |
| MarketCap: 27887 Millions | |
| Recent Price: 0.76 Smart Investing & Trading Score: 13 | |
| Day Percent Change: -9.73% Day Change: -0.08 | |
| Week Change: -11.16% Year-to-date Change: -21.7% | |
| BNR Links: Profile News Message Board | |
| Charts:- Daily , Weekly | |
| Add BNR to Watchlist: View: Get Complete BNR Trend Analysis ➞ | |
 | CNF CNFinance Holdings Limited |
| Sector: Financials | |
| SubSector: Credit Services | |
| MarketCap: 277.408 Millions | |
| Recent Price: 1.85 Smart Investing & Trading Score: 10 | |
| Day Percent Change: 1.09% Day Change: 0.02 | |
| Week Change: -1.07% Year-to-date Change: -16.7% | |
| CNF Links: Profile News Message Board | |
| Charts:- Daily , Weekly | |
| Add CNF to Watchlist: View: Get Complete CNF Trend Analysis ➞ | |
 | QSG QuantaSing Group Limited |
| Sector: Consumer Staples | |
| SubSector: Education & Training Services | |
| MarketCap: 433 Millions | |
| Recent Price: 3.01 Smart Investing & Trading Score: 10 | |
| Day Percent Change: -11.21% Day Change: -0.38 | |
| Week Change: -12.24% Year-to-date Change: 85.8% | |
| QSG Links: Profile News Message Board | |
| Charts:- Daily , Weekly | |
| Add QSG to Watchlist: View: Get Complete QSG Trend Analysis ➞ | |
 | AGMH AGM Group Holdings Inc. |
| Sector: Technology | |
| SubSector: Application Software | |
| MarketCap: 320.362 Millions | |
| Recent Price: 1.04 Smart Investing & Trading Score: 10 | |
| Day Percent Change: -0.95% Day Change: -0.01 | |
| Week Change: -1.89% Year-to-date Change: -42.5% | |
| AGMH Links: Profile News Message Board | |
| Charts:- Daily , Weekly | |
| Add AGMH to Watchlist: View: Get Complete AGMH Trend Analysis ➞ | |
 | IH iHuman Inc. |
| Sector: Consumer Staples | |
| SubSector: Education & Training Services | |
| MarketCap: 12247 Millions | |
| Recent Price: 1.73 Smart Investing & Trading Score: 10 | |
| Day Percent Change: -0.29% Day Change: 0.00 | |
| Week Change: -0.86% Year-to-date Change: -43.4% | |
| IH Links: Profile News Message Board | |
| Charts:- Daily , Weekly | |
| Add IH to Watchlist: View: Get Complete IH Trend Analysis ➞ | |
| For tabular summary view of above stock list: Summary View ➞ 0 - 25 , 25 - 50 , 50 - 75 , 75 - 100 , 100 - 125 , 125 - 150 | ||
| Click To Change The Sort Order: By Market Cap or Company Size Performance: Year-to-date, Week and Day | |
| Select Chart Type: | ||
|
Best Stocks Today 12Stocks.com |
© 2024 12Stocks.com Terms & Conditions Privacy Contact Us
All Information Provided Only For Education And Not To Be Used For Investing or Trading. See Terms & Conditions


One More Thing ... Get Best Stocks Delivered Daily!
Never Ever Miss A Move With Our Top Ten Stocks Lists
Find Best Stocks In Any Market - Bull or Bear Market
Take A Peek At Our Top Ten Stocks Lists: Daily, Weekly, Year-to-Date & Top Trends
Find Best Stocks In Any Market - Bull or Bear Market
Take A Peek At Our Top Ten Stocks Lists: Daily, Weekly, Year-to-Date & Top Trends
China Stocks With Best Up Trends [0-bearish to 100-bullish]: Smart Share[100], ATRenew [100], GDS [100], MOGU [93], Niu [93], BeiGene [93], Kanzhun [90], Autohome [88], Sohu.com [88], KE [88], Weibo [88]
Best China Stocks Year-to-Date:
U Power[2891.07%], DouYu [803.16%], MicroCloud Hologram[628.06%], China Liberal[504.03%], Yatsen Holding[497.32%], Zhongchao [338.78%], Uxin [163.91%], QuantaSing [85.8%], GigaCloud [73.62%], Cheetah Mobile[71.49%], Yiren Digital[61.54%] Best China Stocks This Week:
Golden Heaven[22.28%], Lixiang Education[20.85%], Viomi [16.39%], Smart Share[14.54%], Lanvin [13.92%], uCloudlink [9.49%], MOGU [9.03%], Dingdong (Cayman)[8.73%], SunCar [8.68%], China Online[7.72%], 21Vianet [6.96%] Best China Stocks Daily:
Golden Heaven[25.92%], Lanvin [19.21%], Regencell Bioscience[13.33%], Smart Share[11.15%], MOGU [10.22%], Skillful Craftsman[7.89%], China Online[6.43%], Sunlands [6.39%], Yunji [5.43%], OneConnect Financial[5.18%], Cango [4.90%]