
 Login Sign Up


| |||||
 |  | ||||

| 12Stocks.com Market Intelligence |
Best Canada Stocks
|
|
| Quick Read: Top Canada Stocks By Performances & Trends: Daily, Weekly, Year-to-Date, Market Cap (Size) & Technical Trends | |||
| Best Canada Views: Quick Browse View, Summary & Slide Show | |||
| 12Stocks.com Canada Stocks Performances & Trends Daily | |||||||||
|
|  The overall market intelligence score is 78 (0-bearish to 100-bullish) which puts Canada index in short term neutral to bullish trend. The market intelligence score from previous trading session is 56 and hence an improvement of trend.
| ||||||||
Here are the market intelligence trend scores of the most requested Canada stocks at 12Stocks.com (click stock name for detailed review):
| |||||||||||||||||
| Scroll down this page for most comprehensive review of Canada stocks by performance, trends, technical analysis, charts, fund plays & more | |||||||||||||||||


| 12Stocks.com: Top Performing Canada Index Stocks | ||||||||||||||||||||||||||||||||||||||||||||||||
 The top performing Canada Index stocks year to date are
Now, more recently, over last week, the top performing Canada Index stocks on the move are


|
||||||||||||||||||||||||||||||||||||||||||||||||
| 12Stocks.com: Investing in Canada Index with Stocks | |
|
The following table helps investors and traders sort through current performance and trends (as measured by market intelligence score) of various
stocks in the Canada Index. Quick View: Move mouse or cursor over stock symbol (ticker) to view short-term technical chart and over stock name to view long term chart. Click on  to add stock symbol to your watchlist and to add stock symbol to your watchlist and  to view watchlist. Click on any ticker or stock name for detailed market intelligence report for that stock. to view watchlist. Click on any ticker or stock name for detailed market intelligence report for that stock. |
12Stocks.com Performance of Stocks in Canada Index
| Ticker | Stock Name | Watchlist | Category | Recent Price | Market Intelligence Score | Change % | YTD Change% |
| VMAR | Vision Marine |   | Services & Goods | 0.61 | 34 | 0.33 | -43.59% |
| MEOH | Methanex | | Materials | 48.23 | 63 | 0.23 | 1.84% |
| CP | Canadian Pacific | | Transports | 79.73 | 32 | 0.21 | 0.85% |
| DSGX | Descartes Systems | | Technology | 95.48 | 95 | 0.19 | 13.59% |
| NVEI | Nuvei | | Technology | 32.35 | 75 | 0.14 | 23.14% |
| NAK | Northern Dynasty | | Materials | 0.30 | 43 | 0.07 | -8.13% |
| STN | Stantec | | Services & Goods | 83.73 | 77 | 0.07 | 4.41% |
| TU | TEL | | Technology | 16.38 | 69 | 0.06 | -7.93% |
| EDSA | Edesa Biotech | | Health Care | 4.55 | 57 | 0.00 | -1.83% |
| ONCY | Oncolytics Biotech | | Health Care | 1.17 | 95 | 0.00 | -13.33% |
| LAC | Lithium Americas | | Materials | 4.49 | 42 | 0.00 | -29.84% |
| SVM | Silvercorp Metals | | Materials | 3.30 | 68 | 0.00 | 25.48% |
| CCJ | Cameco | | Materials | 48.41 | 63 | -0.02 | 12.32% |
| IMO | Imperial Oil | | Energy | 68.05 | 41 | -0.03 | 18.99% |
| AEM | Agnico Eagle | | Materials | 65.04 | 95 | -0.12 | 18.58% |
| PHYS | Sprott Physical | | Financials | 17.80 | 54 | -0.17 | 11.74% |
| BUR | Burcon Nutrascience | | Health Care | 15.84 | 24 | -0.19 | 1.54% |
| FUSN | Fusion | | Health Care | 21.45 | 70 | -0.21 | 123.39% |
| ENB | Enbridge | | Energy | 36.34 | 95 | -0.22 | 0.89% |
| CNQ | Canadian Natural | | Energy | 74.65 | 36 | -0.28 | 13.93% |
| TFPM | Triple Flag | | Materials | 16.28 | 85 | -0.28 | 22.96% |
| AG | Majestic Silver | | Materials | 6.70 | 68 | -0.30 | 8.94% |
| EXK | Endeavour Silver | | Materials | 2.65 | 58 | -0.38 | 34.52% |
| CVE | Cenovus Energy | | Energy | 20.49 | 54 | -0.39 | 23.06% |
| CEF | Sprott Physical | | Financials | 21.19 | 54 | -0.42 | 10.65% |
| To view more stocks, click on Next / Previous arrows or select different range: 0 - 25 , 25 - 50 , 50 - 75 , 75 - 100 , 100 - 125 , 125 - 150 | ||
 | Click To Change The Sort Order: By Market Cap or Company Size Performance: Year-to-date, Week and Day |  |
| Detailed Overview Of Canada Stocks |
| Canada Technical Overview, Leaders & Laggards, Top Canada ETF Funds & Detailed Canada Stocks List, Charts, Trends & More |
| Canada: Technical Analysis, Trends & YTD Performance | |
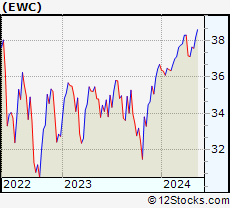
 EWC Weekly Chart |
|
| Long Term Trend: Very Good | |
| Medium Term Trend: Good | |
 EWC Daily Chart |
|
| Short Term Trend: Very Good | |
| Overall Trend Score: 78 | |
| YTD Performance: 2.43% | |
| **Trend Scores & Views Are Only For Educational Purposes And Not For Investing | |
| 12Stocks.com: Investing in Canada Index using Exchange Traded Funds | |
|
The following table shows list of key exchange traded funds (ETF) that
help investors play Canada stock market. For detailed view, check out our ETF Funds section of our website. Quick View: Move mouse or cursor over ETF symbol (ticker) to view short-term technical chart and over ETF name to view long term chart. Click on ticker or stock name for detailed view. Click on to add stock symbol to your watchlist and to view watchlist. |
12Stocks.com List of ETFs that track Canada Index
| Ticker | ETF Name | Watchlist | Recent Price | Market Intelligence Score | Change % | Week % | Year-to-date % |
| EWC | Canada | | 37.57 | 78 | 0.62 | -0.16 | 2.43% |
| 12Stocks.com: Charts, Trends, Fundamental Data and Performances of Canada Stocks | |
|
We now take in-depth look at all Canada stocks including charts, multi-period performances and overall trends (as measured by market intelligence score). One can sort Canada stocks (click link to choose) by Daily, Weekly and by Year-to-Date performances. Also, one can sort by size of the company or by market capitalization. |
| Select Your Default Chart Type: | |||||
| |||||
| Click on stock symbol or name for detailed view. Click on to add stock symbol to your watchlist and to view watchlist. Quick View: Move mouse or cursor over "Daily" to quickly view daily technical stock chart and over "Weekly" to view weekly technical stock chart. | |||||

 | VMAR Vision Marine Technologies Inc. |
| Sector: Services & Goods | |
| SubSector: Leisure | |
| MarketCap: 99027 Millions | |
| Recent Price: 0.61 Market Intelligence Score: 34 | |
| Day Percent Change: 0.33% Day Change: 0.00 | |
| Week Change: 2.32% Year-to-date Change: -43.6% | |
| VMAR Links: Profile News Message Board | |
| Charts:- Daily , Weekly | |
| Add VMAR to Watchlist: View: Get Complete VMAR Trend Analysis ➞ | |
 | MEOH Methanex Corporation |
| Sector: Materials | |
| SubSector: Specialty Chemicals | |
| MarketCap: 894.357 Millions | |
| Recent Price: 48.23 Market Intelligence Score: 63 | |
| Day Percent Change: 0.23% Day Change: 0.11 | |
| Week Change: -0.08% Year-to-date Change: 1.8% | |
| MEOH Links: Profile News Message Board | |
| Charts:- Daily , Weekly | |
| Add MEOH to Watchlist: View: Get Complete MEOH Trend Analysis ➞ | |
 | CP Canadian Pacific Railway Limited |
| Sector: Transports | |
| SubSector: Railroads | |
| MarketCap: 25428.5 Millions | |
| Recent Price: 79.73 Market Intelligence Score: 32 | |
| Day Percent Change: 0.21% Day Change: 0.17 | |
| Week Change: -2.39% Year-to-date Change: 0.9% | |
| CP Links: Profile News Message Board | |
| Charts:- Daily , Weekly | |
| Add CP to Watchlist: View: Get Complete CP Trend Analysis ➞ | |
 | DSGX The Descartes Systems Group Inc |
| Sector: Technology | |
| SubSector: Business Software & Services | |
| MarketCap: 2830.58 Millions | |
| Recent Price: 95.48 Market Intelligence Score: 95 | |
| Day Percent Change: 0.19% Day Change: 0.18 | |
| Week Change: 1.32% Year-to-date Change: 13.6% | |
| DSGX Links: Profile News Message Board | |
| Charts:- Daily , Weekly | |
| Add DSGX to Watchlist: View: Get Complete DSGX Trend Analysis ➞ | |
 | NVEI Nuvei Corporation |
| Sector: Technology | |
| SubSector: Software - Infrastructure | |
| MarketCap: 5490 Millions | |
| Recent Price: 32.35 Market Intelligence Score: 75 | |
| Day Percent Change: 0.14% Day Change: 0.05 | |
| Week Change: 0.17% Year-to-date Change: 23.1% | |
| NVEI Links: Profile News Message Board | |
| Charts:- Daily , Weekly | |
| Add NVEI to Watchlist: View: Get Complete NVEI Trend Analysis ➞ | |
 | NAK Northern Dynasty Minerals Ltd. |
| Sector: Materials | |
| SubSector: Industrial Metals & Minerals | |
| MarketCap: 167.01 Millions | |
| Recent Price: 0.30 Market Intelligence Score: 43 | |
| Day Percent Change: 0.07% Day Change: 0.00 | |
| Week Change: 0.68% Year-to-date Change: -8.1% | |
| NAK Links: Profile News Message Board | |
| Charts:- Daily , Weekly | |
| Add NAK to Watchlist: View: Get Complete NAK Trend Analysis ➞ | |
 | STN Stantec Inc. |
| Sector: Services & Goods | |
| SubSector: Business Services | |
| MarketCap: 2855.92 Millions | |
| Recent Price: 83.73 Market Intelligence Score: 77 | |
| Day Percent Change: 0.07% Day Change: 0.06 | |
| Week Change: 2.31% Year-to-date Change: 4.4% | |
| STN Links: Profile News Message Board | |
| Charts:- Daily , Weekly | |
| Add STN to Watchlist: View: Get Complete STN Trend Analysis ➞ | |
 | TU TELUS Corporation |
| Sector: Technology | |
| SubSector: Wireless Communications | |
| MarketCap: 10864.7 Millions | |
| Recent Price: 16.38 Market Intelligence Score: 69 | |
| Day Percent Change: 0.06% Day Change: 0.01 | |
| Week Change: 1.93% Year-to-date Change: -7.9% | |
| TU Links: Profile News Message Board | |
| Charts:- Daily , Weekly | |
| Add TU to Watchlist: View: Get Complete TU Trend Analysis ➞ | |
 | EDSA Edesa Biotech, Inc. |
| Sector: Health Care | |
| SubSector: Biotechnology | |
| MarketCap: 19.6785 Millions | |
| Recent Price: 4.55 Market Intelligence Score: 57 | |
| Day Percent Change: 0.00% Day Change: 0.00 | |
| Week Change: 3.05% Year-to-date Change: -1.8% | |
| EDSA Links: Profile News Message Board | |
| Charts:- Daily , Weekly | |
| Add EDSA to Watchlist: View: Get Complete EDSA Trend Analysis ➞ | |
 | ONCY Oncolytics Biotech Inc. |
| Sector: Health Care | |
| SubSector: Biotechnology | |
| MarketCap: 57.3785 Millions | |
| Recent Price: 1.17 Market Intelligence Score: 95 | |
| Day Percent Change: 0.00% Day Change: 0.00 | |
| Week Change: 7.34% Year-to-date Change: -13.3% | |
| ONCY Links: Profile News Message Board | |
| Charts:- Daily , Weekly | |
| Add ONCY to Watchlist: View: Get Complete ONCY Trend Analysis ➞ | |
 | LAC Lithium Americas Corp. |
| Sector: Materials | |
| SubSector: Industrial Metals & Minerals | |
| MarketCap: 192.01 Millions | |
| Recent Price: 4.49 Market Intelligence Score: 42 | |
| Day Percent Change: 0.00% Day Change: 0.00 | |
| Week Change: -2.81% Year-to-date Change: -29.8% | |
| LAC Links: Profile News Message Board | |
| Charts:- Daily , Weekly | |
| Add LAC to Watchlist: View: Get Complete LAC Trend Analysis ➞ | |
 | SVM Silvercorp Metals Inc. |
| Sector: Materials | |
| SubSector: Silver | |
| MarketCap: 504.056 Millions | |
| Recent Price: 3.30 Market Intelligence Score: 68 | |
| Day Percent Change: 0.00% Day Change: 0.00 | |
| Week Change: -0.3% Year-to-date Change: 25.5% | |
| SVM Links: Profile News Message Board | |
| Charts:- Daily , Weekly | |
| Add SVM to Watchlist: View: Get Complete SVM Trend Analysis ➞ | |
 | CCJ Cameco Corporation |
| Sector: Materials | |
| SubSector: Industrial Metals & Minerals | |
| MarketCap: 2722.9 Millions | |
| Recent Price: 48.41 Market Intelligence Score: 63 | |
| Day Percent Change: -0.02% Day Change: -0.01 | |
| Week Change: -1.9% Year-to-date Change: 12.3% | |
| CCJ Links: Profile News Message Board | |
| Charts:- Daily , Weekly | |
| Add CCJ to Watchlist: View: Get Complete CCJ Trend Analysis ➞ | |
 | IMO Imperial Oil Limited |
| Sector: Energy | |
| SubSector: Major Integrated Oil & Gas | |
| MarketCap: 8171.25 Millions | |
| Recent Price: 68.05 Market Intelligence Score: 41 | |
| Day Percent Change: -0.03% Day Change: -0.02 | |
| Week Change: -3.75% Year-to-date Change: 19.0% | |
| IMO Links: Profile News Message Board | |
| Charts:- Daily , Weekly | |
| Add IMO to Watchlist: View: Get Complete IMO Trend Analysis ➞ | |
 | AEM Agnico Eagle Mines Limited |
| Sector: Materials | |
| SubSector: Gold | |
| MarketCap: 9491.49 Millions | |
| Recent Price: 65.04 Market Intelligence Score: 95 | |
| Day Percent Change: -0.12% Day Change: -0.08 | |
| Week Change: -0.73% Year-to-date Change: 18.6% | |
| AEM Links: Profile News Message Board | |
| Charts:- Daily , Weekly | |
| Add AEM to Watchlist: View: Get Complete AEM Trend Analysis ➞ | |
 | PHYS Sprott Physical Gold Trust |
| Sector: Financials | |
| SubSector: Exchange Traded Fund | |
| MarketCap: 2365.21 Millions | |
| Recent Price: 17.80 Market Intelligence Score: 54 | |
| Day Percent Change: -0.17% Day Change: -0.03 | |
| Week Change: -1.87% Year-to-date Change: 11.7% | |
| PHYS Links: Profile News Message Board | |
| Charts:- Daily , Weekly | |
| Add PHYS to Watchlist: View: Get Complete PHYS Trend Analysis ➞ | |
 | BUR Burcon Nutrascience Corporation |
| Sector: Health Care | |
| SubSector: Biotechnology | |
| MarketCap: 0 Millions | |
| Recent Price: 15.84 Market Intelligence Score: 24 | |
| Day Percent Change: -0.19% Day Change: -0.03 | |
| Week Change: 2.92% Year-to-date Change: 1.5% | |
| BUR Links: Profile News Message Board | |
| Charts:- Daily , Weekly | |
| Add BUR to Watchlist: View: Get Complete BUR Trend Analysis ➞ | |
 | FUSN Fusion Pharmaceuticals Inc. |
| Sector: Health Care | |
| SubSector: Biotechnology | |
| MarketCap: 52487 Millions | |
| Recent Price: 21.45 Market Intelligence Score: 70 | |
| Day Percent Change: -0.21% Day Change: -0.04 | |
| Week Change: 0.12% Year-to-date Change: 123.4% | |
| FUSN Links: Profile News Message Board | |
| Charts:- Daily , Weekly | |
| Add FUSN to Watchlist: View: Get Complete FUSN Trend Analysis ➞ | |
 | ENB Enbridge Inc. |
| Sector: Energy | |
| SubSector: Oil & Gas Pipelines | |
| MarketCap: 62578.4 Millions | |
| Recent Price: 36.34 Market Intelligence Score: 95 | |
| Day Percent Change: -0.22% Day Change: -0.08 | |
| Week Change: 1.45% Year-to-date Change: 0.9% | |
| ENB Links: Profile News Message Board | |
| Charts:- Daily , Weekly | |
| Add ENB to Watchlist: View: Get Complete ENB Trend Analysis ➞ | |
 | CNQ Canadian Natural Resources Limited |
| Sector: Energy | |
| SubSector: Independent Oil & Gas | |
| MarketCap: 11925.2 Millions | |
| Recent Price: 74.65 Market Intelligence Score: 36 | |
| Day Percent Change: -0.28% Day Change: -0.21 | |
| Week Change: -4.26% Year-to-date Change: 13.9% | |
| CNQ Links: Profile News Message Board | |
| Charts:- Daily , Weekly | |
| Add CNQ to Watchlist: View: Get Complete CNQ Trend Analysis ➞ | |
 | TFPM Triple Flag Precious Metals Corp. |
| Sector: Materials | |
| SubSector: Other Precious Metals & Mining | |
| MarketCap: 3640 Millions | |
| Recent Price: 16.28 Market Intelligence Score: 85 | |
| Day Percent Change: -0.28% Day Change: -0.04 | |
| Week Change: -0.49% Year-to-date Change: 23.0% | |
| TFPM Links: Profile News Message Board | |
| Charts:- Daily , Weekly | |
| Add TFPM to Watchlist: View: Get Complete TFPM Trend Analysis ➞ | |
 | AG First Majestic Silver Corp. |
| Sector: Materials | |
| SubSector: Silver | |
| MarketCap: 1128.56 Millions | |
| Recent Price: 6.70 Market Intelligence Score: 68 | |
| Day Percent Change: -0.30% Day Change: -0.02 | |
| Week Change: -4.83% Year-to-date Change: 8.9% | |
| AG Links: Profile News Message Board | |
| Charts:- Daily , Weekly | |
| Add AG to Watchlist: View: Get Complete AG Trend Analysis ➞ | |
 | EXK Endeavour Silver Corp. |
| Sector: Materials | |
| SubSector: Silver | |
| MarketCap: 204.456 Millions | |
| Recent Price: 2.65 Market Intelligence Score: 58 | |
| Day Percent Change: -0.38% Day Change: -0.01 | |
| Week Change: -4.68% Year-to-date Change: 34.5% | |
| EXK Links: Profile News Message Board | |
| Charts:- Daily , Weekly | |
| Add EXK to Watchlist: View: Get Complete EXK Trend Analysis ➞ | |
 | CVE Cenovus Energy Inc. |
| Sector: Energy | |
| SubSector: Oil & Gas Drilling & Exploration | |
| MarketCap: 2369.29 Millions | |
| Recent Price: 20.49 Market Intelligence Score: 54 | |
| Day Percent Change: -0.39% Day Change: -0.08 | |
| Week Change: -4.52% Year-to-date Change: 23.1% | |
| CVE Links: Profile News Message Board | |
| Charts:- Daily , Weekly | |
| Add CVE to Watchlist: View: Get Complete CVE Trend Analysis ➞ | |
 | CEF Sprott Physical Gold and Silver Trust |
| Sector: Financials | |
| SubSector: Asset Management | |
| MarketCap: 2485.33 Millions | |
| Recent Price: 21.19 Market Intelligence Score: 54 | |
| Day Percent Change: -0.42% Day Change: -0.09 | |
| Week Change: -2.08% Year-to-date Change: 10.7% | |
| CEF Links: Profile News Message Board | |
| Charts:- Daily , Weekly | |
| Add CEF to Watchlist: View: Get Complete CEF Trend Analysis ➞ | |
| To view more stocks, click on Next / Previous arrows or select different range: 0 - 25 , 25 - 50 , 50 - 75 , 75 - 100 , 100 - 125 , 125 - 150 | ||
| Click To Change The Sort Order: By Market Cap or Company Size Performance: Year-to-date, Week and Day | |
| Select Chart Type: | ||
 Best Stocks Today 12Stocks.com |
© 2024 12Stocks.com Terms & Conditions Privacy Contact Us
All Information Provided Only For Education And Not To Be Used For Investing or Trading. See Terms & Conditions


One More Thing ... Get Best Stocks Delivered Daily!
Never Ever Miss A Move With Our Top Ten Stocks Lists
Find Best Stocks In Any Market - Bull or Bear Market
Take A Peek At Our Top Ten Stocks Lists: Daily, Weekly, Year-to-Date & Top Trends
Find Best Stocks In Any Market - Bull or Bear Market
Take A Peek At Our Top Ten Stocks Lists: Daily, Weekly, Year-to-Date & Top Trends
Canada Stocks With Best Up Trends [0-bearish to 100-bullish]: TransAlta [100], Brookfield Renewable[100], Algonquin Power[100], Royal Bank[100], City Office[100], CAE [100], Denison Mines[100], Mercer [100], Algonquin Power[100], Franco-Nevada [95], Manulife Financial[95]
Best Canada Stocks Year-to-Date:
Aurora Cannabis[1315.37%], Fusion [123.39%], Canopy Growth[100.39%], McEwen Mining[63.11%], D-Wave Quantum[60.13%], Hudbay Minerals[51.63%], IAMGOLD [41.9%], OrganiGram [41.6%], Endeavour Silver[34.52%], Gold Royalty[34.26%], Cronos [28.23%] Best Canada Stocks This Week:
Brookfield Renewable[20.81%], Tilray [17.98%], Canopy Growth[14.93%], Zymeworks [11.38%], Canadian Solar[10.83%], Milestone [9.74%], AbCellera Biologics[9.71%], Repare [8.13%], Ballard Power[8.08%], Xenon [8.02%], Algonquin Power[7.79%] Best Canada Stocks Daily:
AbCellera Biologics[11.49%], Lion Electric[8.71%], TransAlta [4.74%], Brookfield Renewable[4.54%], Algonquin Power[4.39%], Tilray [3.96%], Shopify [3.42%], TC Energy[3.32%], Repare [3.28%], Colliers [3.22%], Milestone [3.05%]