
 Login Sign Up


| |||||
 |  | ||||

| 12Stocks.com Market Intelligence |
Best Canada Stocks
|
|
| Quick Read: Top Canada Stocks By Performances & Trends: Daily, Weekly, Year-to-Date, Market Cap (Size) & Technical Trends | |||
| Best Canada Views: Quick Browse View, Summary & Slide Show | |||
| 12Stocks.com Canada Stocks Performances & Trends Daily | |||||||||
|
|  The overall market intelligence score is 68 (0-bearish to 100-bullish) which puts Canada index in short term neutral to bullish trend. The market intelligence score from previous trading session is 56 and hence an improvement of trend.
| ||||||||
Here are the market intelligence trend scores of the most requested Canada stocks at 12Stocks.com (click stock name for detailed review):
| ||||||||||||||||||
| Scroll down this page for most comprehensive review of Canada stocks by performance, trends, technical analysis, charts, fund plays & more | ||||||||||||||||||


| 12Stocks.com: Top Performing Canada Index Stocks | ||||||||||||||||||||||||||||||||||||||||||||||||
 The top performing Canada Index stocks year to date are
Now, more recently, over last week, the top performing Canada Index stocks on the move are


|
||||||||||||||||||||||||||||||||||||||||||||||||
| 12Stocks.com: Investing in Canada Index with Stocks | |
|
The following table helps investors and traders sort through current performance and trends (as measured by market intelligence score) of various
stocks in the Canada Index. Quick View: Move mouse or cursor over stock symbol (ticker) to view short-term technical chart and over stock name to view long term chart. Click on  to add stock symbol to your watchlist and to add stock symbol to your watchlist and  to view watchlist. Click on any ticker or stock name for detailed market intelligence report for that stock. to view watchlist. Click on any ticker or stock name for detailed market intelligence report for that stock. |
12Stocks.com Performance of Stocks in Canada Index
| Ticker | Stock Name | Watchlist | Category | Recent Price | Market Intelligence Score | Change % | Weekly Change% |
| VERO | Venus Concept |   | Health Care | 0.85 | 57 | 8.75% | 25.44% |
| TRX | Tanzanian Gold | | Materials | 0.47 | 86 | 2.39% | 13.25% |
| SILV | SilverCrest Metals | | Materials | 7.90 | 100 | 4.36% | 9.57% |
| TAC | TransAlta | | Utilities | 6.45 | 59 | 0.31% | 6.44% |
| GOOS | Canada Goose | | Consumer Staples | 11.42 | 49 | 1.60% | 5.84% |
| VFF | Village Farms | | Consumer Staples | 1.34 | 93 | 8.94% | 5.51% |
| LULU | Lululemon Athletica | | Consumer Staples | 352.47 | 42 | 1.43% | 4.86% |
| KFS | Kingsway Financial | | Financials | 8.63 | 67 | 2.37% | 4.73% |
| ACHV | Achieve Life | | Health Care | 4.55 | 42 | -0.33% | 4.72% |
| PLG | Platinum | | Materials | 1.34 | 81 | -3.60% | 4.69% |
| KGC | Kinross Gold | | Materials | 6.77 | 93 | 3.99% | 4.48% |
| IMAX | IMAX | | Services & Goods | 17.13 | 88 | 0.12% | 4.26% |
| AEM | Agnico Eagle | | Materials | 63.84 | 93 | 0.58% | 3.89% |
| APT | Alpha Tech | | Industrials | 6.16 | 41 | 2.67% | 3.36% |
| PSLV | Sprott Physical | | Financials | 9.70 | 83 | 1.68% | 3.08% |
| SSRM | SSR Mining | | Materials | 5.34 | 62 | 3.99% | 2.99% |
| FNV | Franco-Nevada | | Materials | 121.47 | 88 | -0.16% | 2.90% |
| BLCO | Bausch + | | Health Care | 14.64 | 58 | 0.27% | 2.81% |
| PHYS | Sprott Physical | | Financials | 18.50 | 76 | 0.33% | 2.32% |
| FTS | Fortis | | Utilities | 38.47 | 52 | 1.10% | 2.26% |
| SU | Suncor Energy | | Energy | 38.54 | 88 | 1.29% | 2.26% |
| HBM | Hudbay Minerals | | Materials | 7.79 | 78 | -1.14% | 2.23% |
| TD | Toronto-Dominion Bank | | Financials | 58.09 | 42 | 1.47% | 2.22% |
| ENB | Enbridge | | Energy | 34.86 | 42 | 2.83% | 1.99% |
| CGC | Canopy Growth | | Health Care | 7.94 | 68 | 1.40% | 1.79% |
| To view more stocks, click on Next / Previous arrows or select different range: 0 - 25 , 25 - 50 , 50 - 75 , 75 - 100 , 100 - 125 , 125 - 150 | ||
 | Click To Change The Sort Order: By Market Cap or Company Size Performance: Year-to-date, Week and Day |  |
| Detailed Overview Of Canada Stocks |
| Canada Technical Overview, Leaders & Laggards, Top Canada ETF Funds & Detailed Canada Stocks List, Charts, Trends & More |
| Canada: Technical Analysis, Trends & YTD Performance | |
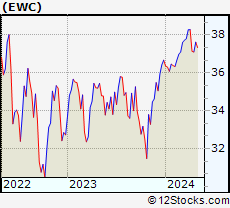
 EWC Weekly Chart |
|
| Long Term Trend: Very Good | |
| Medium Term Trend: Not Good | |
 EWC Daily Chart |
|
| Short Term Trend: Very Good | |
| Overall Trend Score: 68 | |
| YTD Performance: 1.17% | |
| **Trend Scores & Views Are Only For Educational Purposes And Not For Investing | |
| 12Stocks.com: Investing in Canada Index using Exchange Traded Funds | |
|
The following table shows list of key exchange traded funds (ETF) that
help investors play Canada stock market. For detailed view, check out our ETF Funds section of our website. Quick View: Move mouse or cursor over ETF symbol (ticker) to view short-term technical chart and over ETF name to view long term chart. Click on ticker or stock name for detailed view. Click on to add stock symbol to your watchlist and to view watchlist. |
12Stocks.com List of ETFs that track Canada Index
| Ticker | ETF Name | Watchlist | Recent Price | Market Intelligence Score | Change % | Week % | Year-to-date % |
| EWC | Canada | | 37.11 | 68 | 0.71 | -0.11 | 1.17% |
| 12Stocks.com: Charts, Trends, Fundamental Data and Performances of Canada Stocks | |
|
We now take in-depth look at all Canada stocks including charts, multi-period performances and overall trends (as measured by market intelligence score). One can sort Canada stocks (click link to choose) by Daily, Weekly and by Year-to-Date performances. Also, one can sort by size of the company or by market capitalization. |
| Select Your Default Chart Type: | |||||
| |||||
| Click on stock symbol or name for detailed view. Click on to add stock symbol to your watchlist and to view watchlist. Quick View: Move mouse or cursor over "Daily" to quickly view daily technical stock chart and over "Weekly" to view weekly technical stock chart. | |||||

 | VERO Venus Concept Inc. |
| Sector: Health Care | |
| SubSector: Medical Appliances & Equipment | |
| MarketCap: 101.08 Millions | |
| Recent Price: 0.85 Market Intelligence Score: 57 | |
| Day Percent Change: 8.75% Day Change: 0.07 | |
| Week Change: 25.44% Year-to-date Change: -28.0% | |
| VERO Links: Profile News Message Board | |
| Charts:- Daily , Weekly | |
| Add VERO to Watchlist: View: Get Complete VERO Trend Analysis ➞ | |
 | TRX Tanzanian Gold Corporation |
| Sector: Materials | |
| SubSector: Gold | |
| MarketCap: 95.9619 Millions | |
| Recent Price: 0.47 Market Intelligence Score: 86 | |
| Day Percent Change: 2.39% Day Change: 0.01 | |
| Week Change: 13.25% Year-to-date Change: 23.9% | |
| TRX Links: Profile News Message Board | |
| Charts:- Daily , Weekly | |
| Add TRX to Watchlist: View: Get Complete TRX Trend Analysis ➞ | |
 | SILV SilverCrest Metals Inc. |
| Sector: Materials | |
| SubSector: Silver | |
| MarketCap: 555.356 Millions | |
| Recent Price: 7.90 Market Intelligence Score: 100 | |
| Day Percent Change: 4.36% Day Change: 0.33 | |
| Week Change: 9.57% Year-to-date Change: 20.6% | |
| SILV Links: Profile News Message Board | |
| Charts:- Daily , Weekly | |
| Add SILV to Watchlist: View: Get Complete SILV Trend Analysis ➞ | |
 | TAC TransAlta Corporation |
| Sector: Utilities | |
| SubSector: Diversified Utilities | |
| MarketCap: 1487.8 Millions | |
| Recent Price: 6.45 Market Intelligence Score: 59 | |
| Day Percent Change: 0.31% Day Change: 0.02 | |
| Week Change: 6.44% Year-to-date Change: -22.4% | |
| TAC Links: Profile News Message Board | |
| Charts:- Daily , Weekly | |
| Add TAC to Watchlist: View: Get Complete TAC Trend Analysis ➞ | |
 | GOOS Canada Goose Holdings Inc. |
| Sector: Consumer Staples | |
| SubSector: Textile - Apparel Clothing | |
| MarketCap: 881.465 Millions | |
| Recent Price: 11.42 Market Intelligence Score: 49 | |
| Day Percent Change: 1.60% Day Change: 0.18 | |
| Week Change: 5.84% Year-to-date Change: -3.6% | |
| GOOS Links: Profile News Message Board | |
| Charts:- Daily , Weekly | |
| Add GOOS to Watchlist: View: Get Complete GOOS Trend Analysis ➞ | |
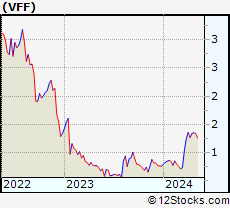 | VFF Village Farms International, Inc. |
| Sector: Consumer Staples | |
| SubSector: Farm Products | |
| MarketCap: 125.287 Millions | |
| Recent Price: 1.34 Market Intelligence Score: 93 | |
| Day Percent Change: 8.94% Day Change: 0.11 | |
| Week Change: 5.51% Year-to-date Change: 76.1% | |
| VFF Links: Profile News Message Board | |
| Charts:- Daily , Weekly | |
| Add VFF to Watchlist: View: Get Complete VFF Trend Analysis ➞ | |
 | LULU Lululemon Athletica Inc. |
| Sector: Consumer Staples | |
| SubSector: Textile - Apparel Clothing | |
| MarketCap: 24627.8 Millions | |
| Recent Price: 352.47 Market Intelligence Score: 42 | |
| Day Percent Change: 1.43% Day Change: 4.96 | |
| Week Change: 4.86% Year-to-date Change: -31.1% | |
| LULU Links: Profile News Message Board | |
| Charts:- Daily , Weekly | |
| Add LULU to Watchlist: View: Get Complete LULU Trend Analysis ➞ | |
 | KFS Kingsway Financial Services Inc. |
| Sector: Financials | |
| SubSector: Property & Casualty Insurance | |
| MarketCap: 47.5812 Millions | |
| Recent Price: 8.63 Market Intelligence Score: 67 | |
| Day Percent Change: 2.37% Day Change: 0.20 | |
| Week Change: 4.73% Year-to-date Change: 2.7% | |
| KFS Links: Profile News Message Board | |
| Charts:- Daily , Weekly | |
| Add KFS to Watchlist: View: Get Complete KFS Trend Analysis ➞ | |
 | ACHV Achieve Life Sciences, Inc. |
| Sector: Health Care | |
| SubSector: Biotechnology | |
| MarketCap: 7.32785 Millions | |
| Recent Price: 4.55 Market Intelligence Score: 42 | |
| Day Percent Change: -0.33% Day Change: -0.02 | |
| Week Change: 4.72% Year-to-date Change: 8.1% | |
| ACHV Links: Profile News Message Board | |
| Charts:- Daily , Weekly | |
| Add ACHV to Watchlist: View: Get Complete ACHV Trend Analysis ➞ | |
 | PLG Platinum Group Metals Ltd. |
| Sector: Materials | |
| SubSector: Industrial Metals & Minerals | |
| MarketCap: 77.591 Millions | |
| Recent Price: 1.34 Market Intelligence Score: 81 | |
| Day Percent Change: -3.60% Day Change: -0.05 | |
| Week Change: 4.69% Year-to-date Change: 17.5% | |
| PLG Links: Profile News Message Board | |
| Charts:- Daily , Weekly | |
| Add PLG to Watchlist: View: Get Complete PLG Trend Analysis ➞ | |
 | KGC Kinross Gold Corporation |
| Sector: Materials | |
| SubSector: Gold | |
| MarketCap: 5389.29 Millions | |
| Recent Price: 6.77 Market Intelligence Score: 93 | |
| Day Percent Change: 3.99% Day Change: 0.26 | |
| Week Change: 4.48% Year-to-date Change: 11.9% | |
| KGC Links: Profile News Message Board | |
| Charts:- Daily , Weekly | |
| Add KGC to Watchlist: View: Get Complete KGC Trend Analysis ➞ | |
 | IMAX IMAX Corporation |
| Sector: Services & Goods | |
| SubSector: Entertainment - Diversified | |
| MarketCap: 874.237 Millions | |
| Recent Price: 17.13 Market Intelligence Score: 88 | |
| Day Percent Change: 0.12% Day Change: 0.02 | |
| Week Change: 4.26% Year-to-date Change: 14.1% | |
| IMAX Links: Profile News Message Board | |
| Charts:- Daily , Weekly | |
| Add IMAX to Watchlist: View: Get Complete IMAX Trend Analysis ➞ | |
 | AEM Agnico Eagle Mines Limited |
| Sector: Materials | |
| SubSector: Gold | |
| MarketCap: 9491.49 Millions | |
| Recent Price: 63.84 Market Intelligence Score: 93 | |
| Day Percent Change: 0.58% Day Change: 0.37 | |
| Week Change: 3.89% Year-to-date Change: 16.4% | |
| AEM Links: Profile News Message Board | |
| Charts:- Daily , Weekly | |
| Add AEM to Watchlist: View: Get Complete AEM Trend Analysis ➞ | |
 | APT Alpha Pro Tech, Ltd. |
| Sector: Industrials | |
| SubSector: General Building Materials | |
| MarketCap: 125.953 Millions | |
| Recent Price: 6.16 Market Intelligence Score: 41 | |
| Day Percent Change: 2.67% Day Change: 0.16 | |
| Week Change: 3.36% Year-to-date Change: 16.5% | |
| APT Links: Profile News Message Board | |
| Charts:- Daily , Weekly | |
| Add APT to Watchlist: View: Get Complete APT Trend Analysis ➞ | |
 | PSLV Sprott Physical Silver Trust |
| Sector: Financials | |
| SubSector: Exchange Traded Fund | |
| MarketCap: 765.851 Millions | |
| Recent Price: 9.70 Market Intelligence Score: 83 | |
| Day Percent Change: 1.68% Day Change: 0.16 | |
| Week Change: 3.08% Year-to-date Change: 20.1% | |
| PSLV Links: Profile News Message Board | |
| Charts:- Daily , Weekly | |
| Add PSLV to Watchlist: View: Get Complete PSLV Trend Analysis ➞ | |
 | SSRM SSR Mining Inc. |
| Sector: Materials | |
| SubSector: Gold | |
| MarketCap: 1546.09 Millions | |
| Recent Price: 5.34 Market Intelligence Score: 62 | |
| Day Percent Change: 3.99% Day Change: 0.21 | |
| Week Change: 2.99% Year-to-date Change: -50.3% | |
| SSRM Links: Profile News Message Board | |
| Charts:- Daily , Weekly | |
| Add SSRM to Watchlist: View: Get Complete SSRM Trend Analysis ➞ | |
 | FNV Franco-Nevada Corporation |
| Sector: Materials | |
| SubSector: Gold | |
| MarketCap: 17703.9 Millions | |
| Recent Price: 121.47 Market Intelligence Score: 88 | |
| Day Percent Change: -0.16% Day Change: -0.20 | |
| Week Change: 2.9% Year-to-date Change: 9.6% | |
| FNV Links: Profile News Message Board | |
| Charts:- Daily , Weekly | |
| Add FNV to Watchlist: View: Get Complete FNV Trend Analysis ➞ | |
 | BLCO Bausch + Lomb Corporation |
| Sector: Health Care | |
| SubSector: Medical Instruments & Supplies | |
| MarketCap: 7100 Millions | |
| Recent Price: 14.64 Market Intelligence Score: 58 | |
| Day Percent Change: 0.27% Day Change: 0.04 | |
| Week Change: 2.81% Year-to-date Change: -13.9% | |
| BLCO Links: Profile News Message Board | |
| Charts:- Daily , Weekly | |
| Add BLCO to Watchlist: View: Get Complete BLCO Trend Analysis ➞ | |
 | PHYS Sprott Physical Gold Trust |
| Sector: Financials | |
| SubSector: Exchange Traded Fund | |
| MarketCap: 2365.21 Millions | |
| Recent Price: 18.50 Market Intelligence Score: 76 | |
| Day Percent Change: 0.33% Day Change: 0.06 | |
| Week Change: 2.32% Year-to-date Change: 16.1% | |
| PHYS Links: Profile News Message Board | |
| Charts:- Daily , Weekly | |
| Add PHYS to Watchlist: View: Get Complete PHYS Trend Analysis ➞ | |
 | FTS Fortis Inc. |
| Sector: Utilities | |
| SubSector: Electric Utilities | |
| MarketCap: 14741.8 Millions | |
| Recent Price: 38.47 Market Intelligence Score: 52 | |
| Day Percent Change: 1.10% Day Change: 0.42 | |
| Week Change: 2.26% Year-to-date Change: -6.5% | |
| FTS Links: Profile News Message Board | |
| Charts:- Daily , Weekly | |
| Add FTS to Watchlist: View: Get Complete FTS Trend Analysis ➞ | |
 | SU Suncor Energy Inc. |
| Sector: Energy | |
| SubSector: Independent Oil & Gas | |
| MarketCap: 21550.6 Millions | |
| Recent Price: 38.54 Market Intelligence Score: 88 | |
| Day Percent Change: 1.29% Day Change: 0.49 | |
| Week Change: 2.26% Year-to-date Change: 20.3% | |
| SU Links: Profile News Message Board | |
| Charts:- Daily , Weekly | |
| Add SU to Watchlist: View: Get Complete SU Trend Analysis ➞ | |
 | HBM Hudbay Minerals Inc. |
| Sector: Materials | |
| SubSector: Copper | |
| MarketCap: 363.157 Millions | |
| Recent Price: 7.79 Market Intelligence Score: 78 | |
| Day Percent Change: -1.14% Day Change: -0.09 | |
| Week Change: 2.23% Year-to-date Change: 41.1% | |
| HBM Links: Profile News Message Board | |
| Charts:- Daily , Weekly | |
| Add HBM to Watchlist: View: Get Complete HBM Trend Analysis ➞ | |
 | TD The Toronto-Dominion Bank |
| Sector: Financials | |
| SubSector: Money Center Banks | |
| MarketCap: 75152.4 Millions | |
| Recent Price: 58.09 Market Intelligence Score: 42 | |
| Day Percent Change: 1.47% Day Change: 0.84 | |
| Week Change: 2.22% Year-to-date Change: -10.1% | |
| TD Links: Profile News Message Board | |
| Charts:- Daily , Weekly | |
| Add TD to Watchlist: View: Get Complete TD Trend Analysis ➞ | |
 | ENB Enbridge Inc. |
| Sector: Energy | |
| SubSector: Oil & Gas Pipelines | |
| MarketCap: 62578.4 Millions | |
| Recent Price: 34.86 Market Intelligence Score: 42 | |
| Day Percent Change: 2.83% Day Change: 0.96 | |
| Week Change: 1.99% Year-to-date Change: -3.2% | |
| ENB Links: Profile News Message Board | |
| Charts:- Daily , Weekly | |
| Add ENB to Watchlist: View: Get Complete ENB Trend Analysis ➞ | |
 | CGC Canopy Growth Corporation |
| Sector: Health Care | |
| SubSector: Drug Manufacturers - Other | |
| MarketCap: 4136.33 Millions | |
| Recent Price: 7.94 Market Intelligence Score: 68 | |
| Day Percent Change: 1.40% Day Change: 0.11 | |
| Week Change: 1.79% Year-to-date Change: 55.4% | |
| CGC Links: Profile News Message Board | |
| Charts:- Daily , Weekly | |
| Add CGC to Watchlist: View: Get Complete CGC Trend Analysis ➞ | |
| To view more stocks, click on Next / Previous arrows or select different range: 0 - 25 , 25 - 50 , 50 - 75 , 75 - 100 , 100 - 125 , 125 - 150 | ||
| Click To Change The Sort Order: By Market Cap or Company Size Performance: Year-to-date, Week and Day | |
| Select Chart Type: | ||
 Best Stocks Today 12Stocks.com |
© 2024 12Stocks.com Terms & Conditions Privacy Contact Us
All Information Provided Only For Education And Not To Be Used For Investing or Trading. See Terms & Conditions


One More Thing ... Get Best Stocks Delivered Daily!
Never Ever Miss A Move With Our Top Ten Stocks Lists
Find Best Stocks In Any Market - Bull or Bear Market
Take A Peek At Our Top Ten Stocks Lists: Daily, Weekly, Year-to-Date & Top Trends
Find Best Stocks In Any Market - Bull or Bear Market
Take A Peek At Our Top Ten Stocks Lists: Daily, Weekly, Year-to-Date & Top Trends
Canada Stocks With Best Up Trends [0-bearish to 100-bullish]: SilverCrest Metals[100], Alamos Gold[100], Kinross Gold[93], Methanex [93], Agnico Eagle[93], Pan American[90], Crescent Point[88], Sandstorm Gold[88], Suncor Energy[88], Cenovus Energy[88], IMAX [88]
Best Canada Stocks Year-to-Date:
Aurora Cannabis[1256.57%], Fusion [121.04%], D-Wave Quantum[81.22%], McEwen Mining[55.62%], Canopy Growth[55.38%], IAMGOLD [44.66%], OrganiGram [43.51%], Hudbay Minerals[41.12%], Celestica [39.11%], Silvercorp Metals[35.74%], Gold Royalty[34.95%] Best Canada Stocks This Week:
SilverCrest Metals[9.57%], TransAlta [6.44%], Canada Goose[5.84%], Lululemon Athletica[4.86%], Kinross Gold[4.48%], IMAX [4.26%], Agnico Eagle[3.89%], Sprott Physical[3.08%], SSR Mining[2.99%], Franco-Nevada [2.9%], Bausch +[2.81%] Best Canada Stocks Daily:
Vision Marine[7.40%], Trilogy Metals[5.79%], SilverCrest Metals[4.36%], Kinross Gold[3.99%], SSR Mining[3.99%], Aurinia [3.74%], Northern Dynasty[3.17%], Endeavour Silver[3.16%], Fortuna Silver[3.10%], Crescent Point[2.84%], Enbridge [2.83%]