
 Login Sign Up


| |||||
 |  | ||||

| 12Stocks.com Market Intelligence |
Best Canada Stocks
|
|
| Quick Read: Top Canada Stocks By Performances & Trends: Daily, Weekly, Year-to-Date, Market Cap (Size) & Technical Trends | |||
| Best Canada Views: Quick Browse View, Summary & Slide Show | |||
| 12Stocks.com Canada Stocks Performances & Trends Daily | |||||||||
|
|  The overall market intelligence score is 78 (0-bearish to 100-bullish) which puts Canada index in short term neutral to bullish trend. The market intelligence score from previous trading session is 56 and hence an improvement of trend.
| ||||||||
Here are the market intelligence trend scores of the most requested Canada stocks at 12Stocks.com (click stock name for detailed review):
| |||||||||||||||||
| Scroll down this page for most comprehensive review of Canada stocks by performance, trends, technical analysis, charts, fund plays & more | |||||||||||||||||


| 12Stocks.com: Top Performing Canada Index Stocks | ||||||||||||||||||||||||||||||||||||||||||||||||
 The top performing Canada Index stocks year to date are
Now, more recently, over last week, the top performing Canada Index stocks on the move are


|
||||||||||||||||||||||||||||||||||||||||||||||||
| 12Stocks.com: Investing in Canada Index with Stocks | |
|
The following table helps investors and traders sort through current performance and trends (as measured by market intelligence score) of various
stocks in the Canada Index. Quick View: Move mouse or cursor over stock symbol (ticker) to view short-term technical chart and over stock name to view long term chart. Click on  to add stock symbol to your watchlist and to add stock symbol to your watchlist and  to view watchlist. Click on any ticker or stock name for detailed market intelligence report for that stock. to view watchlist. Click on any ticker or stock name for detailed market intelligence report for that stock. |
12Stocks.com Performance of Stocks in Canada Index
| Ticker | Stock Name | Watchlist | Category | Recent Price | Market Intelligence Score | Change % | YTD Change% |
| NG | NovaGold Resources |   | Materials | 3.05 | 80 | 0.99 | -18.45% |
| ACHV | Achieve Life | | Health Care | 4.74 | 100 | 0.96 | 12.47% |
| DNN | Denison Mines | | Materials | 2.13 | 100 | 0.95 | 20.34% |
| MERC | Mercer | | Consumer Staples | 10.60 | 100 | 0.86 | 11.81% |
| PROF | Profound Medical | | Materials | 7.36 | 7 | 0.82 | -13.31% |
| SLF | Sun Life | | Financials | 52.48 | 64 | 0.81 | 1.20% |
| CRON | Cronos | | Health Care | 2.68 | 63 | 0.75 | 28.23% |
| FSI | Flexible | | Materials | 2.12 | 51 | 0.71 | 10.73% |
| WRN | Western Copper | | Materials | 1.48 | 53 | 0.68 | 11.28% |
| AQN | Algonquin Power | | Utilities | 6.54 | 100 | 0.62 | 3.48% |
| KGC | Kinross Gold | | Materials | 6.59 | 90 | 0.61 | 8.93% |
| HBM | Hudbay Minerals | | Materials | 8.37 | 78 | 0.60 | 51.63% |
| NTR | Nutrien | | Materials | 52.93 | 68 | 0.59 | -6.04% |
| ASTL | Algoma Steel | | Materials | 7.74 | 50 | 0.52 | -22.49% |
| APT | Alpha Tech | | Industrials | 6.09 | 78 | 0.50 | 15.12% |
| SU | Suncor Energy | | Energy | 38.24 | 76 | 0.50 | 19.35% |
| AGI | Alamos Gold | | Materials | 15.03 | 75 | 0.47 | 11.58% |
| VET | Vermilion Energy | | Energy | 11.81 | 68 | 0.43 | -2.07% |
| TGB | Taseko Mines | | Materials | 2.41 | 50 | 0.42 | 72.14% |
| SPPP | Sprott Physical | | Materials | 9.56 | 68 | 0.42 | -5.25% |
| ERF | Enerplus | | Energy | 19.56 | 53 | 0.41 | 27.51% |
| PBA | Pembina Pipeline | | Energy | 35.51 | 90 | 0.37 | 3.17% |
| SILV | SilverCrest Metals | | Materials | 8.31 | 71 | 0.36 | 26.87% |
| BB | BlackBerry | | Technology | 2.93 | 85 | 0.34 | -17.23% |
| FTS | Fortis | | Utilities | 39.91 | 95 | 0.33 | -2.97% |
| To view more stocks, click on Next / Previous arrows or select different range: 0 - 25 , 25 - 50 , 50 - 75 , 75 - 100 , 100 - 125 , 125 - 150 | ||
 | Click To Change The Sort Order: By Market Cap or Company Size Performance: Year-to-date, Week and Day |  |
| Detailed Overview Of Canada Stocks |
| Canada Technical Overview, Leaders & Laggards, Top Canada ETF Funds & Detailed Canada Stocks List, Charts, Trends & More |
| Canada: Technical Analysis, Trends & YTD Performance | |
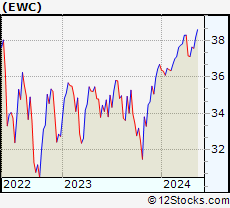
 EWC Weekly Chart |
|
| Long Term Trend: Very Good | |
| Medium Term Trend: Good | |
 EWC Daily Chart |
|
| Short Term Trend: Very Good | |
| Overall Trend Score: 78 | |
| YTD Performance: 2.43% | |
| **Trend Scores & Views Are Only For Educational Purposes And Not For Investing | |
| 12Stocks.com: Investing in Canada Index using Exchange Traded Funds | |
|
The following table shows list of key exchange traded funds (ETF) that
help investors play Canada stock market. For detailed view, check out our ETF Funds section of our website. Quick View: Move mouse or cursor over ETF symbol (ticker) to view short-term technical chart and over ETF name to view long term chart. Click on ticker or stock name for detailed view. Click on to add stock symbol to your watchlist and to view watchlist. |
12Stocks.com List of ETFs that track Canada Index
| Ticker | ETF Name | Watchlist | Recent Price | Market Intelligence Score | Change % | Week % | Year-to-date % |
| EWC | Canada | | 37.57 | 78 | 0.62 | -0.16 | 2.43% |
| 12Stocks.com: Charts, Trends, Fundamental Data and Performances of Canada Stocks | |
|
We now take in-depth look at all Canada stocks including charts, multi-period performances and overall trends (as measured by market intelligence score). One can sort Canada stocks (click link to choose) by Daily, Weekly and by Year-to-Date performances. Also, one can sort by size of the company or by market capitalization. |
| Select Your Default Chart Type: | |||||
| |||||
| Click on stock symbol or name for detailed view. Click on to add stock symbol to your watchlist and to view watchlist. Quick View: Move mouse or cursor over "Daily" to quickly view daily technical stock chart and over "Weekly" to view weekly technical stock chart. | |||||

 | NG NovaGold Resources Inc. |
| Sector: Materials | |
| SubSector: Gold | |
| MarketCap: 2499.49 Millions | |
| Recent Price: 3.05 Market Intelligence Score: 80 | |
| Day Percent Change: 0.99% Day Change: 0.03 | |
| Week Change: 3.74% Year-to-date Change: -18.5% | |
| NG Links: Profile News Message Board | |
| Charts:- Daily , Weekly | |
| Add NG to Watchlist: View: Get Complete NG Trend Analysis ➞ | |
 | ACHV Achieve Life Sciences, Inc. |
| Sector: Health Care | |
| SubSector: Biotechnology | |
| MarketCap: 7.32785 Millions | |
| Recent Price: 4.74 Market Intelligence Score: 100 | |
| Day Percent Change: 0.96% Day Change: 0.04 | |
| Week Change: 2.71% Year-to-date Change: 12.5% | |
| ACHV Links: Profile News Message Board | |
| Charts:- Daily , Weekly | |
| Add ACHV to Watchlist: View: Get Complete ACHV Trend Analysis ➞ | |
 | DNN Denison Mines Corp. |
| Sector: Materials | |
| SubSector: Industrial Metals & Minerals | |
| MarketCap: 154.11 Millions | |
| Recent Price: 2.13 Market Intelligence Score: 100 | |
| Day Percent Change: 0.95% Day Change: 0.02 | |
| Week Change: 4.93% Year-to-date Change: 20.3% | |
| DNN Links: Profile News Message Board | |
| Charts:- Daily , Weekly | |
| Add DNN to Watchlist: View: Get Complete DNN Trend Analysis ➞ | |
 | MERC Mercer International Inc. |
| Sector: Consumer Staples | |
| SubSector: Paper & Paper Products | |
| MarketCap: 509.003 Millions | |
| Recent Price: 10.60 Market Intelligence Score: 100 | |
| Day Percent Change: 0.86% Day Change: 0.09 | |
| Week Change: 5.47% Year-to-date Change: 11.8% | |
| MERC Links: Profile News Message Board | |
| Charts:- Daily , Weekly | |
| Add MERC to Watchlist: View: Get Complete MERC Trend Analysis ➞ | |
 | PROF Profound Medical Corp. |
| Sector: Materials | |
| SubSector: Industrial Metals & Minerals | |
| MarketCap: 121.41 Millions | |
| Recent Price: 7.36 Market Intelligence Score: 7 | |
| Day Percent Change: 0.82% Day Change: 0.06 | |
| Week Change: -8.34% Year-to-date Change: -13.3% | |
| PROF Links: Profile News Message Board | |
| Charts:- Daily , Weekly | |
| Add PROF to Watchlist: View: Get Complete PROF Trend Analysis ➞ | |
 | SLF Sun Life Financial Inc. |
| Sector: Financials | |
| SubSector: Property & Casualty Insurance | |
| MarketCap: 17722 Millions | |
| Recent Price: 52.48 Market Intelligence Score: 64 | |
| Day Percent Change: 0.81% Day Change: 0.42 | |
| Week Change: 1.57% Year-to-date Change: 1.2% | |
| SLF Links: Profile News Message Board | |
| Charts:- Daily , Weekly | |
| Add SLF to Watchlist: View: Get Complete SLF Trend Analysis ➞ | |
 | CRON Cronos Group Inc. |
| Sector: Health Care | |
| SubSector: Biotechnology | |
| MarketCap: 1935.95 Millions | |
| Recent Price: 2.68 Market Intelligence Score: 63 | |
| Day Percent Change: 0.75% Day Change: 0.02 | |
| Week Change: 3.47% Year-to-date Change: 28.2% | |
| CRON Links: Profile News Message Board | |
| Charts:- Daily , Weekly | |
| Add CRON to Watchlist: View: Get Complete CRON Trend Analysis ➞ | |
 | FSI Flexible Solutions International Inc. |
| Sector: Materials | |
| SubSector: Specialty Chemicals | |
| MarketCap: 14.3357 Millions | |
| Recent Price: 2.12 Market Intelligence Score: 51 | |
| Day Percent Change: 0.71% Day Change: 0.02 | |
| Week Change: -3.42% Year-to-date Change: 10.7% | |
| FSI Links: Profile News Message Board | |
| Charts:- Daily , Weekly | |
| Add FSI to Watchlist: View: Get Complete FSI Trend Analysis ➞ | |
 | WRN Western Copper and Gold Corporation |
| Sector: Materials | |
| SubSector: Industrial Metals & Minerals | |
| MarketCap: 38.191 Millions | |
| Recent Price: 1.48 Market Intelligence Score: 53 | |
| Day Percent Change: 0.68% Day Change: 0.01 | |
| Week Change: -5.73% Year-to-date Change: 11.3% | |
| WRN Links: Profile News Message Board | |
| Charts:- Daily , Weekly | |
| Add WRN to Watchlist: View: Get Complete WRN Trend Analysis ➞ | |
 | AQN Algonquin Power & Utilities Corp. |
| Sector: Utilities | |
| SubSector: Diversified Utilities | |
| MarketCap: 5916.4 Millions | |
| Recent Price: 6.54 Market Intelligence Score: 100 | |
| Day Percent Change: 0.62% Day Change: 0.04 | |
| Week Change: 6.86% Year-to-date Change: 3.5% | |
| AQN Links: Profile News Message Board | |
| Charts:- Daily , Weekly | |
| Add AQN to Watchlist: View: Get Complete AQN Trend Analysis ➞ | |
 | KGC Kinross Gold Corporation |
| Sector: Materials | |
| SubSector: Gold | |
| MarketCap: 5389.29 Millions | |
| Recent Price: 6.59 Market Intelligence Score: 90 | |
| Day Percent Change: 0.61% Day Change: 0.04 | |
| Week Change: -2.23% Year-to-date Change: 8.9% | |
| KGC Links: Profile News Message Board | |
| Charts:- Daily , Weekly | |
| Add KGC to Watchlist: View: Get Complete KGC Trend Analysis ➞ | |
 | HBM Hudbay Minerals Inc. |
| Sector: Materials | |
| SubSector: Copper | |
| MarketCap: 363.157 Millions | |
| Recent Price: 8.37 Market Intelligence Score: 78 | |
| Day Percent Change: 0.60% Day Change: 0.05 | |
| Week Change: -3.01% Year-to-date Change: 51.6% | |
| HBM Links: Profile News Message Board | |
| Charts:- Daily , Weekly | |
| Add HBM to Watchlist: View: Get Complete HBM Trend Analysis ➞ | |
 | NTR Nutrien Ltd. |
| Sector: Materials | |
| SubSector: Agricultural Chemicals | |
| MarketCap: 15897.9 Millions | |
| Recent Price: 52.93 Market Intelligence Score: 68 | |
| Day Percent Change: 0.59% Day Change: 0.31 | |
| Week Change: 0.72% Year-to-date Change: -6.0% | |
| NTR Links: Profile News Message Board | |
| Charts:- Daily , Weekly | |
| Add NTR to Watchlist: View: Get Complete NTR Trend Analysis ➞ | |
 | ASTL Algoma Steel Group Inc. |
| Sector: Materials | |
| SubSector: Steel | |
| MarketCap: 731 Millions | |
| Recent Price: 7.74 Market Intelligence Score: 50 | |
| Day Percent Change: 0.52% Day Change: 0.04 | |
| Week Change: -1.53% Year-to-date Change: -22.5% | |
| ASTL Links: Profile News Message Board | |
| Charts:- Daily , Weekly | |
| Add ASTL to Watchlist: View: Get Complete ASTL Trend Analysis ➞ | |
 | APT Alpha Pro Tech, Ltd. |
| Sector: Industrials | |
| SubSector: General Building Materials | |
| MarketCap: 125.953 Millions | |
| Recent Price: 6.09 Market Intelligence Score: 78 | |
| Day Percent Change: 0.50% Day Change: 0.03 | |
| Week Change: -0.98% Year-to-date Change: 15.1% | |
| APT Links: Profile News Message Board | |
| Charts:- Daily , Weekly | |
| Add APT to Watchlist: View: Get Complete APT Trend Analysis ➞ | |
 | SU Suncor Energy Inc. |
| Sector: Energy | |
| SubSector: Independent Oil & Gas | |
| MarketCap: 21550.6 Millions | |
| Recent Price: 38.24 Market Intelligence Score: 76 | |
| Day Percent Change: 0.50% Day Change: 0.19 | |
| Week Change: -2.97% Year-to-date Change: 19.4% | |
| SU Links: Profile News Message Board | |
| Charts:- Daily , Weekly | |
| Add SU to Watchlist: View: Get Complete SU Trend Analysis ➞ | |
 | AGI Alamos Gold Inc. |
| Sector: Materials | |
| SubSector: Gold | |
| MarketCap: 1740.39 Millions | |
| Recent Price: 15.03 Market Intelligence Score: 75 | |
| Day Percent Change: 0.47% Day Change: 0.07 | |
| Week Change: -1.76% Year-to-date Change: 11.6% | |
| AGI Links: Profile News Message Board | |
| Charts:- Daily , Weekly | |
| Add AGI to Watchlist: View: Get Complete AGI Trend Analysis ➞ | |
 | VET Vermilion Energy Inc. |
| Sector: Energy | |
| SubSector: Oil & Gas Drilling & Exploration | |
| MarketCap: 335.839 Millions | |
| Recent Price: 11.81 Market Intelligence Score: 68 | |
| Day Percent Change: 0.43% Day Change: 0.05 | |
| Week Change: -2.32% Year-to-date Change: -2.1% | |
| VET Links: Profile News Message Board | |
| Charts:- Daily , Weekly | |
| Add VET to Watchlist: View: Get Complete VET Trend Analysis ➞ | |
 | TGB Taseko Mines Limited |
| Sector: Materials | |
| SubSector: Industrial Metals & Minerals | |
| MarketCap: 55.991 Millions | |
| Recent Price: 2.41 Market Intelligence Score: 50 | |
| Day Percent Change: 0.42% Day Change: 0.01 | |
| Week Change: -7.31% Year-to-date Change: 72.1% | |
| TGB Links: Profile News Message Board | |
| Charts:- Daily , Weekly | |
| Add TGB to Watchlist: View: Get Complete TGB Trend Analysis ➞ | |
 | SPPP Sprott Physical Platinum and Palladium Trust |
| Sector: Materials | |
| SubSector: Industrial Metals & Minerals | |
| MarketCap: 82.791 Millions | |
| Recent Price: 9.56 Market Intelligence Score: 68 | |
| Day Percent Change: 0.42% Day Change: 0.04 | |
| Week Change: 1.27% Year-to-date Change: -5.3% | |
| SPPP Links: Profile News Message Board | |
| Charts:- Daily , Weekly | |
| Add SPPP to Watchlist: View: Get Complete SPPP Trend Analysis ➞ | |
 | ERF Enerplus Corporation |
| Sector: Energy | |
| SubSector: Oil & Gas Drilling & Exploration | |
| MarketCap: 372.639 Millions | |
| Recent Price: 19.56 Market Intelligence Score: 53 | |
| Day Percent Change: 0.41% Day Change: 0.08 | |
| Week Change: -4.63% Year-to-date Change: 27.5% | |
| ERF Links: Profile News Message Board | |
| Charts:- Daily , Weekly | |
| Add ERF to Watchlist: View: Get Complete ERF Trend Analysis ➞ | |
 | PBA Pembina Pipeline Corporation |
| Sector: Energy | |
| SubSector: Oil & Gas Pipelines | |
| MarketCap: 8813.35 Millions | |
| Recent Price: 35.51 Market Intelligence Score: 90 | |
| Day Percent Change: 0.37% Day Change: 0.13 | |
| Week Change: -0.87% Year-to-date Change: 3.2% | |
| PBA Links: Profile News Message Board | |
| Charts:- Daily , Weekly | |
| Add PBA to Watchlist: View: Get Complete PBA Trend Analysis ➞ | |
 | SILV SilverCrest Metals Inc. |
| Sector: Materials | |
| SubSector: Silver | |
| MarketCap: 555.356 Millions | |
| Recent Price: 8.31 Market Intelligence Score: 71 | |
| Day Percent Change: 0.36% Day Change: 0.03 | |
| Week Change: -2.58% Year-to-date Change: 26.9% | |
| SILV Links: Profile News Message Board | |
| Charts:- Daily , Weekly | |
| Add SILV to Watchlist: View: Get Complete SILV Trend Analysis ➞ | |
 | BB BlackBerry Limited |
| Sector: Technology | |
| SubSector: Communication Equipment | |
| MarketCap: 2100.39 Millions | |
| Recent Price: 2.93 Market Intelligence Score: 85 | |
| Day Percent Change: 0.34% Day Change: 0.01 | |
| Week Change: 3.53% Year-to-date Change: -17.2% | |
| BB Links: Profile News Message Board | |
| Charts:- Daily , Weekly | |
| Add BB to Watchlist: View: Get Complete BB Trend Analysis ➞ | |
 | FTS Fortis Inc. |
| Sector: Utilities | |
| SubSector: Electric Utilities | |
| MarketCap: 14741.8 Millions | |
| Recent Price: 39.91 Market Intelligence Score: 95 | |
| Day Percent Change: 0.33% Day Change: 0.13 | |
| Week Change: 2.18% Year-to-date Change: -3.0% | |
| FTS Links: Profile News Message Board | |
| Charts:- Daily , Weekly | |
| Add FTS to Watchlist: View: Get Complete FTS Trend Analysis ➞ | |
| To view more stocks, click on Next / Previous arrows or select different range: 0 - 25 , 25 - 50 , 50 - 75 , 75 - 100 , 100 - 125 , 125 - 150 | ||
| Click To Change The Sort Order: By Market Cap or Company Size Performance: Year-to-date, Week and Day | |
| Select Chart Type: | ||
 Best Stocks Today 12Stocks.com |
© 2024 12Stocks.com Terms & Conditions Privacy Contact Us
All Information Provided Only For Education And Not To Be Used For Investing or Trading. See Terms & Conditions


One More Thing ... Get Best Stocks Delivered Daily!
Never Ever Miss A Move With Our Top Ten Stocks Lists
Find Best Stocks In Any Market - Bull or Bear Market
Take A Peek At Our Top Ten Stocks Lists: Daily, Weekly, Year-to-Date & Top Trends
Find Best Stocks In Any Market - Bull or Bear Market
Take A Peek At Our Top Ten Stocks Lists: Daily, Weekly, Year-to-Date & Top Trends
Canada Stocks With Best Up Trends [0-bearish to 100-bullish]: TransAlta [100], Brookfield Renewable[100], Algonquin Power[100], Royal Bank[100], City Office[100], CAE [100], Denison Mines[100], Mercer [100], Algonquin Power[100], Franco-Nevada [95], Manulife Financial[95]
Best Canada Stocks Year-to-Date:
Aurora Cannabis[1315.37%], Fusion [123.39%], Canopy Growth[100.39%], McEwen Mining[63.11%], D-Wave Quantum[60.13%], Hudbay Minerals[51.63%], IAMGOLD [41.9%], OrganiGram [41.6%], Endeavour Silver[34.52%], Gold Royalty[34.26%], Cronos [28.23%] Best Canada Stocks This Week:
Brookfield Renewable[20.81%], Tilray [17.98%], Canopy Growth[14.93%], Zymeworks [11.38%], Canadian Solar[10.83%], Milestone [9.74%], AbCellera Biologics[9.71%], Repare [8.13%], Ballard Power[8.08%], Xenon [8.02%], Algonquin Power[7.79%] Best Canada Stocks Daily:
AbCellera Biologics[11.49%], Lion Electric[8.71%], TransAlta [4.74%], Brookfield Renewable[4.54%], Algonquin Power[4.39%], Tilray [3.96%], Shopify [3.42%], TC Energy[3.32%], Repare [3.28%], Colliers [3.22%], Milestone [3.05%]