
 Login Sign Up


| |||||
 |  | ||||

| 12Stocks.com Market Intelligence |
Best Canada Stocks
|
|
| Quick Read: Top Canada Stocks By Performances & Trends: Daily, Weekly, Year-to-Date, Market Cap (Size) & Technical Trends | |||
| Best Canada Views: Quick Browse View, Summary & Slide Show | |||
| 12Stocks.com Canada Stocks Performances & Trends Daily | |||||||||
|
|  The overall market intelligence score is 68 (0-bearish to 100-bullish) which puts Canada index in short term neutral to bullish trend. The market intelligence score from previous trading session is 61 and hence an improvement of trend.
| ||||||||
Here are the market intelligence trend scores of the most requested Canada stocks at 12Stocks.com (click stock name for detailed review):
| ||||||||||||||||||
| Scroll down this page for most comprehensive review of Canada stocks by performance, trends, technical analysis, charts, fund plays & more | ||||||||||||||||||


| 12Stocks.com: Top Performing Canada Index Stocks | ||||||||||||||||||||||||||||||||||||||||||||||||
 The top performing Canada Index stocks year to date are
Now, more recently, over last week, the top performing Canada Index stocks on the move are


|
||||||||||||||||||||||||||||||||||||||||||||||||
| 12Stocks.com: Investing in Canada Index with Stocks | |
|
The following table helps investors and traders sort through current performance and trends (as measured by market intelligence score) of various
stocks in the Canada Index. Quick View: Move mouse or cursor over stock symbol (ticker) to view short-term technical chart and over stock name to view long term chart. Click on  to add stock symbol to your watchlist and to add stock symbol to your watchlist and  to view watchlist. Click on any ticker or stock name for detailed market intelligence report for that stock. to view watchlist. Click on any ticker or stock name for detailed market intelligence report for that stock. |
12Stocks.com Performance of Stocks in Canada Index
| Ticker | Stock Name | Watchlist | Category | Recent Price | Market Intelligence Score | Change % | Weekly Change% |
| STKL | SunOpta |   | Consumer Staples | 6.69 | 100 | 2.14% | 12.25% |
| CGC | Canopy Growth | | Health Care | 8.91 | 80 | 2.53% | 12.22% |
| HBM | Hudbay Minerals | | Materials | 8.63 | 100 | 6.28% | 10.78% |
| GROY | Gold Royalty | | Materials | 2.15 | 75 | 5.39% | 10.26% |
| CRON | Cronos | | Health Care | 2.59 | 60 | 3.60% | 9.28% |
| MUX | McEwen Mining | | Materials | 12.26 | 100 | 2.68% | 9.27% |
| WRN | Western Copper | | Materials | 1.57 | 51 | 7.90% | 9.03% |
| PDS | Precision Drilling | | Energy | 72.30 | 80 | 5.12% | 8.20% |
| SILV | SilverCrest Metals | | Materials | 8.53 | 100 | 0.24% | 7.97% |
| NOA | Construction | | Energy | 22.07 | 49 | 1.28% | 7.45% |
| VMAR | Vision Marine | | Services & Goods | 0.60 | 47 | 10.55% | 7.09% |
| PROF | Profound Medical | | Materials | 8.03 | 32 | 2.95% | 6.92% |
| SNDL | Sundial Growers | | Health Care | 2.01 | 70 | 2.55% | 6.91% |
| TECK | Teck Resources | | Materials | 50.38 | 50 | 1.70% | 6.90% |
| CLS | Celestica | | Technology | 43.46 | 31 | 0.49% | 6.70% |
| EXK | Endeavour Silver | | Materials | 2.78 | 73 | -0.36% | 6.51% |
| FSI | Flexible | | Materials | 2.19 | 78 | -3.10% | 6.31% |
| RPTX | Repare | | Health Care | 3.20 | 35 | 0.63% | 5.96% |
| TIXT | TEL | | Technology | 8.27 | 42 | 2.48% | 5.89% |
| TGB | Taseko Mines | | Materials | 2.60 | 88 | 5.26% | 5.69% |
| MERC | Mercer | | Consumer Staples | 10.05 | 78 | -1.95% | 5.35% |
| VOXR | Vox Royalty | | Materials | 2.12 | 75 | 2.91% | 5.21% |
| CSIQ | Canadian Solar | | Technology | 15.15 | 52 | 4.48% | 5.14% |
| TFPM | Triple Flag | | Materials | 16.36 | 100 | 0.99% | 5.01% |
| BUR | Burcon Nutrascience | | Health Care | 15.39 | 24 | 1.38% | 4.91% |
| To view more stocks, click on Next / Previous arrows or select different range: 0 - 25 , 25 - 50 , 50 - 75 , 75 - 100 , 100 - 125 , 125 - 150 | ||
 | Click To Change The Sort Order: By Market Cap or Company Size Performance: Year-to-date, Week and Day |  |
| Detailed Overview Of Canada Stocks |
| Canada Technical Overview, Leaders & Laggards, Top Canada ETF Funds & Detailed Canada Stocks List, Charts, Trends & More |
| Canada: Technical Analysis, Trends & YTD Performance | |
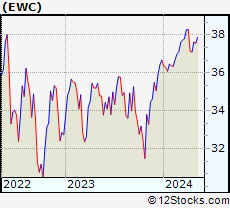
 EWC Weekly Chart |
|
| Long Term Trend: Very Good | |
| Medium Term Trend: Not Good | |
 EWC Daily Chart |
|
| Short Term Trend: Deteriorating | |
| Overall Trend Score: 68 | |
| YTD Performance: 2.59% | |
| **Trend Scores & Views Are Only For Educational Purposes And Not For Investing | |
| 12Stocks.com: Investing in Canada Index using Exchange Traded Funds | |
|
The following table shows list of key exchange traded funds (ETF) that
help investors play Canada stock market. For detailed view, check out our ETF Funds section of our website. Quick View: Move mouse or cursor over ETF symbol (ticker) to view short-term technical chart and over ETF name to view long term chart. Click on ticker or stock name for detailed view. Click on to add stock symbol to your watchlist and to view watchlist. |
12Stocks.com List of ETFs that track Canada Index
| Ticker | ETF Name | Watchlist | Recent Price | Market Intelligence Score | Change % | Week % | Year-to-date % |
| EWC | Canada | | 37.63 | 68 | 0.35 | 1.4 | 2.59% |
| 12Stocks.com: Charts, Trends, Fundamental Data and Performances of Canada Stocks | |
|
We now take in-depth look at all Canada stocks including charts, multi-period performances and overall trends (as measured by market intelligence score). One can sort Canada stocks (click link to choose) by Daily, Weekly and by Year-to-Date performances. Also, one can sort by size of the company or by market capitalization. |
| Select Your Default Chart Type: | |||||
| |||||
| Click on stock symbol or name for detailed view. Click on to add stock symbol to your watchlist and to view watchlist. Quick View: Move mouse or cursor over "Daily" to quickly view daily technical stock chart and over "Weekly" to view weekly technical stock chart. | |||||

 | STKL SunOpta Inc. |
| Sector: Consumer Staples | |
| SubSector: Processed & Packaged Goods | |
| MarketCap: 174.548 Millions | |
| Recent Price: 6.69 Market Intelligence Score: 100 | |
| Day Percent Change: 2.14% Day Change: 0.14 | |
| Week Change: 12.25% Year-to-date Change: 22.3% | |
| STKL Links: Profile News Message Board | |
| Charts:- Daily , Weekly | |
| Add STKL to Watchlist: View: Get Complete STKL Trend Analysis ➞ | |
 | CGC Canopy Growth Corporation |
| Sector: Health Care | |
| SubSector: Drug Manufacturers - Other | |
| MarketCap: 4136.33 Millions | |
| Recent Price: 8.91 Market Intelligence Score: 80 | |
| Day Percent Change: 2.53% Day Change: 0.22 | |
| Week Change: 12.22% Year-to-date Change: 74.4% | |
| CGC Links: Profile News Message Board | |
| Charts:- Daily , Weekly | |
| Add CGC to Watchlist: View: Get Complete CGC Trend Analysis ➞ | |
 | HBM Hudbay Minerals Inc. |
| Sector: Materials | |
| SubSector: Copper | |
| MarketCap: 363.157 Millions | |
| Recent Price: 8.63 Market Intelligence Score: 100 | |
| Day Percent Change: 6.28% Day Change: 0.51 | |
| Week Change: 10.78% Year-to-date Change: 56.3% | |
| HBM Links: Profile News Message Board | |
| Charts:- Daily , Weekly | |
| Add HBM to Watchlist: View: Get Complete HBM Trend Analysis ➞ | |
 | GROY Gold Royalty Corp. |
| Sector: Materials | |
| SubSector: Other Precious Metals & Mining | |
| MarketCap: 254 Millions | |
| Recent Price: 2.15 Market Intelligence Score: 75 | |
| Day Percent Change: 5.39% Day Change: 0.11 | |
| Week Change: 10.26% Year-to-date Change: 48.8% | |
| GROY Links: Profile News Message Board | |
| Charts:- Daily , Weekly | |
| Add GROY to Watchlist: View: Get Complete GROY Trend Analysis ➞ | |
 | CRON Cronos Group Inc. |
| Sector: Health Care | |
| SubSector: Biotechnology | |
| MarketCap: 1935.95 Millions | |
| Recent Price: 2.59 Market Intelligence Score: 60 | |
| Day Percent Change: 3.60% Day Change: 0.09 | |
| Week Change: 9.28% Year-to-date Change: 23.9% | |
| CRON Links: Profile News Message Board | |
| Charts:- Daily , Weekly | |
| Add CRON to Watchlist: View: Get Complete CRON Trend Analysis ➞ | |
 | MUX McEwen Mining Inc. |
| Sector: Materials | |
| SubSector: Gold | |
| MarketCap: 264.819 Millions | |
| Recent Price: 12.26 Market Intelligence Score: 100 | |
| Day Percent Change: 2.68% Day Change: 0.32 | |
| Week Change: 9.27% Year-to-date Change: 70.0% | |
| MUX Links: Profile News Message Board | |
| Charts:- Daily , Weekly | |
| Add MUX to Watchlist: View: Get Complete MUX Trend Analysis ➞ | |
 | WRN Western Copper and Gold Corporation |
| Sector: Materials | |
| SubSector: Industrial Metals & Minerals | |
| MarketCap: 38.191 Millions | |
| Recent Price: 1.57 Market Intelligence Score: 51 | |
| Day Percent Change: 7.90% Day Change: 0.11 | |
| Week Change: 9.03% Year-to-date Change: 18.1% | |
| WRN Links: Profile News Message Board | |
| Charts:- Daily , Weekly | |
| Add WRN to Watchlist: View: Get Complete WRN Trend Analysis ➞ | |
 | PDS Precision Drilling Corporation |
| Sector: Energy | |
| SubSector: Oil & Gas Equipment & Services | |
| MarketCap: 103.461 Millions | |
| Recent Price: 72.30 Market Intelligence Score: 80 | |
| Day Percent Change: 5.12% Day Change: 3.52 | |
| Week Change: 8.2% Year-to-date Change: 33.2% | |
| PDS Links: Profile News Message Board | |
| Charts:- Daily , Weekly | |
| Add PDS to Watchlist: View: Get Complete PDS Trend Analysis ➞ | |
 | SILV SilverCrest Metals Inc. |
| Sector: Materials | |
| SubSector: Silver | |
| MarketCap: 555.356 Millions | |
| Recent Price: 8.53 Market Intelligence Score: 100 | |
| Day Percent Change: 0.24% Day Change: 0.02 | |
| Week Change: 7.97% Year-to-date Change: 30.2% | |
| SILV Links: Profile News Message Board | |
| Charts:- Daily , Weekly | |
| Add SILV to Watchlist: View: Get Complete SILV Trend Analysis ➞ | |
 | NOA North American Construction Group Ltd. |
| Sector: Energy | |
| SubSector: Oil & Gas Equipment & Services | |
| MarketCap: 160.461 Millions | |
| Recent Price: 22.07 Market Intelligence Score: 49 | |
| Day Percent Change: 1.28% Day Change: 0.28 | |
| Week Change: 7.45% Year-to-date Change: 5.9% | |
| NOA Links: Profile News Message Board | |
| Charts:- Daily , Weekly | |
| Add NOA to Watchlist: View: Get Complete NOA Trend Analysis ➞ | |
 | VMAR Vision Marine Technologies Inc. |
| Sector: Services & Goods | |
| SubSector: Leisure | |
| MarketCap: 99027 Millions | |
| Recent Price: 0.60 Market Intelligence Score: 47 | |
| Day Percent Change: 10.55% Day Change: 0.06 | |
| Week Change: 7.09% Year-to-date Change: -44.9% | |
| VMAR Links: Profile News Message Board | |
| Charts:- Daily , Weekly | |
| Add VMAR to Watchlist: View: Get Complete VMAR Trend Analysis ➞ | |
 | PROF Profound Medical Corp. |
| Sector: Materials | |
| SubSector: Industrial Metals & Minerals | |
| MarketCap: 121.41 Millions | |
| Recent Price: 8.03 Market Intelligence Score: 32 | |
| Day Percent Change: 2.95% Day Change: 0.23 | |
| Week Change: 6.92% Year-to-date Change: -5.4% | |
| PROF Links: Profile News Message Board | |
| Charts:- Daily , Weekly | |
| Add PROF to Watchlist: View: Get Complete PROF Trend Analysis ➞ | |
 | SNDL Sundial Growers Inc. |
| Sector: Health Care | |
| SubSector: Drug Manufacturers - Other | |
| MarketCap: 94.4033 Millions | |
| Recent Price: 2.01 Market Intelligence Score: 70 | |
| Day Percent Change: 2.55% Day Change: 0.05 | |
| Week Change: 6.91% Year-to-date Change: 22.6% | |
| SNDL Links: Profile News Message Board | |
| Charts:- Daily , Weekly | |
| Add SNDL to Watchlist: View: Get Complete SNDL Trend Analysis ➞ | |
 | TECK Teck Resources Limited |
| Sector: Materials | |
| SubSector: Industrial Metals & Minerals | |
| MarketCap: 4347.4 Millions | |
| Recent Price: 50.38 Market Intelligence Score: 50 | |
| Day Percent Change: 1.70% Day Change: 0.84 | |
| Week Change: 6.9% Year-to-date Change: 19.2% | |
| TECK Links: Profile News Message Board | |
| Charts:- Daily , Weekly | |
| Add TECK to Watchlist: View: Get Complete TECK Trend Analysis ➞ | |
 | CLS Celestica Inc. |
| Sector: Technology | |
| SubSector: Printed Circuit Boards | |
| MarketCap: 474.235 Millions | |
| Recent Price: 43.46 Market Intelligence Score: 31 | |
| Day Percent Change: 0.49% Day Change: 0.21 | |
| Week Change: 6.7% Year-to-date Change: 48.4% | |
| CLS Links: Profile News Message Board | |
| Charts:- Daily , Weekly | |
| Add CLS to Watchlist: View: Get Complete CLS Trend Analysis ➞ | |
 | EXK Endeavour Silver Corp. |
| Sector: Materials | |
| SubSector: Silver | |
| MarketCap: 204.456 Millions | |
| Recent Price: 2.78 Market Intelligence Score: 73 | |
| Day Percent Change: -0.36% Day Change: -0.01 | |
| Week Change: 6.51% Year-to-date Change: 41.1% | |
| EXK Links: Profile News Message Board | |
| Charts:- Daily , Weekly | |
| Add EXK to Watchlist: View: Get Complete EXK Trend Analysis ➞ | |
 | FSI Flexible Solutions International Inc. |
| Sector: Materials | |
| SubSector: Specialty Chemicals | |
| MarketCap: 14.3357 Millions | |
| Recent Price: 2.19 Market Intelligence Score: 78 | |
| Day Percent Change: -3.10% Day Change: -0.07 | |
| Week Change: 6.31% Year-to-date Change: 14.7% | |
| FSI Links: Profile News Message Board | |
| Charts:- Daily , Weekly | |
| Add FSI to Watchlist: View: Get Complete FSI Trend Analysis ➞ | |
 | RPTX Repare Therapeutics Inc. |
| Sector: Health Care | |
| SubSector: Biotechnology | |
| MarketCap: 13687 Millions | |
| Recent Price: 3.20 Market Intelligence Score: 35 | |
| Day Percent Change: 0.63% Day Change: 0.02 | |
| Week Change: 5.96% Year-to-date Change: -56.2% | |
| RPTX Links: Profile News Message Board | |
| Charts:- Daily , Weekly | |
| Add RPTX to Watchlist: View: Get Complete RPTX Trend Analysis ➞ | |
 | TIXT TELUS International (Cda) Inc. |
| Sector: Technology | |
| SubSector: Software - Infrastructure | |
| MarketCap: 1470 Millions | |
| Recent Price: 8.27 Market Intelligence Score: 42 | |
| Day Percent Change: 2.48% Day Change: 0.20 | |
| Week Change: 5.89% Year-to-date Change: -3.3% | |
| TIXT Links: Profile News Message Board | |
| Charts:- Daily , Weekly | |
| Add TIXT to Watchlist: View: Get Complete TIXT Trend Analysis ➞ | |
 | TGB Taseko Mines Limited |
| Sector: Materials | |
| SubSector: Industrial Metals & Minerals | |
| MarketCap: 55.991 Millions | |
| Recent Price: 2.60 Market Intelligence Score: 88 | |
| Day Percent Change: 5.26% Day Change: 0.13 | |
| Week Change: 5.69% Year-to-date Change: 85.7% | |
| TGB Links: Profile News Message Board | |
| Charts:- Daily , Weekly | |
| Add TGB to Watchlist: View: Get Complete TGB Trend Analysis ➞ | |
 | MERC Mercer International Inc. |
| Sector: Consumer Staples | |
| SubSector: Paper & Paper Products | |
| MarketCap: 509.003 Millions | |
| Recent Price: 10.05 Market Intelligence Score: 78 | |
| Day Percent Change: -1.95% Day Change: -0.20 | |
| Week Change: 5.35% Year-to-date Change: 6.0% | |
| MERC Links: Profile News Message Board | |
| Charts:- Daily , Weekly | |
| Add MERC to Watchlist: View: Get Complete MERC Trend Analysis ➞ | |
 | VOXR Vox Royalty Corp. |
| Sector: Materials | |
| SubSector: Other Precious Metals & Mining | |
| MarketCap: 154 Millions | |
| Recent Price: 2.12 Market Intelligence Score: 75 | |
| Day Percent Change: 2.91% Day Change: 0.06 | |
| Week Change: 5.21% Year-to-date Change: 2.9% | |
| VOXR Links: Profile News Message Board | |
| Charts:- Daily , Weekly | |
| Add VOXR to Watchlist: View: Get Complete VOXR Trend Analysis ➞ | |
 | CSIQ Canadian Solar Inc. |
| Sector: Technology | |
| SubSector: Semiconductor - Specialized | |
| MarketCap: 957.96 Millions | |
| Recent Price: 15.15 Market Intelligence Score: 52 | |
| Day Percent Change: 4.48% Day Change: 0.65 | |
| Week Change: 5.14% Year-to-date Change: -42.2% | |
| CSIQ Links: Profile News Message Board | |
| Charts:- Daily , Weekly | |
| Add CSIQ to Watchlist: View: Get Complete CSIQ Trend Analysis ➞ | |
 | TFPM Triple Flag Precious Metals Corp. |
| Sector: Materials | |
| SubSector: Other Precious Metals & Mining | |
| MarketCap: 3640 Millions | |
| Recent Price: 16.36 Market Intelligence Score: 100 | |
| Day Percent Change: 0.99% Day Change: 0.16 | |
| Week Change: 5.01% Year-to-date Change: 23.6% | |
| TFPM Links: Profile News Message Board | |
| Charts:- Daily , Weekly | |
| Add TFPM to Watchlist: View: Get Complete TFPM Trend Analysis ➞ | |
 | BUR Burcon Nutrascience Corporation |
| Sector: Health Care | |
| SubSector: Biotechnology | |
| MarketCap: 0 Millions | |
| Recent Price: 15.39 Market Intelligence Score: 24 | |
| Day Percent Change: 1.38% Day Change: 0.21 | |
| Week Change: 4.91% Year-to-date Change: -1.4% | |
| BUR Links: Profile News Message Board | |
| Charts:- Daily , Weekly | |
| Add BUR to Watchlist: View: Get Complete BUR Trend Analysis ➞ | |
| To view more stocks, click on Next / Previous arrows or select different range: 0 - 25 , 25 - 50 , 50 - 75 , 75 - 100 , 100 - 125 , 125 - 150 | ||
| Click To Change The Sort Order: By Market Cap or Company Size Performance: Year-to-date, Week and Day | |
| Select Chart Type: | ||
 Best Stocks Today 12Stocks.com |
© 2024 12Stocks.com Terms & Conditions Privacy Contact Us
All Information Provided Only For Education And Not To Be Used For Investing or Trading. See Terms & Conditions


One More Thing ... Get Best Stocks Delivered Daily!
Never Ever Miss A Move With Our Top Ten Stocks Lists
Find Best Stocks In Any Market - Bull or Bear Market
Take A Peek At Our Top Ten Stocks Lists: Daily, Weekly, Year-to-Date & Top Trends
Find Best Stocks In Any Market - Bull or Bear Market
Take A Peek At Our Top Ten Stocks Lists: Daily, Weekly, Year-to-Date & Top Trends
Canada Stocks With Best Up Trends [0-bearish to 100-bullish]: Hudbay Minerals[100], McEwen Mining[100], SunOpta [100], Triple Flag[100], Agnico Eagle[100], SilverCrest Metals[100], Kinross Gold[100], Fortuna Silver[100], Descartes Systems[100], Enbridge [100], Sandstorm Gold[95]
Best Canada Stocks Year-to-Date:
Aurora Cannabis[1306.97%], Fusion [123.13%], Canopy Growth[74.36%], McEwen Mining[70.04%], D-Wave Quantum[64.12%], Hudbay Minerals[56.34%], IAMGOLD [49.41%], Gold Royalty[48.79%], Celestica [48.43%], OrganiGram [41.98%], Endeavour Silver[41.12%] Best Canada Stocks This Week:
SunOpta [12.25%], Canopy Growth[12.22%], Hudbay Minerals[10.78%], Gold Royalty[10.26%], Cronos [9.28%], McEwen Mining[9.27%], SilverCrest Metals[7.97%], Construction [7.45%], Vision Marine[7.09%], Teck Resources[6.9%], Celestica [6.7%] Best Canada Stocks Daily:
Ivanhoe Electric[11.83%], Vision Marine[10.55%], Hudbay Minerals[6.28%], Gold Royalty[5.39%], Equinox Gold[5.33%], Ballard Power[5.26%], Lion Electric[4.48%], Canadian Solar[4.48%], Cronos [3.60%], Lithium Americas[3.59%], AbCellera Biologics[3.58%]