
 Login Sign Up


| |||||
 |  | ||||

| 12Stocks.com Market Intelligence |
Best Canada Stocks
|
|
| Quick Read: Top Canada Stocks By Performances & Trends: Daily, Weekly, Year-to-Date, Market Cap (Size) & Technical Trends | |||
| Best Canada Views: Quick Browse View, Summary & Slide Show | |||
| 12Stocks.com Canada Stocks Performances & Trends Daily | |||||||||
|
|  The overall market intelligence score is 39 (0-bearish to 100-bullish) which puts Canada index in short term bearish to neutral trend. The market intelligence score from previous trading session is 46 and hence a deterioration of trend.
| ||||||||
Here are the market intelligence trend scores of the most requested Canada stocks at 12Stocks.com (click stock name for detailed review):
| |||||||||||||||||
| Scroll down this page for most comprehensive review of Canada stocks by performance, trends, technical analysis, charts, fund plays & more | |||||||||||||||||


| 12Stocks.com: Top Performing Canada Index Stocks | ||||||||||||||||||||||||||||||||||||||||||||||||
 The top performing Canada Index stocks year to date are
Now, more recently, over last week, the top performing Canada Index stocks on the move are


|
||||||||||||||||||||||||||||||||||||||||||||||||
| 12Stocks.com: Investing in Canada Index with Stocks | |
|
The following table helps investors and traders sort through current performance and trends (as measured by market intelligence score) of various
stocks in the Canada Index. Quick View: Move mouse or cursor over stock symbol (ticker) to view short-term technical chart and over stock name to view long term chart. Click on  to add stock symbol to your watchlist and to add stock symbol to your watchlist and  to view watchlist. Click on any ticker or stock name for detailed market intelligence report for that stock. to view watchlist. Click on any ticker or stock name for detailed market intelligence report for that stock. |
12Stocks.com Performance of Stocks in Canada Index
| Ticker | Stock Name | Watchlist | Category | Recent Price | Market Intelligence Score | Change % | Weekly Change% |
| SILV | SilverCrest Metals |   | Materials | 8.37 | 63 | 2.45% | -1.88% |
| WPM | Wheaton Precious | | Materials | 52.97 | 25 | 1.59% | -1.91% |
| AEM | Agnico Eagle | | Materials | 64.24 | 88 | 1.40% | -1.95% |
| CM | Canadian Imperial | | Financials | 46.88 | 28 | 0.41% | -1.97% |
| GIL | Gildan Activewear | | Consumer Staples | 34.59 | 23 | -0.20% | -2.01% |
| QBTS | D-Wave Quantum | | Technology | 1.41 | 15 | 2.92% | -2.08% |
| MOGO | Mogo | | Financials | 1.83 | 0 | -1.88% | -2.14% |
| GTE | Gran Tierra | | Energy | 8.19 | 53 | -5.21% | -2.15% |
| FSV | Service | | Financials | 146.49 | 10 | -0.35% | -2.21% |
| AGI | Alamos Gold | | Materials | 14.96 | 68 | 1.70% | -2.22% |
| DOOO | BRP | | Consumer Staples | 67.20 | 46 | -0.10% | -2.24% |
| PAAS | Pan American | | Materials | 18.57 | 65 | 0.70% | -2.37% |
| TMQ | Trilogy Metals | | Materials | 0.40 | 0 | -0.52% | -2.41% |
| RBA | Ritchie Bros. | | Services & Goods | 71.37 | 0 | -0.29% | -2.47% |
| ASTL | Algoma Steel | | Materials | 7.66 | 10 | 0.13% | -2.48% |
| VFF | Village Farms | | Consumer Staples | 1.32 | 95 | -13.73% | -2.58% |
| LULU | Lululemon Athletica | | Consumer Staples | 354.62 | 25 | -1.66% | -2.76% |
| MGA | Magna | | Services & Goods | 47.64 | 10 | -0.33% | -3.01% |
| SVM | Silvercorp Metals | | Materials | 3.21 | 46 | 1.90% | -3.02% |
| BTG | B2Gold | | Materials | 2.54 | 53 | 0.40% | -3.05% |
| PSLV | Sprott Physical | | Financials | 8.95 | 43 | 0.67% | -3.14% |
| PBA | Pembina Pipeline | | Energy | 34.69 | 33 | -1.45% | -3.15% |
| CIGI | Colliers | | Financials | 104.58 | 10 | 0.52% | -3.19% |
| FSI | Flexible | | Materials | 2.12 | 44 | -0.47% | -3.20% |
| BGI | Birks | | Services & Goods | 2.61 | 30 | 8.30% | -3.33% |
| To view more stocks, click on Next / Previous arrows or select different range: 0 - 25 , 25 - 50 , 50 - 75 , 75 - 100 , 100 - 125 , 125 - 150 | ||
 | Click To Change The Sort Order: By Market Cap or Company Size Performance: Year-to-date, Week and Day |  |
| Detailed Overview Of Canada Stocks |
| Canada Technical Overview, Leaders & Laggards, Top Canada ETF Funds & Detailed Canada Stocks List, Charts, Trends & More |
| Canada: Technical Analysis, Trends & YTD Performance | |
 EWC Weekly Chart |
|
| Long Term Trend: Good | |
| Medium Term Trend: Good | |
 EWC Daily Chart |
|
| Short Term Trend: Not Good | |
| Overall Trend Score: 39 | |
| YTD Performance: 0.71% | |
| **Trend Scores & Views Are Only For Educational Purposes And Not For Investing | |
| 12Stocks.com: Investing in Canada Index using Exchange Traded Funds | |
|
The following table shows list of key exchange traded funds (ETF) that
help investors play Canada stock market. For detailed view, check out our ETF Funds section of our website. Quick View: Move mouse or cursor over ETF symbol (ticker) to view short-term technical chart and over ETF name to view long term chart. Click on ticker or stock name for detailed view. Click on to add stock symbol to your watchlist and to view watchlist. |
12Stocks.com List of ETFs that track Canada Index
| Ticker | ETF Name | Watchlist | Recent Price | Market Intelligence Score | Change % | Week % | Year-to-date % |
| EWC | Canada | | 36.94 | 39 | 0.05 | -1.83 | 0.71% |
| 12Stocks.com: Charts, Trends, Fundamental Data and Performances of Canada Stocks | |
|
We now take in-depth look at all Canada stocks including charts, multi-period performances and overall trends (as measured by market intelligence score). One can sort Canada stocks (click link to choose) by Daily, Weekly and by Year-to-Date performances. Also, one can sort by size of the company or by market capitalization. |
| Select Your Default Chart Type: | |||||
| |||||
| Click on stock symbol or name for detailed view. Click on to add stock symbol to your watchlist and to view watchlist. Quick View: Move mouse or cursor over "Daily" to quickly view daily technical stock chart and over "Weekly" to view weekly technical stock chart. | |||||

 | SILV SilverCrest Metals Inc. |
| Sector: Materials | |
| SubSector: Silver | |
| MarketCap: 555.356 Millions | |
| Recent Price: 8.37 Market Intelligence Score: 63 | |
| Day Percent Change: 2.45% Day Change: 0.20 | |
| Week Change: -1.88% Year-to-date Change: 27.8% | |
| SILV Links: Profile News Message Board | |
| Charts:- Daily , Weekly | |
| Add SILV to Watchlist: View: Get Complete SILV Trend Analysis ➞ | |
 | WPM Wheaton Precious Metals Corp. |
| Sector: Materials | |
| SubSector: Silver | |
| MarketCap: 11349.6 Millions | |
| Recent Price: 52.97 Market Intelligence Score: 25 | |
| Day Percent Change: 1.59% Day Change: 0.83 | |
| Week Change: -1.91% Year-to-date Change: 7.4% | |
| WPM Links: Profile News Message Board | |
| Charts:- Daily , Weekly | |
| Add WPM to Watchlist: View: Get Complete WPM Trend Analysis ➞ | |
 | AEM Agnico Eagle Mines Limited |
| Sector: Materials | |
| SubSector: Gold | |
| MarketCap: 9491.49 Millions | |
| Recent Price: 64.24 Market Intelligence Score: 88 | |
| Day Percent Change: 1.40% Day Change: 0.89 | |
| Week Change: -1.95% Year-to-date Change: 17.1% | |
| AEM Links: Profile News Message Board | |
| Charts:- Daily , Weekly | |
| Add AEM to Watchlist: View: Get Complete AEM Trend Analysis ➞ | |
 | CM Canadian Imperial Bank of Commerce |
| Sector: Financials | |
| SubSector: Money Center Banks | |
| MarketCap: 27150.5 Millions | |
| Recent Price: 46.88 Market Intelligence Score: 28 | |
| Day Percent Change: 0.41% Day Change: 0.19 | |
| Week Change: -1.97% Year-to-date Change: -2.6% | |
| CM Links: Profile News Message Board | |
| Charts:- Daily , Weekly | |
| Add CM to Watchlist: View: Get Complete CM Trend Analysis ➞ | |
 | GIL Gildan Activewear Inc. |
| Sector: Consumer Staples | |
| SubSector: Textile - Apparel Clothing | |
| MarketCap: 2411.65 Millions | |
| Recent Price: 34.59 Market Intelligence Score: 23 | |
| Day Percent Change: -0.20% Day Change: -0.07 | |
| Week Change: -2.01% Year-to-date Change: 4.6% | |
| GIL Links: Profile News Message Board | |
| Charts:- Daily , Weekly | |
| Add GIL to Watchlist: View: Get Complete GIL Trend Analysis ➞ | |
 | QBTS D-Wave Quantum Inc. |
| Sector: Technology | |
| SubSector: Computer Hardware | |
| MarketCap: 290 Millions | |
| Recent Price: 1.41 Market Intelligence Score: 15 | |
| Day Percent Change: 2.92% Day Change: 0.04 | |
| Week Change: -2.08% Year-to-date Change: 60.7% | |
| QBTS Links: Profile News Message Board | |
| Charts:- Daily , Weekly | |
| Add QBTS to Watchlist: View: Get Complete QBTS Trend Analysis ➞ | |
 | MOGO Mogo Inc. |
| Sector: Financials | |
| SubSector: Credit Services | |
| MarketCap: 21.9208 Millions | |
| Recent Price: 1.83 Market Intelligence Score: 0 | |
| Day Percent Change: -1.88% Day Change: -0.03 | |
| Week Change: -2.14% Year-to-date Change: -1.1% | |
| MOGO Links: Profile News Message Board | |
| Charts:- Daily , Weekly | |
| Add MOGO to Watchlist: View: Get Complete MOGO Trend Analysis ➞ | |
 | GTE Gran Tierra Energy Inc. |
| Sector: Energy | |
| SubSector: Independent Oil & Gas | |
| MarketCap: 87.0593 Millions | |
| Recent Price: 8.19 Market Intelligence Score: 53 | |
| Day Percent Change: -5.21% Day Change: -0.45 | |
| Week Change: -2.15% Year-to-date Change: 45.2% | |
| GTE Links: Profile News Message Board | |
| Charts:- Daily , Weekly | |
| Add GTE to Watchlist: View: Get Complete GTE Trend Analysis ➞ | |
 | FSV FirstService Corporation |
| Sector: Financials | |
| SubSector: Property Management | |
| MarketCap: 2793.92 Millions | |
| Recent Price: 146.49 Market Intelligence Score: 10 | |
| Day Percent Change: -0.35% Day Change: -0.51 | |
| Week Change: -2.21% Year-to-date Change: -9.6% | |
| FSV Links: Profile News Message Board | |
| Charts:- Daily , Weekly | |
| Add FSV to Watchlist: View: Get Complete FSV Trend Analysis ➞ | |
 | AGI Alamos Gold Inc. |
| Sector: Materials | |
| SubSector: Gold | |
| MarketCap: 1740.39 Millions | |
| Recent Price: 14.96 Market Intelligence Score: 68 | |
| Day Percent Change: 1.70% Day Change: 0.25 | |
| Week Change: -2.22% Year-to-date Change: 11.1% | |
| AGI Links: Profile News Message Board | |
| Charts:- Daily , Weekly | |
| Add AGI to Watchlist: View: Get Complete AGI Trend Analysis ➞ | |
 | DOOO BRP Inc. |
| Sector: Consumer Staples | |
| SubSector: Recreational Vehicles | |
| MarketCap: 638.559 Millions | |
| Recent Price: 67.20 Market Intelligence Score: 46 | |
| Day Percent Change: -0.10% Day Change: -0.07 | |
| Week Change: -2.24% Year-to-date Change: -6.3% | |
| DOOO Links: Profile News Message Board | |
| Charts:- Daily , Weekly | |
| Add DOOO to Watchlist: View: Get Complete DOOO Trend Analysis ➞ | |
 | PAAS Pan American Silver Corp. |
| Sector: Materials | |
| SubSector: Silver | |
| MarketCap: 2832.56 Millions | |
| Recent Price: 18.57 Market Intelligence Score: 65 | |
| Day Percent Change: 0.70% Day Change: 0.13 | |
| Week Change: -2.37% Year-to-date Change: 13.7% | |
| PAAS Links: Profile News Message Board | |
| Charts:- Daily , Weekly | |
| Add PAAS to Watchlist: View: Get Complete PAAS Trend Analysis ➞ | |
 | TMQ Trilogy Metals Inc. |
| Sector: Materials | |
| SubSector: Industrial Metals & Minerals | |
| MarketCap: 151.21 Millions | |
| Recent Price: 0.40 Market Intelligence Score: 0 | |
| Day Percent Change: -0.52% Day Change: 0.00 | |
| Week Change: -2.41% Year-to-date Change: -7.0% | |
| TMQ Links: Profile News Message Board | |
| Charts:- Daily , Weekly | |
| Add TMQ to Watchlist: View: Get Complete TMQ Trend Analysis ➞ | |
 | RBA Ritchie Bros. Auctioneers Incorporated |
| Sector: Services & Goods | |
| SubSector: Business Services | |
| MarketCap: 3491.02 Millions | |
| Recent Price: 71.37 Market Intelligence Score: 0 | |
| Day Percent Change: -0.29% Day Change: -0.21 | |
| Week Change: -2.47% Year-to-date Change: 6.7% | |
| RBA Links: Profile News Message Board | |
| Charts:- Daily , Weekly | |
| Add RBA to Watchlist: View: Get Complete RBA Trend Analysis ➞ | |
 | ASTL Algoma Steel Group Inc. |
| Sector: Materials | |
| SubSector: Steel | |
| MarketCap: 731 Millions | |
| Recent Price: 7.66 Market Intelligence Score: 10 | |
| Day Percent Change: 0.13% Day Change: 0.01 | |
| Week Change: -2.48% Year-to-date Change: -23.3% | |
| ASTL Links: Profile News Message Board | |
| Charts:- Daily , Weekly | |
| Add ASTL to Watchlist: View: Get Complete ASTL Trend Analysis ➞ | |
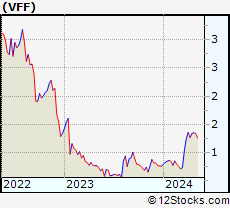 | VFF Village Farms International, Inc. |
| Sector: Consumer Staples | |
| SubSector: Farm Products | |
| MarketCap: 125.287 Millions | |
| Recent Price: 1.32 Market Intelligence Score: 95 | |
| Day Percent Change: -13.73% Day Change: -0.21 | |
| Week Change: -2.58% Year-to-date Change: 73.5% | |
| VFF Links: Profile News Message Board | |
| Charts:- Daily , Weekly | |
| Add VFF to Watchlist: View: Get Complete VFF Trend Analysis ➞ | |
 | LULU Lululemon Athletica Inc. |
| Sector: Consumer Staples | |
| SubSector: Textile - Apparel Clothing | |
| MarketCap: 24627.8 Millions | |
| Recent Price: 354.62 Market Intelligence Score: 25 | |
| Day Percent Change: -1.66% Day Change: -5.98 | |
| Week Change: -2.76% Year-to-date Change: -30.6% | |
| LULU Links: Profile News Message Board | |
| Charts:- Daily , Weekly | |
| Add LULU to Watchlist: View: Get Complete LULU Trend Analysis ➞ | |
 | MGA Magna International Inc. |
| Sector: Services & Goods | |
| SubSector: Auto Parts Wholesale | |
| MarketCap: 8967.3 Millions | |
| Recent Price: 47.64 Market Intelligence Score: 10 | |
| Day Percent Change: -0.33% Day Change: -0.16 | |
| Week Change: -3.01% Year-to-date Change: -19.4% | |
| MGA Links: Profile News Message Board | |
| Charts:- Daily , Weekly | |
| Add MGA to Watchlist: View: Get Complete MGA Trend Analysis ➞ | |
 | SVM Silvercorp Metals Inc. |
| Sector: Materials | |
| SubSector: Silver | |
| MarketCap: 504.056 Millions | |
| Recent Price: 3.21 Market Intelligence Score: 46 | |
| Day Percent Change: 1.90% Day Change: 0.06 | |
| Week Change: -3.02% Year-to-date Change: 22.1% | |
| SVM Links: Profile News Message Board | |
| Charts:- Daily , Weekly | |
| Add SVM to Watchlist: View: Get Complete SVM Trend Analysis ➞ | |
 | BTG B2Gold Corp. |
| Sector: Materials | |
| SubSector: Gold | |
| MarketCap: 2792.39 Millions | |
| Recent Price: 2.54 Market Intelligence Score: 53 | |
| Day Percent Change: 0.40% Day Change: 0.01 | |
| Week Change: -3.05% Year-to-date Change: -19.6% | |
| BTG Links: Profile News Message Board | |
| Charts:- Daily , Weekly | |
| Add BTG to Watchlist: View: Get Complete BTG Trend Analysis ➞ | |
 | PSLV Sprott Physical Silver Trust |
| Sector: Financials | |
| SubSector: Exchange Traded Fund | |
| MarketCap: 765.851 Millions | |
| Recent Price: 8.95 Market Intelligence Score: 43 | |
| Day Percent Change: 0.67% Day Change: 0.06 | |
| Week Change: -3.14% Year-to-date Change: 10.8% | |
| PSLV Links: Profile News Message Board | |
| Charts:- Daily , Weekly | |
| Add PSLV to Watchlist: View: Get Complete PSLV Trend Analysis ➞ | |
 | PBA Pembina Pipeline Corporation |
| Sector: Energy | |
| SubSector: Oil & Gas Pipelines | |
| MarketCap: 8813.35 Millions | |
| Recent Price: 34.69 Market Intelligence Score: 33 | |
| Day Percent Change: -1.45% Day Change: -0.51 | |
| Week Change: -3.15% Year-to-date Change: 0.8% | |
| PBA Links: Profile News Message Board | |
| Charts:- Daily , Weekly | |
| Add PBA to Watchlist: View: Get Complete PBA Trend Analysis ➞ | |
 | CIGI Colliers International Group Inc. |
| Sector: Financials | |
| SubSector: Property Management | |
| MarketCap: 1928.42 Millions | |
| Recent Price: 104.58 Market Intelligence Score: 10 | |
| Day Percent Change: 0.52% Day Change: 0.54 | |
| Week Change: -3.19% Year-to-date Change: -17.3% | |
| CIGI Links: Profile News Message Board | |
| Charts:- Daily , Weekly | |
| Add CIGI to Watchlist: View: Get Complete CIGI Trend Analysis ➞ | |
 | FSI Flexible Solutions International Inc. |
| Sector: Materials | |
| SubSector: Specialty Chemicals | |
| MarketCap: 14.3357 Millions | |
| Recent Price: 2.12 Market Intelligence Score: 44 | |
| Day Percent Change: -0.47% Day Change: -0.01 | |
| Week Change: -3.2% Year-to-date Change: 11.0% | |
| FSI Links: Profile News Message Board | |
| Charts:- Daily , Weekly | |
| Add FSI to Watchlist: View: Get Complete FSI Trend Analysis ➞ | |
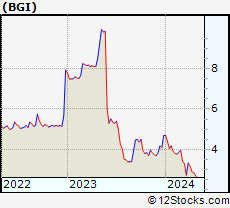 | BGI Birks Group Inc. |
| Sector: Services & Goods | |
| SubSector: Jewelry Stores | |
| MarketCap: 9 Millions | |
| Recent Price: 2.61 Market Intelligence Score: 30 | |
| Day Percent Change: 8.30% Day Change: 0.20 | |
| Week Change: -3.33% Year-to-date Change: -44.4% | |
| BGI Links: Profile News Message Board | |
| Charts:- Daily , Weekly | |
| Add BGI to Watchlist: View: Get Complete BGI Trend Analysis ➞ | |
| To view more stocks, click on Next / Previous arrows or select different range: 0 - 25 , 25 - 50 , 50 - 75 , 75 - 100 , 100 - 125 , 125 - 150 | ||
| Click To Change The Sort Order: By Market Cap or Company Size Performance: Year-to-date, Week and Day | |
| Select Chart Type: | ||
 Best Stocks Today 12Stocks.com |
© 2024 12Stocks.com Terms & Conditions Privacy Contact Us
All Information Provided Only For Education And Not To Be Used For Investing or Trading. See Terms & Conditions


One More Thing ... Get Best Stocks Delivered Daily!
Never Ever Miss A Move With Our Top Ten Stocks Lists
Find Best Stocks In Any Market - Bull or Bear Market
Take A Peek At Our Top Ten Stocks Lists: Daily, Weekly, Year-to-Date & Top Trends
Find Best Stocks In Any Market - Bull or Bear Market
Take A Peek At Our Top Ten Stocks Lists: Daily, Weekly, Year-to-Date & Top Trends
Canada Stocks With Best Up Trends [0-bearish to 100-bullish]: Brookfield Renewable[100], New Gold[100], CAE [100], Descartes Systems[100], Mercer [100], City Office[100], Algonquin Power[95], Sandstorm Gold[95], Tilray [95], Fortuna Silver[88], Agnico Eagle[88]
Best Canada Stocks Year-to-Date:
Aurora Cannabis[1443.47%], Canopy Growth[124.27%], Fusion [123.13%], D-Wave Quantum[60.7%], McEwen Mining[60.19%], Hudbay Minerals[50.91%], OrganiGram [45.8%], IAMGOLD [43.08%], Gold Royalty[39.79%], Endeavour Silver[35.53%], Cronos [30.14%] Best Canada Stocks This Week:
Canopy Growth[28.62%], Tilray [12.92%], Aurora Cannabis[9.7%], Brookfield Renewable[9.18%], Canadian Solar[7.92%], Xenon [6.16%], Zymeworks [6.05%], Aurinia [6.01%], Cronos [5.02%], New Gold[4.42%], Repare [4.38%] Best Canada Stocks Daily:
Brookfield Renewable[10.90%], New Gold[8.62%], Repare [7.74%], NovaGold Resources[4.48%], Lion Electric[4.44%], Fortuna Silver[3.30%], Denison Mines[3.03%], D-Wave Quantum[2.92%], Cameco [2.83%], SilverCrest Metals[2.45%], Algonquin Power[2.29%]