
 Login Sign Up


| |||||
 |  | ||||

| 12Stocks.com Market Intelligence |
Best Canada Stocks
|
|
| Quick Read: Top Canada Stocks By Performances & Trends: Daily, Weekly, Year-to-Date, Market Cap (Size) & Technical Trends | |||
| Best Canada Views: Quick Browse View, Summary & Slide Show | |||
| 12Stocks.com Canada Stocks Performances & Trends Daily | |||||||||
|
|  The overall market intelligence score is 46 (0-bearish to 100-bullish) which puts Canada index in short term neutral trend. The market intelligence score from previous trading session is 90 and hence a deterioration of trend.
| ||||||||
Here are the market intelligence trend scores of the most requested Canada stocks at 12Stocks.com (click stock name for detailed review):
| |||||||||||||||||
| Scroll down this page for most comprehensive review of Canada stocks by performance, trends, technical analysis, charts, fund plays & more | |||||||||||||||||


| 12Stocks.com: Top Performing Canada Index Stocks | ||||||||||||||||||||||||||||||||||||||||||||||||
 The top performing Canada Index stocks year to date are
Now, more recently, over last week, the top performing Canada Index stocks on the move are


|
||||||||||||||||||||||||||||||||||||||||||||||||
| 12Stocks.com: Investing in Canada Index with Stocks | |
|
The following table helps investors and traders sort through current performance and trends (as measured by market intelligence score) of various
stocks in the Canada Index. Quick View: Move mouse or cursor over stock symbol (ticker) to view short-term technical chart and over stock name to view long term chart. Click on  to add stock symbol to your watchlist and to add stock symbol to your watchlist and  to view watchlist. Click on any ticker or stock name for detailed market intelligence report for that stock. to view watchlist. Click on any ticker or stock name for detailed market intelligence report for that stock. |
12Stocks.com Performance of Stocks in Canada Index
| Ticker | Stock Name | Watchlist | Category | Recent Price | Market Intelligence Score | Change % | Weekly Change% |
| OTEX | Open Text |   | Technology | 35.31 | 25 | -0.51% | -1.04% |
| ACST | Acasti Pharma | | Health Care | 2.78 | 43 | 3.73% | -1.07% |
| LULU | Lululemon Athletica | | Consumer Staples | 360.60 | 40 | -0.92% | -1.12% |
| SLF | Sun Life | | Financials | 51.04 | 22 | -1.10% | -1.22% |
| RCI | | Technology | 37.47 | 17 | -1.86% | -1.29% | |
| RY | Royal Bank | | Financials | 96.83 | 10 | -1.18% | -1.35% |
| NG | NovaGold Resources | | Materials | 2.90 | 53 | -5.23% | -1.36% |
| BB | BlackBerry | | Technology | 2.79 | 30 | -2.45% | -1.41% |
| BNS | Bank of Nova | | Financials | 45.90 | 18 | -1.16% | -1.42% |
| TFPM | Triple Flag | | Materials | 16.11 | 71 | -2.89% | -1.53% |
| DSGX | Descartes Systems | | Technology | 92.79 | 58 | -1.05% | -1.54% |
| BEP | Brookfield Renewable | | Utilities | 21.01 | 25 | -1.73% | -1.55% |
| TCX | Tucows | | Technology | 17.67 | 27 | -1.56% | -1.56% |
| SHOP | Shopify | | Technology | 70.20 | 32 | -3.15% | -1.58% |
| BLCO | Bausch + | | Health Care | 14.54 | 48 | -3.84% | -1.69% |
| PBA | Pembina Pipeline | | Energy | 35.20 | 51 | -2.44% | -1.73% |
| BMO | Bank of Montreal | | Financials | 89.32 | 0 | -1.01% | -1.75% |
| NOA | Construction | | Energy | 21.68 | 40 | -2.12% | -1.77% |
| GIL | Gildan Activewear | | Consumer Staples | 34.66 | 31 | -2.17% | -1.81% |
| GIB | CGI | | Technology | 101.22 | 0 | -0.90% | -1.86% |
| FSV | Service | | Financials | 147.00 | 0 | -1.46% | -1.87% |
| TMQ | Trilogy Metals | | Materials | 0.40 | 0 | -1.30% | -1.90% |
| FNV | Franco-Nevada | | Materials | 120.40 | 58 | -2.41% | -2.06% |
| STKL | SunOpta | | Consumer Staples | 6.55 | 58 | -1.50% | -2.09% |
| DOOO | BRP | | Consumer Staples | 67.27 | 36 | -3.07% | -2.14% |
| To view more stocks, click on Next / Previous arrows or select different range: 0 - 25 , 25 - 50 , 50 - 75 , 75 - 100 , 100 - 125 , 125 - 150 | ||
 | Click To Change The Sort Order: By Market Cap or Company Size Performance: Year-to-date, Week and Day |  |
| Detailed Overview Of Canada Stocks |
| Canada Technical Overview, Leaders & Laggards, Top Canada ETF Funds & Detailed Canada Stocks List, Charts, Trends & More |
| Canada: Technical Analysis, Trends & YTD Performance | |
 EWC Weekly Chart |
|
| Long Term Trend: Very Good | |
| Medium Term Trend: Not Good | |
 EWC Daily Chart |
|
| Short Term Trend: Not Good | |
| Overall Trend Score: 46 | |
| YTD Performance: 0.65% | |
| **Trend Scores & Views Are Only For Educational Purposes And Not For Investing | |
| 12Stocks.com: Investing in Canada Index using Exchange Traded Funds | |
|
The following table shows list of key exchange traded funds (ETF) that
help investors play Canada stock market. For detailed view, check out our ETF Funds section of our website. Quick View: Move mouse or cursor over ETF symbol (ticker) to view short-term technical chart and over ETF name to view long term chart. Click on ticker or stock name for detailed view. Click on to add stock symbol to your watchlist and to view watchlist. |
12Stocks.com List of ETFs that track Canada Index
| Ticker | ETF Name | Watchlist | Recent Price | Market Intelligence Score | Change % | Week % | Year-to-date % |
| EWC | Canada | | 36.92 | 46 | -2.02 | -1.89 | 0.65% |
| 12Stocks.com: Charts, Trends, Fundamental Data and Performances of Canada Stocks | |
|
We now take in-depth look at all Canada stocks including charts, multi-period performances and overall trends (as measured by market intelligence score). One can sort Canada stocks (click link to choose) by Daily, Weekly and by Year-to-Date performances. Also, one can sort by size of the company or by market capitalization. |
| Select Your Default Chart Type: | |||||
| |||||
| Click on stock symbol or name for detailed view. Click on to add stock symbol to your watchlist and to view watchlist. Quick View: Move mouse or cursor over "Daily" to quickly view daily technical stock chart and over "Weekly" to view weekly technical stock chart. | |||||

 | OTEX Open Text Corporation |
| Sector: Technology | |
| SubSector: Application Software | |
| MarketCap: 9291.92 Millions | |
| Recent Price: 35.31 Market Intelligence Score: 25 | |
| Day Percent Change: -0.51% Day Change: -0.18 | |
| Week Change: -1.04% Year-to-date Change: -16.0% | |
| OTEX Links: Profile News Message Board | |
| Charts:- Daily , Weekly | |
| Add OTEX to Watchlist: View: Get Complete OTEX Trend Analysis ➞ | |
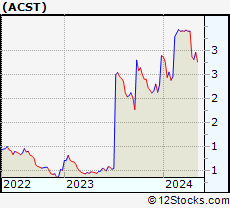 | ACST Acasti Pharma Inc. |
| Sector: Health Care | |
| SubSector: Biotechnology | |
| MarketCap: 28.2785 Millions | |
| Recent Price: 2.78 Market Intelligence Score: 43 | |
| Day Percent Change: 3.73% Day Change: 0.10 | |
| Week Change: -1.07% Year-to-date Change: -3.8% | |
| ACST Links: Profile News Message Board | |
| Charts:- Daily , Weekly | |
| Add ACST to Watchlist: View: Get Complete ACST Trend Analysis ➞ | |
 | LULU Lululemon Athletica Inc. |
| Sector: Consumer Staples | |
| SubSector: Textile - Apparel Clothing | |
| MarketCap: 24627.8 Millions | |
| Recent Price: 360.60 Market Intelligence Score: 40 | |
| Day Percent Change: -0.92% Day Change: -3.36 | |
| Week Change: -1.12% Year-to-date Change: -29.5% | |
| LULU Links: Profile News Message Board | |
| Charts:- Daily , Weekly | |
| Add LULU to Watchlist: View: Get Complete LULU Trend Analysis ➞ | |
 | SLF Sun Life Financial Inc. |
| Sector: Financials | |
| SubSector: Property & Casualty Insurance | |
| MarketCap: 17722 Millions | |
| Recent Price: 51.04 Market Intelligence Score: 22 | |
| Day Percent Change: -1.10% Day Change: -0.57 | |
| Week Change: -1.22% Year-to-date Change: -1.6% | |
| SLF Links: Profile News Message Board | |
| Charts:- Daily , Weekly | |
| Add SLF to Watchlist: View: Get Complete SLF Trend Analysis ➞ | |
 | RCI Rogers Communications Inc. |
| Sector: Technology | |
| SubSector: Wireless Communications | |
| MarketCap: 22111.6 Millions | |
| Recent Price: 37.47 Market Intelligence Score: 17 | |
| Day Percent Change: -1.86% Day Change: -0.71 | |
| Week Change: -1.29% Year-to-date Change: -20.0% | |
| RCI Links: Profile News Message Board | |
| Charts:- Daily , Weekly | |
| Add RCI to Watchlist: View: Get Complete RCI Trend Analysis ➞ | |
 | RY Royal Bank of Canada |
| Sector: Financials | |
| SubSector: Money Center Banks | |
| MarketCap: 87565.4 Millions | |
| Recent Price: 96.83 Market Intelligence Score: 10 | |
| Day Percent Change: -1.18% Day Change: -1.16 | |
| Week Change: -1.35% Year-to-date Change: -4.3% | |
| RY Links: Profile News Message Board | |
| Charts:- Daily , Weekly | |
| Add RY to Watchlist: View: Get Complete RY Trend Analysis ➞ | |
 | NG NovaGold Resources Inc. |
| Sector: Materials | |
| SubSector: Gold | |
| MarketCap: 2499.49 Millions | |
| Recent Price: 2.90 Market Intelligence Score: 53 | |
| Day Percent Change: -5.23% Day Change: -0.16 | |
| Week Change: -1.36% Year-to-date Change: -22.5% | |
| NG Links: Profile News Message Board | |
| Charts:- Daily , Weekly | |
| Add NG to Watchlist: View: Get Complete NG Trend Analysis ➞ | |
 | BB BlackBerry Limited |
| Sector: Technology | |
| SubSector: Communication Equipment | |
| MarketCap: 2100.39 Millions | |
| Recent Price: 2.79 Market Intelligence Score: 30 | |
| Day Percent Change: -2.45% Day Change: -0.07 | |
| Week Change: -1.41% Year-to-date Change: -21.2% | |
| BB Links: Profile News Message Board | |
| Charts:- Daily , Weekly | |
| Add BB to Watchlist: View: Get Complete BB Trend Analysis ➞ | |
 | BNS The Bank of Nova Scotia |
| Sector: Financials | |
| SubSector: Money Center Banks | |
| MarketCap: 48742.1 Millions | |
| Recent Price: 45.90 Market Intelligence Score: 18 | |
| Day Percent Change: -1.16% Day Change: -0.54 | |
| Week Change: -1.42% Year-to-date Change: -5.7% | |
| BNS Links: Profile News Message Board | |
| Charts:- Daily , Weekly | |
| Add BNS to Watchlist: View: Get Complete BNS Trend Analysis ➞ | |
 | TFPM Triple Flag Precious Metals Corp. |
| Sector: Materials | |
| SubSector: Other Precious Metals & Mining | |
| MarketCap: 3640 Millions | |
| Recent Price: 16.11 Market Intelligence Score: 71 | |
| Day Percent Change: -2.89% Day Change: -0.48 | |
| Week Change: -1.53% Year-to-date Change: 21.7% | |
| TFPM Links: Profile News Message Board | |
| Charts:- Daily , Weekly | |
| Add TFPM to Watchlist: View: Get Complete TFPM Trend Analysis ➞ | |
 | DSGX The Descartes Systems Group Inc |
| Sector: Technology | |
| SubSector: Business Software & Services | |
| MarketCap: 2830.58 Millions | |
| Recent Price: 92.79 Market Intelligence Score: 58 | |
| Day Percent Change: -1.05% Day Change: -0.98 | |
| Week Change: -1.54% Year-to-date Change: 10.4% | |
| DSGX Links: Profile News Message Board | |
| Charts:- Daily , Weekly | |
| Add DSGX to Watchlist: View: Get Complete DSGX Trend Analysis ➞ | |
 | BEP Brookfield Renewable Partners L.P. |
| Sector: Utilities | |
| SubSector: Diversified Utilities | |
| MarketCap: 6419.9 Millions | |
| Recent Price: 21.01 Market Intelligence Score: 25 | |
| Day Percent Change: -1.73% Day Change: -0.37 | |
| Week Change: -1.55% Year-to-date Change: -20.1% | |
| BEP Links: Profile News Message Board | |
| Charts:- Daily , Weekly | |
| Add BEP to Watchlist: View: Get Complete BEP Trend Analysis ➞ | |
 | TCX Tucows Inc. |
| Sector: Technology | |
| SubSector: Internet Information Providers | |
| MarketCap: 557.78 Millions | |
| Recent Price: 17.67 Market Intelligence Score: 27 | |
| Day Percent Change: -1.56% Day Change: -0.28 | |
| Week Change: -1.56% Year-to-date Change: -34.6% | |
| TCX Links: Profile News Message Board | |
| Charts:- Daily , Weekly | |
| Add TCX to Watchlist: View: Get Complete TCX Trend Analysis ➞ | |
 | SHOP Shopify Inc. |
| Sector: Technology | |
| SubSector: Application Software | |
| MarketCap: 45164.2 Millions | |
| Recent Price: 70.20 Market Intelligence Score: 32 | |
| Day Percent Change: -3.15% Day Change: -2.28 | |
| Week Change: -1.58% Year-to-date Change: -9.9% | |
| SHOP Links: Profile News Message Board | |
| Charts:- Daily , Weekly | |
| Add SHOP to Watchlist: View: Get Complete SHOP Trend Analysis ➞ | |
 | BLCO Bausch + Lomb Corporation |
| Sector: Health Care | |
| SubSector: Medical Instruments & Supplies | |
| MarketCap: 7100 Millions | |
| Recent Price: 14.54 Market Intelligence Score: 48 | |
| Day Percent Change: -3.84% Day Change: -0.58 | |
| Week Change: -1.69% Year-to-date Change: -14.5% | |
| BLCO Links: Profile News Message Board | |
| Charts:- Daily , Weekly | |
| Add BLCO to Watchlist: View: Get Complete BLCO Trend Analysis ➞ | |
 | PBA Pembina Pipeline Corporation |
| Sector: Energy | |
| SubSector: Oil & Gas Pipelines | |
| MarketCap: 8813.35 Millions | |
| Recent Price: 35.20 Market Intelligence Score: 51 | |
| Day Percent Change: -2.44% Day Change: -0.88 | |
| Week Change: -1.73% Year-to-date Change: 2.3% | |
| PBA Links: Profile News Message Board | |
| Charts:- Daily , Weekly | |
| Add PBA to Watchlist: View: Get Complete PBA Trend Analysis ➞ | |
 | BMO Bank of Montreal |
| Sector: Financials | |
| SubSector: Money Center Banks | |
| MarketCap: 32830.2 Millions | |
| Recent Price: 89.32 Market Intelligence Score: 0 | |
| Day Percent Change: -1.01% Day Change: -0.91 | |
| Week Change: -1.75% Year-to-date Change: -9.7% | |
| BMO Links: Profile News Message Board | |
| Charts:- Daily , Weekly | |
| Add BMO to Watchlist: View: Get Complete BMO Trend Analysis ➞ | |
 | NOA North American Construction Group Ltd. |
| Sector: Energy | |
| SubSector: Oil & Gas Equipment & Services | |
| MarketCap: 160.461 Millions | |
| Recent Price: 21.68 Market Intelligence Score: 40 | |
| Day Percent Change: -2.12% Day Change: -0.47 | |
| Week Change: -1.77% Year-to-date Change: 4.0% | |
| NOA Links: Profile News Message Board | |
| Charts:- Daily , Weekly | |
| Add NOA to Watchlist: View: Get Complete NOA Trend Analysis ➞ | |
 | GIL Gildan Activewear Inc. |
| Sector: Consumer Staples | |
| SubSector: Textile - Apparel Clothing | |
| MarketCap: 2411.65 Millions | |
| Recent Price: 34.66 Market Intelligence Score: 31 | |
| Day Percent Change: -2.17% Day Change: -0.77 | |
| Week Change: -1.81% Year-to-date Change: 4.8% | |
| GIL Links: Profile News Message Board | |
| Charts:- Daily , Weekly | |
| Add GIL to Watchlist: View: Get Complete GIL Trend Analysis ➞ | |
 | GIB CGI Inc. |
| Sector: Technology | |
| SubSector: Information Technology Services | |
| MarketCap: 13185.3 Millions | |
| Recent Price: 101.22 Market Intelligence Score: 0 | |
| Day Percent Change: -0.90% Day Change: -0.92 | |
| Week Change: -1.86% Year-to-date Change: -5.6% | |
| GIB Links: Profile News Message Board | |
| Charts:- Daily , Weekly | |
| Add GIB to Watchlist: View: Get Complete GIB Trend Analysis ➞ | |
 | FSV FirstService Corporation |
| Sector: Financials | |
| SubSector: Property Management | |
| MarketCap: 2793.92 Millions | |
| Recent Price: 147.00 Market Intelligence Score: 0 | |
| Day Percent Change: -1.46% Day Change: -2.18 | |
| Week Change: -1.87% Year-to-date Change: -9.3% | |
| FSV Links: Profile News Message Board | |
| Charts:- Daily , Weekly | |
| Add FSV to Watchlist: View: Get Complete FSV Trend Analysis ➞ | |
 | TMQ Trilogy Metals Inc. |
| Sector: Materials | |
| SubSector: Industrial Metals & Minerals | |
| MarketCap: 151.21 Millions | |
| Recent Price: 0.40 Market Intelligence Score: 0 | |
| Day Percent Change: -1.30% Day Change: -0.01 | |
| Week Change: -1.9% Year-to-date Change: -6.5% | |
| TMQ Links: Profile News Message Board | |
| Charts:- Daily , Weekly | |
| Add TMQ to Watchlist: View: Get Complete TMQ Trend Analysis ➞ | |
 | FNV Franco-Nevada Corporation |
| Sector: Materials | |
| SubSector: Gold | |
| MarketCap: 17703.9 Millions | |
| Recent Price: 120.40 Market Intelligence Score: 58 | |
| Day Percent Change: -2.41% Day Change: -2.97 | |
| Week Change: -2.06% Year-to-date Change: 8.7% | |
| FNV Links: Profile News Message Board | |
| Charts:- Daily , Weekly | |
| Add FNV to Watchlist: View: Get Complete FNV Trend Analysis ➞ | |
 | STKL SunOpta Inc. |
| Sector: Consumer Staples | |
| SubSector: Processed & Packaged Goods | |
| MarketCap: 174.548 Millions | |
| Recent Price: 6.55 Market Intelligence Score: 58 | |
| Day Percent Change: -1.50% Day Change: -0.10 | |
| Week Change: -2.09% Year-to-date Change: 19.7% | |
| STKL Links: Profile News Message Board | |
| Charts:- Daily , Weekly | |
| Add STKL to Watchlist: View: Get Complete STKL Trend Analysis ➞ | |
 | DOOO BRP Inc. |
| Sector: Consumer Staples | |
| SubSector: Recreational Vehicles | |
| MarketCap: 638.559 Millions | |
| Recent Price: 67.27 Market Intelligence Score: 36 | |
| Day Percent Change: -3.07% Day Change: -2.13 | |
| Week Change: -2.14% Year-to-date Change: -6.2% | |
| DOOO Links: Profile News Message Board | |
| Charts:- Daily , Weekly | |
| Add DOOO to Watchlist: View: Get Complete DOOO Trend Analysis ➞ | |
| To view more stocks, click on Next / Previous arrows or select different range: 0 - 25 , 25 - 50 , 50 - 75 , 75 - 100 , 100 - 125 , 125 - 150 | ||
| Click To Change The Sort Order: By Market Cap or Company Size Performance: Year-to-date, Week and Day | |
| Select Chart Type: | ||
 Best Stocks Today 12Stocks.com |
© 2024 12Stocks.com Terms & Conditions Privacy Contact Us
All Information Provided Only For Education And Not To Be Used For Investing or Trading. See Terms & Conditions


One More Thing ... Get Best Stocks Delivered Daily!
Never Ever Miss A Move With Our Top Ten Stocks Lists
Find Best Stocks In Any Market - Bull or Bear Market
Take A Peek At Our Top Ten Stocks Lists: Daily, Weekly, Year-to-Date & Top Trends
Find Best Stocks In Any Market - Bull or Bear Market
Take A Peek At Our Top Ten Stocks Lists: Daily, Weekly, Year-to-Date & Top Trends
Canada Stocks With Best Up Trends [0-bearish to 100-bullish]: Canopy Growth[100], Aurora Cannabis[100], Cronos [100], Tilray [95], OrganiGram [90], Hudbay Minerals[78], Canadian Solar[74], Milestone [73], Triple Flag[71], Bausch Health[70], Fusion [68]
Best Canada Stocks Year-to-Date:
Aurora Cannabis[1838.26%], Canopy Growth[191.19%], Fusion [123.23%], OrganiGram [61.83%], McEwen Mining[58.95%], D-Wave Quantum[56.14%], Hudbay Minerals[52.54%], IAMGOLD [40.71%], Cronos [40.67%], Gold Royalty[40.48%], Endeavour Silver[33.5%] Best Canada Stocks This Week:
Canopy Growth[67%], Tilray [38.76%], Aurora Cannabis[37.76%], OrganiGram [13.98%], Cronos [13.51%], Milestone [7.79%], Canadian Solar[7%], Xenon [4.2%], Zymeworks [3.87%], Aurinia [3.67%], Northern Dynasty[2.88%] Best Canada Stocks Daily:
Canopy Growth[78.85%], Aurora Cannabis[46.04%], Tilray [38.76%], Cronos [15.29%], OrganiGram [13.37%], Milestone [5.73%], Zymeworks [3.00%], Restaurant Brands[2.72%], Aurinia [1.60%], TransAlta [0.61%], Northern Dynasty[0.46%]