
 Login Sign Up


| |||||
 |  | ||||

| 12Stocks.com Market Intelligence |
Best Canada Stocks
|
|
| Quick Read: Top Canada Stocks By Performances & Trends: Daily, Weekly, Year-to-Date, Market Cap (Size) & Technical Trends | |||
| Best Canada Views: Quick Browse View, Summary & Slide Show | |||
| 12Stocks.com Canada Stocks Performances & Trends Daily | |||||||||
|
|  The overall market intelligence score is 78 (0-bearish to 100-bullish) which puts Canada index in short term neutral to bullish trend. The market intelligence score from previous trading session is 56 and hence an improvement of trend.
| ||||||||
Here are the market intelligence trend scores of the most requested Canada stocks at 12Stocks.com (click stock name for detailed review):
| |||||||||||||||||
| Scroll down this page for most comprehensive review of Canada stocks by performance, trends, technical analysis, charts, fund plays & more | |||||||||||||||||


| 12Stocks.com: Top Performing Canada Index Stocks | ||||||||||||||||||||||||||||||||||||||||||||||||
 The top performing Canada Index stocks year to date are
Now, more recently, over last week, the top performing Canada Index stocks on the move are


|
||||||||||||||||||||||||||||||||||||||||||||||||
| 12Stocks.com: Investing in Canada Index with Stocks | |
|
The following table helps investors and traders sort through current performance and trends (as measured by market intelligence score) of various
stocks in the Canada Index. Quick View: Move mouse or cursor over stock symbol (ticker) to view short-term technical chart and over stock name to view long term chart. Click on  to add stock symbol to your watchlist and to add stock symbol to your watchlist and  to view watchlist. Click on any ticker or stock name for detailed market intelligence report for that stock. to view watchlist. Click on any ticker or stock name for detailed market intelligence report for that stock. |
12Stocks.com Performance of Stocks in Canada Index
| Ticker | Stock Name | Watchlist | Category | Recent Price | Market Intelligence Score | Change % | YTD Change% |
| FNV | Franco-Nevada |   | Materials | 123.25 | 95 | 1.94 | 11.23% |
| EMX | EMX Royalty | | Materials | 1.86 | 61 | 1.92 | 14.51% |
| BCE | BCE | | Technology | 33.60 | 74 | 1.85 | -14.68% |
| QBTS | D-Wave Quantum | | Technology | 1.41 | 37 | 1.81 | 60.13% |
| XENE | Xenon | | Health Care | 43.75 | 64 | 1.74 | -5.02% |
| TECK | Teck Resources | | Materials | 49.29 | 83 | 1.73 | 16.61% |
| PDS | Precision Drilling | | Energy | 71.12 | 75 | 1.72 | 31.00% |
| CIO | City Office | | Financials | 4.84 | 100 | 1.68 | -20.79% |
| TFII | TFI | | Transports | 134.52 | 32 | 1.62 | -1.07% |
| GIB | CGI | | Technology | 103.68 | 50 | 1.54 | -3.29% |
| BMO | Bank of Montreal | | Financials | 91.23 | 63 | 1.49 | -7.79% |
| RBA | Ritchie Bros. | | Services & Goods | 72.24 | 32 | 1.47 | 8.00% |
| BAM | Brookfield Asset | | Financials | 39.13 | 40 | 1.45 | -2.59% |
| CSIQ | Canadian Solar | | Technology | 16.79 | 74 | 1.39 | -35.99% |
| CAE | CAE | | Industrials | 20.47 | 100 | 1.39 | -5.19% |
| RCI | | Technology | 38.43 | 42 | 1.37 | -17.90% | |
| DOOO | BRP | | Consumer Staples | 68.90 | 68 | 1.31 | -3.89% |
| MFC | Manulife Financial | | Financials | 24.01 | 95 | 1.31 | 8.64% |
| CNI | Canadian National | | Transports | 123.54 | 32 | 1.30 | -1.66% |
| MUX | McEwen Mining | | Materials | 11.76 | 83 | 1.29 | 63.11% |
| BLCO | Bausch + | | Health Care | 13.59 | 7 | 1.27 | -20.06% |
| LULU | Lululemon Athletica | | Consumer Staples | 355.15 | 25 | 1.24 | -30.54% |
| CM | Canadian Imperial | | Financials | 47.88 | 71 | 1.20 | -0.54% |
| BNS | Bank of Nova | | Financials | 46.85 | 37 | 1.19 | -3.78% |
| DCBO | Docebo | | Technology | 45.64 | 42 | 1.11 | -5.72% |
| To view more stocks, click on Next / Previous arrows or select different range: 0 - 25 , 25 - 50 , 50 - 75 , 75 - 100 , 100 - 125 , 125 - 150 | ||
 | Click To Change The Sort Order: By Market Cap or Company Size Performance: Year-to-date, Week and Day |  |
| Detailed Overview Of Canada Stocks |
| Canada Technical Overview, Leaders & Laggards, Top Canada ETF Funds & Detailed Canada Stocks List, Charts, Trends & More |
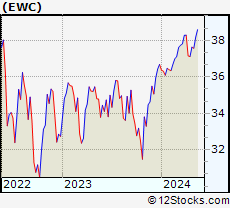
| Canada: Technical Analysis, Trends & YTD Performance | |
 EWC Weekly Chart |
|
| Long Term Trend: Very Good | |
| Medium Term Trend: Good | |
 EWC Daily Chart |
|
| Short Term Trend: Very Good | |
| Overall Trend Score: 78 | |
| YTD Performance: 2.43% | |
| **Trend Scores & Views Are Only For Educational Purposes And Not For Investing | |
| 12Stocks.com: Investing in Canada Index using Exchange Traded Funds | |
|
The following table shows list of key exchange traded funds (ETF) that
help investors play Canada stock market. For detailed view, check out our ETF Funds section of our website. Quick View: Move mouse or cursor over ETF symbol (ticker) to view short-term technical chart and over ETF name to view long term chart. Click on ticker or stock name for detailed view. Click on to add stock symbol to your watchlist and to view watchlist. |
12Stocks.com List of ETFs that track Canada Index
| Ticker | ETF Name | Watchlist | Recent Price | Market Intelligence Score | Change % | Week % | Year-to-date % |
| EWC | Canada | | 37.57 | 78 | 0.62 | -0.16 | 2.43% |
| 12Stocks.com: Charts, Trends, Fundamental Data and Performances of Canada Stocks | |
|
We now take in-depth look at all Canada stocks including charts, multi-period performances and overall trends (as measured by market intelligence score). One can sort Canada stocks (click link to choose) by Daily, Weekly and by Year-to-Date performances. Also, one can sort by size of the company or by market capitalization. |
| Select Your Default Chart Type: | |||||
| |||||
| Click on stock symbol or name for detailed view. Click on to add stock symbol to your watchlist and to view watchlist. Quick View: Move mouse or cursor over "Daily" to quickly view daily technical stock chart and over "Weekly" to view weekly technical stock chart. | |||||

 | FNV Franco-Nevada Corporation |
| Sector: Materials | |
| SubSector: Gold | |
| MarketCap: 17703.9 Millions | |
| Recent Price: 123.25 Market Intelligence Score: 95 | |
| Day Percent Change: 1.94% Day Change: 2.34 | |
| Week Change: 0.26% Year-to-date Change: 11.2% | |
| FNV Links: Profile News Message Board | |
| Charts:- Daily , Weekly | |
| Add FNV to Watchlist: View: Get Complete FNV Trend Analysis ➞ | |
 | EMX EMX Royalty Corporation |
| Sector: Materials | |
| SubSector: Industrial Metals & Minerals | |
| MarketCap: 103.91 Millions | |
| Recent Price: 1.86 Market Intelligence Score: 61 | |
| Day Percent Change: 1.92% Day Change: 0.03 | |
| Week Change: -3.39% Year-to-date Change: 14.5% | |
| EMX Links: Profile News Message Board | |
| Charts:- Daily , Weekly | |
| Add EMX to Watchlist: View: Get Complete EMX Trend Analysis ➞ | |
 | BCE BCE Inc. |
| Sector: Technology | |
| SubSector: Telecom Services - Domestic | |
| MarketCap: 37288.3 Millions | |
| Recent Price: 33.60 Market Intelligence Score: 74 | |
| Day Percent Change: 1.85% Day Change: 0.61 | |
| Week Change: 3% Year-to-date Change: -14.7% | |
| BCE Links: Profile News Message Board | |
| Charts:- Daily , Weekly | |
| Add BCE to Watchlist: View: Get Complete BCE Trend Analysis ➞ | |
 | QBTS D-Wave Quantum Inc. |
| Sector: Technology | |
| SubSector: Computer Hardware | |
| MarketCap: 290 Millions | |
| Recent Price: 1.41 Market Intelligence Score: 37 | |
| Day Percent Change: 1.81% Day Change: 0.03 | |
| Week Change: -2.43% Year-to-date Change: 60.1% | |
| QBTS Links: Profile News Message Board | |
| Charts:- Daily , Weekly | |
| Add QBTS to Watchlist: View: Get Complete QBTS Trend Analysis ➞ | |
 | XENE Xenon Pharmaceuticals Inc. |
| Sector: Health Care | |
| SubSector: Biotechnology | |
| MarketCap: 388.585 Millions | |
| Recent Price: 43.75 Market Intelligence Score: 64 | |
| Day Percent Change: 1.74% Day Change: 0.75 | |
| Week Change: 8.02% Year-to-date Change: -5.0% | |
| XENE Links: Profile News Message Board | |
| Charts:- Daily , Weekly | |
| Add XENE to Watchlist: View: Get Complete XENE Trend Analysis ➞ | |
 | TECK Teck Resources Limited |
| Sector: Materials | |
| SubSector: Industrial Metals & Minerals | |
| MarketCap: 4347.4 Millions | |
| Recent Price: 49.29 Market Intelligence Score: 83 | |
| Day Percent Change: 1.73% Day Change: 0.84 | |
| Week Change: -2.16% Year-to-date Change: 16.6% | |
| TECK Links: Profile News Message Board | |
| Charts:- Daily , Weekly | |
| Add TECK to Watchlist: View: Get Complete TECK Trend Analysis ➞ | |
 | PDS Precision Drilling Corporation |
| Sector: Energy | |
| SubSector: Oil & Gas Equipment & Services | |
| MarketCap: 103.461 Millions | |
| Recent Price: 71.12 Market Intelligence Score: 75 | |
| Day Percent Change: 1.72% Day Change: 1.20 | |
| Week Change: -1.63% Year-to-date Change: 31.0% | |
| PDS Links: Profile News Message Board | |
| Charts:- Daily , Weekly | |
| Add PDS to Watchlist: View: Get Complete PDS Trend Analysis ➞ | |
 | CIO City Office REIT, Inc. |
| Sector: Financials | |
| SubSector: REIT - Office | |
| MarketCap: 478.566 Millions | |
| Recent Price: 4.84 Market Intelligence Score: 100 | |
| Day Percent Change: 1.68% Day Change: 0.08 | |
| Week Change: 5.68% Year-to-date Change: -20.8% | |
| CIO Links: Profile News Message Board | |
| Charts:- Daily , Weekly | |
| Add CIO to Watchlist: View: Get Complete CIO Trend Analysis ➞ | |
 | TFII TFI International Inc. |
| Sector: Transports | |
| SubSector: Trucking | |
| MarketCap: 1621.25 Millions | |
| Recent Price: 134.52 Market Intelligence Score: 32 | |
| Day Percent Change: 1.62% Day Change: 2.14 | |
| Week Change: -2.41% Year-to-date Change: -1.1% | |
| TFII Links: Profile News Message Board | |
| Charts:- Daily , Weekly | |
| Add TFII to Watchlist: View: Get Complete TFII Trend Analysis ➞ | |
 | GIB CGI Inc. |
| Sector: Technology | |
| SubSector: Information Technology Services | |
| MarketCap: 13185.3 Millions | |
| Recent Price: 103.68 Market Intelligence Score: 50 | |
| Day Percent Change: 1.54% Day Change: 1.57 | |
| Week Change: 0.52% Year-to-date Change: -3.3% | |
| GIB Links: Profile News Message Board | |
| Charts:- Daily , Weekly | |
| Add GIB to Watchlist: View: Get Complete GIB Trend Analysis ➞ | |
 | BMO Bank of Montreal |
| Sector: Financials | |
| SubSector: Money Center Banks | |
| MarketCap: 32830.2 Millions | |
| Recent Price: 91.23 Market Intelligence Score: 63 | |
| Day Percent Change: 1.49% Day Change: 1.34 | |
| Week Change: 0.35% Year-to-date Change: -7.8% | |
| BMO Links: Profile News Message Board | |
| Charts:- Daily , Weekly | |
| Add BMO to Watchlist: View: Get Complete BMO Trend Analysis ➞ | |
 | RBA Ritchie Bros. Auctioneers Incorporated |
| Sector: Services & Goods | |
| SubSector: Business Services | |
| MarketCap: 3491.02 Millions | |
| Recent Price: 72.24 Market Intelligence Score: 32 | |
| Day Percent Change: 1.47% Day Change: 1.05 | |
| Week Change: -1.28% Year-to-date Change: 8.0% | |
| RBA Links: Profile News Message Board | |
| Charts:- Daily , Weekly | |
| Add RBA to Watchlist: View: Get Complete RBA Trend Analysis ➞ | |
 | BAM Brookfield Asset Management Inc. |
| Sector: Financials | |
| SubSector: Real Estate Development | |
| MarketCap: 47134.9 Millions | |
| Recent Price: 39.13 Market Intelligence Score: 40 | |
| Day Percent Change: 1.45% Day Change: 0.56 | |
| Week Change: -1.44% Year-to-date Change: -2.6% | |
| BAM Links: Profile News Message Board | |
| Charts:- Daily , Weekly | |
| Add BAM to Watchlist: View: Get Complete BAM Trend Analysis ➞ | |
 | CSIQ Canadian Solar Inc. |
| Sector: Technology | |
| SubSector: Semiconductor - Specialized | |
| MarketCap: 957.96 Millions | |
| Recent Price: 16.79 Market Intelligence Score: 74 | |
| Day Percent Change: 1.39% Day Change: 0.23 | |
| Week Change: 10.83% Year-to-date Change: -36.0% | |
| CSIQ Links: Profile News Message Board | |
| Charts:- Daily , Weekly | |
| Add CSIQ to Watchlist: View: Get Complete CSIQ Trend Analysis ➞ | |
 | CAE CAE Inc. |
| Sector: Industrials | |
| SubSector: Aerospace/Defense Products & Services | |
| MarketCap: 3739.61 Millions | |
| Recent Price: 20.47 Market Intelligence Score: 100 | |
| Day Percent Change: 1.39% Day Change: 0.28 | |
| Week Change: 7.51% Year-to-date Change: -5.2% | |
| CAE Links: Profile News Message Board | |
| Charts:- Daily , Weekly | |
| Add CAE to Watchlist: View: Get Complete CAE Trend Analysis ➞ | |
 | RCI Rogers Communications Inc. |
| Sector: Technology | |
| SubSector: Wireless Communications | |
| MarketCap: 22111.6 Millions | |
| Recent Price: 38.43 Market Intelligence Score: 42 | |
| Day Percent Change: 1.37% Day Change: 0.52 | |
| Week Change: 1.24% Year-to-date Change: -17.9% | |
| RCI Links: Profile News Message Board | |
| Charts:- Daily , Weekly | |
| Add RCI to Watchlist: View: Get Complete RCI Trend Analysis ➞ | |
 | DOOO BRP Inc. |
| Sector: Consumer Staples | |
| SubSector: Recreational Vehicles | |
| MarketCap: 638.559 Millions | |
| Recent Price: 68.90 Market Intelligence Score: 68 | |
| Day Percent Change: 1.31% Day Change: 0.89 | |
| Week Change: 0.23% Year-to-date Change: -3.9% | |
| DOOO Links: Profile News Message Board | |
| Charts:- Daily , Weekly | |
| Add DOOO to Watchlist: View: Get Complete DOOO Trend Analysis ➞ | |
 | MFC Manulife Financial Corporation |
| Sector: Financials | |
| SubSector: Life Insurance | |
| MarketCap: 22188.7 Millions | |
| Recent Price: 24.01 Market Intelligence Score: 95 | |
| Day Percent Change: 1.31% Day Change: 0.31 | |
| Week Change: 2.3% Year-to-date Change: 8.6% | |
| MFC Links: Profile News Message Board | |
| Charts:- Daily , Weekly | |
| Add MFC to Watchlist: View: Get Complete MFC Trend Analysis ➞ | |
 | CNI Canadian National Railway Company |
| Sector: Transports | |
| SubSector: Railroads | |
| MarketCap: 54114.1 Millions | |
| Recent Price: 123.54 Market Intelligence Score: 32 | |
| Day Percent Change: 1.30% Day Change: 1.58 | |
| Week Change: -1.35% Year-to-date Change: -1.7% | |
| CNI Links: Profile News Message Board | |
| Charts:- Daily , Weekly | |
| Add CNI to Watchlist: View: Get Complete CNI Trend Analysis ➞ | |
 | MUX McEwen Mining Inc. |
| Sector: Materials | |
| SubSector: Gold | |
| MarketCap: 264.819 Millions | |
| Recent Price: 11.76 Market Intelligence Score: 83 | |
| Day Percent Change: 1.29% Day Change: 0.15 | |
| Week Change: -4.08% Year-to-date Change: 63.1% | |
| MUX Links: Profile News Message Board | |
| Charts:- Daily , Weekly | |
| Add MUX to Watchlist: View: Get Complete MUX Trend Analysis ➞ | |
 | BLCO Bausch + Lomb Corporation |
| Sector: Health Care | |
| SubSector: Medical Instruments & Supplies | |
| MarketCap: 7100 Millions | |
| Recent Price: 13.59 Market Intelligence Score: 7 | |
| Day Percent Change: 1.27% Day Change: 0.17 | |
| Week Change: -8.11% Year-to-date Change: -20.1% | |
| BLCO Links: Profile News Message Board | |
| Charts:- Daily , Weekly | |
| Add BLCO to Watchlist: View: Get Complete BLCO Trend Analysis ➞ | |
 | LULU Lululemon Athletica Inc. |
| Sector: Consumer Staples | |
| SubSector: Textile - Apparel Clothing | |
| MarketCap: 24627.8 Millions | |
| Recent Price: 355.15 Market Intelligence Score: 25 | |
| Day Percent Change: 1.24% Day Change: 4.35 | |
| Week Change: -2.62% Year-to-date Change: -30.5% | |
| LULU Links: Profile News Message Board | |
| Charts:- Daily , Weekly | |
| Add LULU to Watchlist: View: Get Complete LULU Trend Analysis ➞ | |
 | CM Canadian Imperial Bank of Commerce |
| Sector: Financials | |
| SubSector: Money Center Banks | |
| MarketCap: 27150.5 Millions | |
| Recent Price: 47.88 Market Intelligence Score: 71 | |
| Day Percent Change: 1.20% Day Change: 0.57 | |
| Week Change: 0.13% Year-to-date Change: -0.5% | |
| CM Links: Profile News Message Board | |
| Charts:- Daily , Weekly | |
| Add CM to Watchlist: View: Get Complete CM Trend Analysis ➞ | |
 | BNS The Bank of Nova Scotia |
| Sector: Financials | |
| SubSector: Money Center Banks | |
| MarketCap: 48742.1 Millions | |
| Recent Price: 46.85 Market Intelligence Score: 37 | |
| Day Percent Change: 1.19% Day Change: 0.55 | |
| Week Change: 0.62% Year-to-date Change: -3.8% | |
| BNS Links: Profile News Message Board | |
| Charts:- Daily , Weekly | |
| Add BNS to Watchlist: View: Get Complete BNS Trend Analysis ➞ | |
 | DCBO Docebo Inc. |
| Sector: Technology | |
| SubSector: Software Application | |
| MarketCap: 15787 Millions | |
| Recent Price: 45.64 Market Intelligence Score: 42 | |
| Day Percent Change: 1.11% Day Change: 0.50 | |
| Week Change: 2.06% Year-to-date Change: -5.7% | |
| DCBO Links: Profile News Message Board | |
| Charts:- Daily , Weekly | |
| Add DCBO to Watchlist: View: Get Complete DCBO Trend Analysis ➞ | |
| To view more stocks, click on Next / Previous arrows or select different range: 0 - 25 , 25 - 50 , 50 - 75 , 75 - 100 , 100 - 125 , 125 - 150 | ||
| Click To Change The Sort Order: By Market Cap or Company Size Performance: Year-to-date, Week and Day | |
| Select Chart Type: | ||
 Best Stocks Today 12Stocks.com |
© 2024 12Stocks.com Terms & Conditions Privacy Contact Us
All Information Provided Only For Education And Not To Be Used For Investing or Trading. See Terms & Conditions


One More Thing ... Get Best Stocks Delivered Daily!
Never Ever Miss A Move With Our Top Ten Stocks Lists
Find Best Stocks In Any Market - Bull or Bear Market
Take A Peek At Our Top Ten Stocks Lists: Daily, Weekly, Year-to-Date & Top Trends
Find Best Stocks In Any Market - Bull or Bear Market
Take A Peek At Our Top Ten Stocks Lists: Daily, Weekly, Year-to-Date & Top Trends
Canada Stocks With Best Up Trends [0-bearish to 100-bullish]: TransAlta [100], Brookfield Renewable[100], Algonquin Power[100], Royal Bank[100], City Office[100], CAE [100], Denison Mines[100], Mercer [100], Algonquin Power[100], Franco-Nevada [95], Manulife Financial[95]
Best Canada Stocks Year-to-Date:
Aurora Cannabis[1315.37%], Fusion [123.39%], Canopy Growth[100.39%], McEwen Mining[63.11%], D-Wave Quantum[60.13%], Hudbay Minerals[51.63%], IAMGOLD [41.9%], OrganiGram [41.6%], Endeavour Silver[34.52%], Gold Royalty[34.26%], Cronos [28.23%] Best Canada Stocks This Week:
Brookfield Renewable[20.81%], Tilray [17.98%], Canopy Growth[14.93%], Zymeworks [11.38%], Canadian Solar[10.83%], Milestone [9.74%], AbCellera Biologics[9.71%], Repare [8.13%], Ballard Power[8.08%], Xenon [8.02%], Algonquin Power[7.79%] Best Canada Stocks Daily:
AbCellera Biologics[11.49%], Lion Electric[8.71%], TransAlta [4.74%], Brookfield Renewable[4.54%], Algonquin Power[4.39%], Tilray [3.96%], Shopify [3.42%], TC Energy[3.32%], Repare [3.28%], Colliers [3.22%], Milestone [3.05%]