
 Login Sign Up


| |||||
 |  | ||||

| 12Stocks.com Market Intelligence |
Best Canada Stocks
|
|
| Quick Read: Top Canada Stocks By Performances & Trends: Daily, Weekly, Year-to-Date, Market Cap (Size) & Technical Trends | |||
| Best Canada Views: Quick Browse View, Summary & Slide Show | |||
| 12Stocks.com Canada Stocks Performances & Trends Daily | |||||||||
|
|  The overall market intelligence score is 100 (0-bearish to 100-bullish) which puts Canada index in short term bullish trend. The market intelligence score from previous trading session is 88 and hence an improvement of trend.
| ||||||||
Here are the market intelligence trend scores of the most requested Canada stocks at 12Stocks.com (click stock name for detailed review):
| |||||||||||||||||
| Scroll down this page for most comprehensive review of Canada stocks by performance, trends, technical analysis, charts, fund plays & more | |||||||||||||||||


| 12Stocks.com: Top Performing Canada Index Stocks | ||||||||||||||||||||||||||||||||||||||||||||||||
 The top performing Canada Index stocks year to date are
Now, more recently, over last week, the top performing Canada Index stocks on the move are


|
||||||||||||||||||||||||||||||||||||||||||||||||
| 12Stocks.com: Investing in Canada Index with Stocks | |
|
The following table helps investors and traders sort through current performance and trends (as measured by market intelligence score) of various
stocks in the Canada Index. Quick View: Move mouse or cursor over stock symbol (ticker) to view short-term technical chart and over stock name to view long term chart. Click on  to add stock symbol to your watchlist and to add stock symbol to your watchlist and  to view watchlist. Click on any ticker or stock name for detailed market intelligence report for that stock. to view watchlist. Click on any ticker or stock name for detailed market intelligence report for that stock. |
12Stocks.com Performance of Stocks in Canada Index
| Ticker | Stock Name | Watchlist | Category | Recent Price | Market Intelligence Score | Change % | YTD Change% |
| TRP | TC Energy |   | Energy | 38.91 | 57 | -0.54 | -0.46% |
| MIST | Milestone | | Health Care | 1.74 | 83 | -0.57 | 4.19% |
| CIGI | Colliers | | Financials | 115.89 | 70 | -0.60 | -8.40% |
| STN | Stantec | | Services & Goods | 79.74 | 0 | -0.61 | -0.56% |
| OTEX | Open Text | | Technology | 30.48 | 28 | -0.65 | -27.46% |
| BUR | Burcon Nutrascience | | Health Care | 14.33 | 10 | -0.66 | -8.14% |
| AEZS | Aeterna Zentaris | | Health Care | 8.59 | 83 | -0.68 | 361.60% |
| DOOO | BRP | | Consumer Staples | 68.40 | 44 | -0.83 | -4.59% |
| MGA | Magna | | Services & Goods | 47.49 | 30 | -0.94 | -19.62% |
| LULU | Lululemon Athletica | | Consumer Staples | 334.95 | 10 | -0.98 | -34.49% |
| QSR | Restaurant Brands | | Services & Goods | 70.86 | 0 | -1.03 | -9.31% |
| AQN | Algonquin Power | | Utilities | 6.65 | 83 | -1.19 | 5.22% |
| TAC | TransAlta | | Utilities | 7.22 | 83 | -1.23 | -13.12% |
| AQNU | Algonquin Power | | Utilities | 23.16 | 76 | -1.36 | 4.23% |
| CGC | Canopy Growth | | Health Care | 10.85 | 88 | -1.36 | 112.33% |
| XENE | Xenon | | Health Care | 39.76 | 0 | -1.38 | -13.68% |
| ACHV | Achieve Life | | Health Care | 5.00 | 76 | -1.38 | 18.76% |
| STKL | SunOpta | | Consumer Staples | 5.54 | 7 | -1.42 | 1.28% |
| NOA | Construction | | Energy | 19.93 | 0 | -1.48 | -4.41% |
| MERC | Mercer | | Consumer Staples | 10.18 | 51 | -1.64 | 7.38% |
| ONCY | Oncolytics Biotech | | Health Care | 1.11 | 25 | -1.77 | -17.78% |
| CSIQ | Canadian Solar | | Technology | 15.76 | 42 | -1.87 | -39.92% |
| APT | Alpha Tech | | Industrials | 4.93 | 18 | -1.89 | -6.81% |
| ANY | Sphere 3D | | Technology | 1.03 | 42 | -1.90 | -68.98% |
| IE | Ivanhoe Electric | | Materials | 11.97 | 63 | -1.97 | 18.11% |
| To view more stocks, click on Next / Previous arrows or select different range: 0 - 25 , 25 - 50 , 50 - 75 , 75 - 100 , 100 - 125 , 125 - 150 | ||
 | Click To Change The Sort Order: By Market Cap or Company Size Performance: Year-to-date, Week and Day |  |
| Detailed Overview Of Canada Stocks |
| Canada Technical Overview, Leaders & Laggards, Top Canada ETF Funds & Detailed Canada Stocks List, Charts, Trends & More |
| Canada: Technical Analysis, Trends & YTD Performance | |
 EWC Weekly Chart |
|
| Long Term Trend: Very Good | |
| Medium Term Trend: Very Good | |
 EWC Daily Chart |
|
| Short Term Trend: Very Good | |
| Overall Trend Score: 100 | |
| YTD Performance: 5.21% | |
| **Trend Scores & Views Are Only For Educational Purposes And Not For Investing | |
| 12Stocks.com: Investing in Canada Index using Exchange Traded Funds | |
|
The following table shows list of key exchange traded funds (ETF) that
help investors play Canada stock market. For detailed view, check out our ETF Funds section of our website. Quick View: Move mouse or cursor over ETF symbol (ticker) to view short-term technical chart and over ETF name to view long term chart. Click on ticker or stock name for detailed view. Click on to add stock symbol to your watchlist and to view watchlist. |
12Stocks.com List of ETFs that track Canada Index
| Ticker | ETF Name | Watchlist | Recent Price | Market Intelligence Score | Change % | Week % | Year-to-date % |
| EWC | Canada | | 38.59 | 100 | 0.76 | 1.05 | 5.21% |
| 12Stocks.com: Charts, Trends, Fundamental Data and Performances of Canada Stocks | |
|
We now take in-depth look at all Canada stocks including charts, multi-period performances and overall trends (as measured by market intelligence score). One can sort Canada stocks (click link to choose) by Daily, Weekly and by Year-to-Date performances. Also, one can sort by size of the company or by market capitalization. |
| Select Your Default Chart Type: | |||||
| |||||
| Click on stock symbol or name for detailed view. Click on to add stock symbol to your watchlist and to view watchlist. Quick View: Move mouse or cursor over "Daily" to quickly view daily technical stock chart and over "Weekly" to view weekly technical stock chart. | |||||

 | TRP TC Energy Corporation |
| Sector: Energy | |
| SubSector: Oil & Gas Pipelines | |
| MarketCap: 44071.1 Millions | |
| Recent Price: 38.91 Market Intelligence Score: 57 | |
| Day Percent Change: -0.54% Day Change: -0.21 | |
| Week Change: 0.72% Year-to-date Change: -0.5% | |
| TRP Links: Profile News Message Board | |
| Charts:- Daily , Weekly | |
| Add TRP to Watchlist: View: Get Complete TRP Trend Analysis ➞ | |
 | MIST Milestone Pharmaceuticals Inc. |
| Sector: Health Care | |
| SubSector: Biotechnology | |
| MarketCap: 342.685 Millions | |
| Recent Price: 1.74 Market Intelligence Score: 83 | |
| Day Percent Change: -0.57% Day Change: -0.01 | |
| Week Change: 3.26% Year-to-date Change: 4.2% | |
| MIST Links: Profile News Message Board | |
| Charts:- Daily , Weekly | |
| Add MIST to Watchlist: View: Get Complete MIST Trend Analysis ➞ | |
 | CIGI Colliers International Group Inc. |
| Sector: Financials | |
| SubSector: Property Management | |
| MarketCap: 1928.42 Millions | |
| Recent Price: 115.89 Market Intelligence Score: 70 | |
| Day Percent Change: -0.60% Day Change: -0.70 | |
| Week Change: 1.51% Year-to-date Change: -8.4% | |
| CIGI Links: Profile News Message Board | |
| Charts:- Daily , Weekly | |
| Add CIGI to Watchlist: View: Get Complete CIGI Trend Analysis ➞ | |
 | STN Stantec Inc. |
| Sector: Services & Goods | |
| SubSector: Business Services | |
| MarketCap: 2855.92 Millions | |
| Recent Price: 79.74 Market Intelligence Score: 0 | |
| Day Percent Change: -0.61% Day Change: -0.49 | |
| Week Change: -1.46% Year-to-date Change: -0.6% | |
| STN Links: Profile News Message Board | |
| Charts:- Daily , Weekly | |
| Add STN to Watchlist: View: Get Complete STN Trend Analysis ➞ | |
 | OTEX Open Text Corporation |
| Sector: Technology | |
| SubSector: Application Software | |
| MarketCap: 9291.92 Millions | |
| Recent Price: 30.48 Market Intelligence Score: 28 | |
| Day Percent Change: -0.65% Day Change: -0.20 | |
| Week Change: 0.43% Year-to-date Change: -27.5% | |
| OTEX Links: Profile News Message Board | |
| Charts:- Daily , Weekly | |
| Add OTEX to Watchlist: View: Get Complete OTEX Trend Analysis ➞ | |
 | BUR Burcon Nutrascience Corporation |
| Sector: Health Care | |
| SubSector: Biotechnology | |
| MarketCap: 0 Millions | |
| Recent Price: 14.33 Market Intelligence Score: 10 | |
| Day Percent Change: -0.66% Day Change: -0.10 | |
| Week Change: -7.19% Year-to-date Change: -8.1% | |
| BUR Links: Profile News Message Board | |
| Charts:- Daily , Weekly | |
| Add BUR to Watchlist: View: Get Complete BUR Trend Analysis ➞ | |
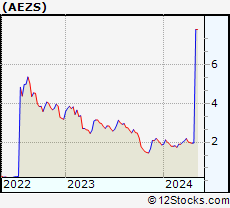 | AEZS Aeterna Zentaris Inc. |
| Sector: Health Care | |
| SubSector: Biotechnology | |
| MarketCap: 13.6785 Millions | |
| Recent Price: 8.59 Market Intelligence Score: 83 | |
| Day Percent Change: -0.68% Day Change: -0.06 | |
| Week Change: 4.32% Year-to-date Change: 361.6% | |
| AEZS Links: Profile News Message Board | |
| Charts:- Daily , Weekly | |
| Add AEZS to Watchlist: View: Get Complete AEZS Trend Analysis ➞ | |
 | DOOO BRP Inc. |
| Sector: Consumer Staples | |
| SubSector: Recreational Vehicles | |
| MarketCap: 638.559 Millions | |
| Recent Price: 68.40 Market Intelligence Score: 44 | |
| Day Percent Change: -0.83% Day Change: -0.57 | |
| Week Change: -1.38% Year-to-date Change: -4.6% | |
| DOOO Links: Profile News Message Board | |
| Charts:- Daily , Weekly | |
| Add DOOO to Watchlist: View: Get Complete DOOO Trend Analysis ➞ | |
 | MGA Magna International Inc. |
| Sector: Services & Goods | |
| SubSector: Auto Parts Wholesale | |
| MarketCap: 8967.3 Millions | |
| Recent Price: 47.49 Market Intelligence Score: 30 | |
| Day Percent Change: -0.94% Day Change: -0.45 | |
| Week Change: 1.21% Year-to-date Change: -19.6% | |
| MGA Links: Profile News Message Board | |
| Charts:- Daily , Weekly | |
| Add MGA to Watchlist: View: Get Complete MGA Trend Analysis ➞ | |
 | LULU Lululemon Athletica Inc. |
| Sector: Consumer Staples | |
| SubSector: Textile - Apparel Clothing | |
| MarketCap: 24627.8 Millions | |
| Recent Price: 334.95 Market Intelligence Score: 10 | |
| Day Percent Change: -0.98% Day Change: -3.33 | |
| Week Change: -5.1% Year-to-date Change: -34.5% | |
| LULU Links: Profile News Message Board | |
| Charts:- Daily , Weekly | |
| Add LULU to Watchlist: View: Get Complete LULU Trend Analysis ➞ | |
 | QSR Restaurant Brands International Inc. |
| Sector: Services & Goods | |
| SubSector: Restaurants | |
| MarketCap: 9551 Millions | |
| Recent Price: 70.86 Market Intelligence Score: 0 | |
| Day Percent Change: -1.03% Day Change: -0.74 | |
| Week Change: -3.25% Year-to-date Change: -9.3% | |
| QSR Links: Profile News Message Board | |
| Charts:- Daily , Weekly | |
| Add QSR to Watchlist: View: Get Complete QSR Trend Analysis ➞ | |
 | AQN Algonquin Power & Utilities Corp. |
| Sector: Utilities | |
| SubSector: Diversified Utilities | |
| MarketCap: 5916.4 Millions | |
| Recent Price: 6.65 Market Intelligence Score: 83 | |
| Day Percent Change: -1.19% Day Change: -0.08 | |
| Week Change: 1.37% Year-to-date Change: 5.2% | |
| AQN Links: Profile News Message Board | |
| Charts:- Daily , Weekly | |
| Add AQN to Watchlist: View: Get Complete AQN Trend Analysis ➞ | |
 | TAC TransAlta Corporation |
| Sector: Utilities | |
| SubSector: Diversified Utilities | |
| MarketCap: 1487.8 Millions | |
| Recent Price: 7.22 Market Intelligence Score: 83 | |
| Day Percent Change: -1.23% Day Change: -0.09 | |
| Week Change: 1.4% Year-to-date Change: -13.1% | |
| TAC Links: Profile News Message Board | |
| Charts:- Daily , Weekly | |
| Add TAC to Watchlist: View: Get Complete TAC Trend Analysis ➞ | |
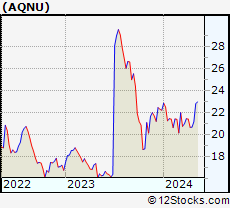 | AQNU Algonquin Power & Utilities Corp. |
| Sector: Utilities | |
| SubSector: Utilities - Renewable | |
| MarketCap: 5690 Millions | |
| Recent Price: 23.16 Market Intelligence Score: 76 | |
| Day Percent Change: -1.36% Day Change: -0.32 | |
| Week Change: 1.62% Year-to-date Change: 4.2% | |
| AQNU Links: Profile News Message Board | |
| Charts:- Daily , Weekly | |
| Add AQNU to Watchlist: View: Get Complete AQNU Trend Analysis ➞ | |
 | CGC Canopy Growth Corporation |
| Sector: Health Care | |
| SubSector: Drug Manufacturers - Other | |
| MarketCap: 4136.33 Millions | |
| Recent Price: 10.85 Market Intelligence Score: 88 | |
| Day Percent Change: -1.36% Day Change: -0.15 | |
| Week Change: 22.74% Year-to-date Change: 112.3% | |
| CGC Links: Profile News Message Board | |
| Charts:- Daily , Weekly | |
| Add CGC to Watchlist: View: Get Complete CGC Trend Analysis ➞ | |
 | XENE Xenon Pharmaceuticals Inc. |
| Sector: Health Care | |
| SubSector: Biotechnology | |
| MarketCap: 388.585 Millions | |
| Recent Price: 39.76 Market Intelligence Score: 0 | |
| Day Percent Change: -1.38% Day Change: -0.55 | |
| Week Change: -1.92% Year-to-date Change: -13.7% | |
| XENE Links: Profile News Message Board | |
| Charts:- Daily , Weekly | |
| Add XENE to Watchlist: View: Get Complete XENE Trend Analysis ➞ | |
 | ACHV Achieve Life Sciences, Inc. |
| Sector: Health Care | |
| SubSector: Biotechnology | |
| MarketCap: 7.32785 Millions | |
| Recent Price: 5.00 Market Intelligence Score: 76 | |
| Day Percent Change: -1.38% Day Change: -0.07 | |
| Week Change: 8.46% Year-to-date Change: 18.8% | |
| ACHV Links: Profile News Message Board | |
| Charts:- Daily , Weekly | |
| Add ACHV to Watchlist: View: Get Complete ACHV Trend Analysis ➞ | |
 | STKL SunOpta Inc. |
| Sector: Consumer Staples | |
| SubSector: Processed & Packaged Goods | |
| MarketCap: 174.548 Millions | |
| Recent Price: 5.54 Market Intelligence Score: 7 | |
| Day Percent Change: -1.42% Day Change: -0.08 | |
| Week Change: -5.14% Year-to-date Change: 1.3% | |
| STKL Links: Profile News Message Board | |
| Charts:- Daily , Weekly | |
| Add STKL to Watchlist: View: Get Complete STKL Trend Analysis ➞ | |
 | NOA North American Construction Group Ltd. |
| Sector: Energy | |
| SubSector: Oil & Gas Equipment & Services | |
| MarketCap: 160.461 Millions | |
| Recent Price: 19.93 Market Intelligence Score: 0 | |
| Day Percent Change: -1.48% Day Change: -0.30 | |
| Week Change: -3.11% Year-to-date Change: -4.4% | |
| NOA Links: Profile News Message Board | |
| Charts:- Daily , Weekly | |
| Add NOA to Watchlist: View: Get Complete NOA Trend Analysis ➞ | |
 | MERC Mercer International Inc. |
| Sector: Consumer Staples | |
| SubSector: Paper & Paper Products | |
| MarketCap: 509.003 Millions | |
| Recent Price: 10.18 Market Intelligence Score: 51 | |
| Day Percent Change: -1.64% Day Change: -0.17 | |
| Week Change: -3.14% Year-to-date Change: 7.4% | |
| MERC Links: Profile News Message Board | |
| Charts:- Daily , Weekly | |
| Add MERC to Watchlist: View: Get Complete MERC Trend Analysis ➞ | |
 | ONCY Oncolytics Biotech Inc. |
| Sector: Health Care | |
| SubSector: Biotechnology | |
| MarketCap: 57.3785 Millions | |
| Recent Price: 1.11 Market Intelligence Score: 25 | |
| Day Percent Change: -1.77% Day Change: -0.02 | |
| Week Change: -5.13% Year-to-date Change: -17.8% | |
| ONCY Links: Profile News Message Board | |
| Charts:- Daily , Weekly | |
| Add ONCY to Watchlist: View: Get Complete ONCY Trend Analysis ➞ | |
 | CSIQ Canadian Solar Inc. |
| Sector: Technology | |
| SubSector: Semiconductor - Specialized | |
| MarketCap: 957.96 Millions | |
| Recent Price: 15.76 Market Intelligence Score: 42 | |
| Day Percent Change: -1.87% Day Change: -0.30 | |
| Week Change: 0.38% Year-to-date Change: -39.9% | |
| CSIQ Links: Profile News Message Board | |
| Charts:- Daily , Weekly | |
| Add CSIQ to Watchlist: View: Get Complete CSIQ Trend Analysis ➞ | |
 | APT Alpha Pro Tech, Ltd. |
| Sector: Industrials | |
| SubSector: General Building Materials | |
| MarketCap: 125.953 Millions | |
| Recent Price: 4.93 Market Intelligence Score: 18 | |
| Day Percent Change: -1.89% Day Change: -0.10 | |
| Week Change: -3.9% Year-to-date Change: -6.8% | |
| APT Links: Profile News Message Board | |
| Charts:- Daily , Weekly | |
| Add APT to Watchlist: View: Get Complete APT Trend Analysis ➞ | |
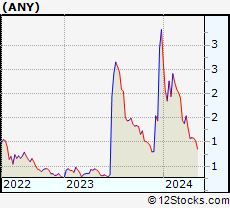 | ANY Sphere 3D Corp. |
| Sector: Technology | |
| SubSector: Application Software | |
| MarketCap: 2.57662 Millions | |
| Recent Price: 1.03 Market Intelligence Score: 42 | |
| Day Percent Change: -1.90% Day Change: -0.02 | |
| Week Change: 20.3% Year-to-date Change: -69.0% | |
| ANY Links: Profile News Message Board | |
| Charts:- Daily , Weekly | |
| Add ANY to Watchlist: View: Get Complete ANY Trend Analysis ➞ | |
 | IE Ivanhoe Electric Inc. |
| Sector: Materials | |
| SubSector: Copper | |
| MarketCap: 1200 Millions | |
| Recent Price: 11.97 Market Intelligence Score: 63 | |
| Day Percent Change: -1.97% Day Change: -0.24 | |
| Week Change: -3.31% Year-to-date Change: 18.1% | |
| IE Links: Profile News Message Board | |
| Charts:- Daily , Weekly | |
| Add IE to Watchlist: View: Get Complete IE Trend Analysis ➞ | |
| To view more stocks, click on Next / Previous arrows or select different range: 0 - 25 , 25 - 50 , 50 - 75 , 75 - 100 , 100 - 125 , 125 - 150 | ||
| Click To Change The Sort Order: By Market Cap or Company Size Performance: Year-to-date, Week and Day | |
| Select Chart Type: | ||
 Best Stocks Today 12Stocks.com |
© 2024 12Stocks.com Terms & Conditions Privacy Contact Us
All Information Provided Only For Education And Not To Be Used For Investing or Trading. See Terms & Conditions


One More Thing ... Get Best Stocks Delivered Daily!
Never Ever Miss A Move With Our Top Ten Stocks Lists
Find Best Stocks In Any Market - Bull or Bear Market
Take A Peek At Our Top Ten Stocks Lists: Daily, Weekly, Year-to-Date & Top Trends
Find Best Stocks In Any Market - Bull or Bear Market
Take A Peek At Our Top Ten Stocks Lists: Daily, Weekly, Year-to-Date & Top Trends
Canada Stocks With Best Up Trends [0-bearish to 100-bullish]: New Gold[100], Endeavour Silver[100], Vox Royalty[100], Silvercorp Metals[100], Fortuna Silver[100], Majestic Silver[100], NovaGold Resources[100], Denison Mines[100], Cameco [100], Hudbay Minerals[100], SSR Mining[100]
Best Canada Stocks Year-to-Date:
Aurora Cannabis[1449.77%], Fusion [124.06%], Canopy Growth[112.33%], Endeavour Silver[96.45%], Hudbay Minerals[86.05%], IAMGOLD [78.66%], McEwen Mining[57.14%], OrganiGram [54.2%], Fortuna Silver[51.3%], Silvercorp Metals[50.57%], D-Wave Quantum[48.17%] Best Canada Stocks This Week:
NovaGold Resources[22.89%], Canopy Growth[22.74%], Canada Goose[21.98%], Trilogy Metals[20.7%], Hudbay Minerals[16.97%], Endeavour Silver[16.57%], Aurora Cannabis[16.22%], OrganiGram [14.77%], Aurinia [14.74%], Fortuna Silver[12.09%], SilverCrest Metals[10.84%] Best Canada Stocks Daily:
New Gold[12.23%], Endeavour Silver[10.57%], Gold Royalty[8.74%], Vox Royalty[7.82%], Silvercorp Metals[7.61%], Fortuna Silver[7.55%], McEwen Mining[6.89%], Majestic Silver[6.86%], NovaGold Resources[6.73%], Denison Mines[6.67%], Cameco [6.46%]