
 Login Sign Up


| |||||
 |  | ||||

| 12Stocks.com Market Intelligence |
Best Asia Stocks
|
|
| Quick Read: Top Asia Stocks By Performances & Trends: Daily, Weekly, Year-to-Date, Market Cap (Size) & Technical Trends | |||
| Best Asia Views: Quick Browse View, Summary & Slide Show | |||
| 12Stocks.com Asia Stocks Performances & Trends Daily | |||||||||
|
|  The overall market intelligence score is 31 (0-bearish to 100-bullish) which puts Asia index in short term bearish to neutral trend. The market intelligence score from previous trading session is 58 and hence a deterioration of trend.
| ||||||||
Here are the market intelligence trend scores of the most requested Asia stocks at 12Stocks.com (click stock name for detailed review):
|


| Consider signing up for our daily 12Stocks.com "Best Stocks Newsletter". You will never ever miss a big stock move again! |
| 12Stocks.com: Top Performing Asia Index Stocks | ||||||||||||||||||||||||||||||||||||||||||||||||
 The top performing Asia Index stocks year to date are
Now, more recently, over last week, the top performing Asia Index stocks on the move are


|
||||||||||||||||||||||||||||||||||||||||||||||||
| 12Stocks.com: Investing in Asia Index with Stocks | |
|
The following table helps investors and traders sort through current performance and trends (as measured by market intelligence score) of various
stocks in the Asia Index. Quick View: Move mouse or cursor over stock symbol (ticker) to view short-term technical chart and over stock name to view long term chart. Click on  to add stock symbol to your watchlist and to add stock symbol to your watchlist and  to view watchlist. Click on any ticker or stock name for detailed market intelligence report for that stock. to view watchlist. Click on any ticker or stock name for detailed market intelligence report for that stock. |
12Stocks.com Performance of Stocks in Asia Index
| Ticker | Stock Name | Watchlist | Category | Recent Price | Market Intelligence Score | Change % | YTD Change% |
| EDTK | Skillful Craftsman |   | Consumer Staples | 0.96 | 32 | 3.44 | -23.81% |
| EDU | New Oriental | | Services & Goods | 79.64 | 26 | 3.32 | 8.68% |
| BZ | Kanzhun | | Industrials | 19.60 | 100 | 3.29 | 18.61% |
| DTSS | Datasea | | Industrials | 7.61 | 53 | 3.26 | NA |
| HCM | Hutchison China | | Health Care | 18.99 | 85 | 3.15 | 4.86% |
| TOP | TOP Financial | | Financials | 2.68 | 52 | 3.08 | -27.96% |
| BGNE | BeiGene | | Health Care | 148.56 | 49 | 3.08 | -17.63% |
| KNDI | Kandi | | Consumer Staples | 2.69 | 69 | 3.07 | -3.93% |
| TOUR | Tuniu | | Consumer Staples | 0.83 | 95 | 3.06 | 24.41% |
| MMYT | MakeMyTrip | | Services & Goods | 67.52 | 63 | 3.02 | 43.72% |
| TSM | Taiwan Semiconductor | | Technology | 136.58 | 68 | 2.71 | 31.33% |
| BEDU | Bright Scholar | | Services & Goods | 1.95 | 46 | 2.63 | 56.00% |
| SY | So-Young | | Technology | 1.25 | 68 | 2.46 | -3.10% |
| OCFT | OneConnect Financial | | Technology | 1.83 | 10 | 2.18 | -41.94% |
| SRL | Scully Royalty | | Financials | 6.40 | 30 | 2.09 | 4.92% |
| DDL | Dingdong (Cayman) | | Consumer Staples | 1.23 | 49 | 2.07 | -19.08% |
| TAOP | Taoping | | Technology | 1.08 | 75 | 1.89 | -29.87% |
| RLX | RLX | | Consumer Staples | 1.91 | 32 | 1.87 | -3.54% |
| RETO | ReTo Eco- | | Industrials | 0.95 | 53 | 1.68 | 157.73% |
| CNF | CNFinance | | Financials | 1.85 | 17 | 1.65 | -16.67% |
| AIXI | Xiao-I | | Technology | 1.28 | 17 | 1.59 | -43.11% |
| IBN | ICICI Bank | | Financials | 26.60 | 90 | 1.57 | 11.58% |
| HTHT | Huazhu | | Services & Goods | 39.74 | 80 | 1.48 | 18.84% |
| DSWL | Deswell Industries | | Consumer Staples | 2.34 | 67 | 1.30 | -11.63% |
| TME | Tencent Music | | Technology | 12.68 | 78 | 1.20 | 40.73% |
| To view more stocks, click on Next / Previous arrows or select different range: 0 - 25 , 25 - 50 , 50 - 75 , 75 - 100 , 100 - 125 , 125 - 150 , 150 - 175 , 175 - 200 , 200 - 225 | ||
 | Click To Change The Sort Order: By Market Cap or Company Size Performance: Year-to-date, Week and Day |  |
|
Get the most comprehensive stock market coverage daily at 12Stocks.com ➞ Best Stocks Today ➞ Best Stocks Weekly ➞ Best Stocks Year-to-Date ➞ Best Stocks Trends ➞  Best Stocks Today 12Stocks.com Best Nasdaq Stocks ➞ Best S&P 500 Stocks ➞ Best Tech Stocks ➞ Best Biotech Stocks ➞ |
| Detailed Overview of Asia Stocks |
| Asia Technical Overview, Leaders & Laggards, Top Asia ETF Funds & Detailed Asia Stocks List, Charts, Trends & More |
| Asia: Technical Analysis, Trends & YTD Performance | |
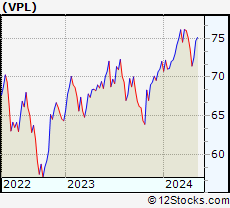
 VPL Weekly Chart |
|
| Long Term Trend: Good | |
| Medium Term Trend: Not Good | |
 VPL Daily Chart |
|
| Short Term Trend: Deteriorating | |
| Overall Trend Score: 31 | |
| YTD Performance: -0.01% | |
| **Trend Scores & Views Are Only For Educational Purposes And Not For Investing | |
| 12Stocks.com: Investing in Asia Index using Exchange Traded Funds | |
|
The following table shows list of key exchange traded funds (ETF) that
help investors play Asia stock market. For detailed view, check out our ETF Funds section of our website. Quick View: Move mouse or cursor over ETF symbol (ticker) to view short-term technical chart and over ETF name to view long term chart. Click on ticker or stock name for detailed view. Click on to add stock symbol to your watchlist and to view watchlist. |
12Stocks.com List of ETFs that track Asia Index
| Ticker | ETF Name | Watchlist | Recent Price | Market Intelligence Score | Change % | Week % | Year-to-date % |
| VPL | Pacific | | 72.02 | 31 | -0.94 | 0.83 | -0.01% |
| EEMA | Emerging Markets Asia | | 68.17 | 68 | 0.50 | 3.15 | 3.12% |
| AIA | Asia 50 | | 60.82 | 61 | 0.26 | 4.66 | 4.92% |
| AAXJ | All Country Asia | | 67.68 | 78 | 0.40 | 3.34 | 1.67% |
| GMF | Emerging Asia Pacific | | 104.07 | 60 | 0.54 | 2.94 | 2.97% |
| EPP | Pacific ex Japan | | 41.81 | 78 | -0.12 | 2.48 | -3.69% |
| ASEA | Southeast Asia | | 14.82 | 63 | -0.34 | 2.28 | -1.73% |
| DVYA | Asia/Pacific Dividend | | 36.13 | 66 | -0.15 | 2.19 | 1.05% |
| IPAC | Core Pacific | | 59.94 | 36 | -1.12 | 0.59 | 0.72% |
| FXI | China Large-Cap | | 25.44 | 100 | 0.67 | 5.96 | 5.87% |
| EWY | South Korea | | 62.90 | 51 | -0.41 | 2.58 | -4.01% |
| EWT | Taiwan | | 46.54 | 56 | 0.02 | 1.82 | 1.11% |
| EWJ | Japan | | 66.56 | 23 | -1.55 | 0.11 | 3.77% |
| EWH | Hong Kong | | 15.71 | 80 | 1.35 | 6.87 | -9.56% |
| EWS | Singapore | | 18.96 | 100 | 0.42 | 4.12 | 1.39% |
| EWM | Malaysia | | 22.05 | 78 | -0.18 | 1.33 | 3.76% |
| EPHE | Philippines | | 25.21 | 25 | 0.00 | 1.9 | -3% |
| EIDO | Indonesia | | 20.86 | 25 | -0.76 | 0.38 | -6.54% |
| THD | Thailand | | 57.59 | 45 | -0.19 | 1.75 | -9.82% |
| VNM | Vietnam | | 12.25 | 25 | 0.33 | 3.38 | -5.19% |
| 12Stocks.com: Charts, Trends, Fundamental Data and Performances of Asia Stocks | |
|
We now take in-depth look at all Asia stocks including charts, multi-period performances and overall trends (as measured by market intelligence score). One can sort Asia stocks (click link to choose) by Daily, Weekly and by Year-to-Date performances. Also, one can sort by size of the company or by market capitalization. |
| Select Your Default Chart Type: | |||||
| |||||
| Click on stock symbol or name for detailed view. Click on to add stock symbol to your watchlist and to view watchlist. Quick View: Move mouse or cursor over "Daily" to quickly view daily technical stock chart and over "Weekly" to view weekly technical stock chart. | |||||

 | EDTK Skillful Craftsman Education Technology Limited |
| Sector: Consumer Staples | |
| SubSector: Education & Training Services | |
| MarketCap: 32347 Millions | |
| Recent Price: 0.96 Market Intelligence Score: 32 | |
| Day Percent Change: 3.44% Day Change: 0.03 | |
| Week Change: 4.92% Year-to-date Change: -23.8% | |
| EDTK Links: Profile News Message Board | |
| Charts:- Daily , Weekly | |
| Add EDTK to Watchlist: View: Get Complete EDTK Trend Analysis ➞ | |
 | EDU New Oriental Education & Technology Group Inc. |
| Sector: Services & Goods | |
| SubSector: Education & Training Services | |
| MarketCap: 18673.7 Millions | |
| Recent Price: 79.64 Market Intelligence Score: 26 | |
| Day Percent Change: 3.32% Day Change: 2.56 | |
| Week Change: -6.29% Year-to-date Change: 8.7% | |
| EDU Links: Profile News Message Board | |
| Charts:- Daily , Weekly | |
| Add EDU to Watchlist: View: Get Complete EDU Trend Analysis ➞ | |
 | BZ Kanzhun Limited |
| Sector: Industrials | |
| SubSector: Staffing & Employment Services | |
| MarketCap: 6680 Millions | |
| Recent Price: 19.60 Market Intelligence Score: 100 | |
| Day Percent Change: 3.29% Day Change: 0.63 | |
| Week Change: 9.87% Year-to-date Change: 18.6% | |
| BZ Links: Profile News Message Board | |
| Charts:- Daily , Weekly | |
| Add BZ to Watchlist: View: Get Complete BZ Trend Analysis ➞ | |
 | DTSS Datasea Inc. |
| Sector: Industrials | |
| SubSector: Conglomerates | |
| MarketCap: 36.8848 Millions | |
| Recent Price: 7.61 Market Intelligence Score: 53 | |
| Day Percent Change: 3.26% Day Change: 0.24 | |
| Week Change: -0.91% Year-to-date Change: 3,180.2% | |
| DTSS Links: Profile News Message Board | |
| Charts:- Daily , Weekly | |
| Add DTSS to Watchlist: View: Get Complete DTSS Trend Analysis ➞ | |
 | HCM Hutchison China MediTech Limited |
| Sector: Health Care | |
| SubSector: Drug Manufacturers - Major | |
| MarketCap: 2324.43 Millions | |
| Recent Price: 18.99 Market Intelligence Score: 85 | |
| Day Percent Change: 3.15% Day Change: 0.58 | |
| Week Change: 15.16% Year-to-date Change: 4.9% | |
| HCM Links: Profile News Message Board | |
| Charts:- Daily , Weekly | |
| Add HCM to Watchlist: View: Get Complete HCM Trend Analysis ➞ | |
 | TOP TOP Financial Group Limited |
| Sector: Financials | |
| SubSector: Capital Markets | |
| MarketCap: 329 Millions | |
| Recent Price: 2.68 Market Intelligence Score: 52 | |
| Day Percent Change: 3.08% Day Change: 0.08 | |
| Week Change: 14.04% Year-to-date Change: -28.0% | |
| TOP Links: Profile News Message Board | |
| Charts:- Daily , Weekly | |
| Add TOP to Watchlist: View: Get Complete TOP Trend Analysis ➞ | |
 | BGNE BeiGene, Ltd. |
| Sector: Health Care | |
| SubSector: Biotechnology | |
| MarketCap: 10838.5 Millions | |
| Recent Price: 148.56 Market Intelligence Score: 49 | |
| Day Percent Change: 3.08% Day Change: 4.44 | |
| Week Change: 14.7% Year-to-date Change: -17.6% | |
| BGNE Links: Profile News Message Board | |
| Charts:- Daily , Weekly | |
| Add BGNE to Watchlist: View: Get Complete BGNE Trend Analysis ➞ | |
 | KNDI Kandi Technologies Group, Inc. |
| Sector: Consumer Staples | |
| SubSector: Auto Manufacturers - Major | |
| MarketCap: 137.471 Millions | |
| Recent Price: 2.69 Market Intelligence Score: 69 | |
| Day Percent Change: 3.07% Day Change: 0.08 | |
| Week Change: 5.49% Year-to-date Change: -3.9% | |
| KNDI Links: Profile News Message Board | |
| Charts:- Daily , Weekly | |
| Add KNDI to Watchlist: View: Get Complete KNDI Trend Analysis ➞ | |
 | TOUR Tuniu Corporation |
| Sector: Consumer Staples | |
| SubSector: Recreational Goods, Other | |
| MarketCap: 124.459 Millions | |
| Recent Price: 0.83 Market Intelligence Score: 95 | |
| Day Percent Change: 3.06% Day Change: 0.02 | |
| Week Change: 4.35% Year-to-date Change: 24.4% | |
| TOUR Links: Profile News Message Board | |
| Charts:- Daily , Weekly | |
| Add TOUR to Watchlist: View: Get Complete TOUR Trend Analysis ➞ | |
 | MMYT MakeMyTrip Limited |
| Sector: Services & Goods | |
| SubSector: General Entertainment | |
| MarketCap: 1429.59 Millions | |
| Recent Price: 67.52 Market Intelligence Score: 63 | |
| Day Percent Change: 3.02% Day Change: 1.98 | |
| Week Change: 10.87% Year-to-date Change: 43.7% | |
| MMYT Links: Profile News Message Board | |
| Charts:- Daily , Weekly | |
| Add MMYT to Watchlist: View: Get Complete MMYT Trend Analysis ➞ | |
 | TSM Taiwan Semiconductor Manufacturing Company Limited |
| Sector: Technology | |
| SubSector: Semiconductor - Integrated Circuits | |
| MarketCap: 239384 Millions | |
| Recent Price: 136.58 Market Intelligence Score: 68 | |
| Day Percent Change: 2.71% Day Change: 3.61 | |
| Week Change: 6.95% Year-to-date Change: 31.3% | |
| TSM Links: Profile News Message Board | |
| Charts:- Daily , Weekly | |
| Add TSM to Watchlist: View: Get Complete TSM Trend Analysis ➞ | |
 | BEDU Bright Scholar Education Holdings Limited |
| Sector: Services & Goods | |
| SubSector: Education & Training Services | |
| MarketCap: 792.406 Millions | |
| Recent Price: 1.95 Market Intelligence Score: 46 | |
| Day Percent Change: 2.63% Day Change: 0.05 | |
| Week Change: -2.99% Year-to-date Change: 56.0% | |
| BEDU Links: Profile News Message Board | |
| Charts:- Daily , Weekly | |
| Add BEDU to Watchlist: View: Get Complete BEDU Trend Analysis ➞ | |
 | SY So-Young International Inc. |
| Sector: Technology | |
| SubSector: Healthcare Information Services | |
| MarketCap: 1000.55 Millions | |
| Recent Price: 1.25 Market Intelligence Score: 68 | |
| Day Percent Change: 2.46% Day Change: 0.03 | |
| Week Change: 7.3% Year-to-date Change: -3.1% | |
| SY Links: Profile News Message Board | |
| Charts:- Daily , Weekly | |
| Add SY to Watchlist: View: Get Complete SY Trend Analysis ➞ | |
 | OCFT OneConnect Financial Technology Co., Ltd. |
| Sector: Technology | |
| SubSector: Software Application | |
| MarketCap: 80387 Millions | |
| Recent Price: 1.83 Market Intelligence Score: 10 | |
| Day Percent Change: 2.18% Day Change: 0.04 | |
| Week Change: -3.23% Year-to-date Change: -41.9% | |
| OCFT Links: Profile News Message Board | |
| Charts:- Daily , Weekly | |
| Add OCFT to Watchlist: View: Get Complete OCFT Trend Analysis ➞ | |
 | SRL Scully Royalty Ltd. |
| Sector: Financials | |
| SubSector: Asset Management | |
| MarketCap: 88.3203 Millions | |
| Recent Price: 6.40 Market Intelligence Score: 30 | |
| Day Percent Change: 2.09% Day Change: 0.13 | |
| Week Change: -1.99% Year-to-date Change: 4.9% | |
| SRL Links: Profile News Message Board | |
| Charts:- Daily , Weekly | |
| Add SRL to Watchlist: View: Get Complete SRL Trend Analysis ➞ | |
 | DDL Dingdong (Cayman) Limited |
| Sector: Consumer Staples | |
| SubSector: Grocery Stores | |
| MarketCap: 708 Millions | |
| Recent Price: 1.23 Market Intelligence Score: 49 | |
| Day Percent Change: 2.07% Day Change: 0.02 | |
| Week Change: 6.96% Year-to-date Change: -19.1% | |
| DDL Links: Profile News Message Board | |
| Charts:- Daily , Weekly | |
| Add DDL to Watchlist: View: Get Complete DDL Trend Analysis ➞ | |
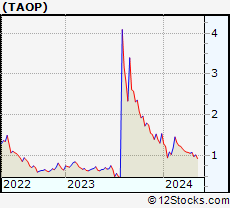 | TAOP Taoping Inc. |
| Sector: Technology | |
| SubSector: Information Technology Services | |
| MarketCap: 17.1468 Millions | |
| Recent Price: 1.08 Market Intelligence Score: 75 | |
| Day Percent Change: 1.89% Day Change: 0.02 | |
| Week Change: 0% Year-to-date Change: -29.9% | |
| TAOP Links: Profile News Message Board | |
| Charts:- Daily , Weekly | |
| Add TAOP to Watchlist: View: Get Complete TAOP Trend Analysis ➞ | |
 | RLX RLX Technology Inc. |
| Sector: Consumer Staples | |
| SubSector: Tobacco | |
| MarketCap: 2800 Millions | |
| Recent Price: 1.91 Market Intelligence Score: 32 | |
| Day Percent Change: 1.87% Day Change: 0.03 | |
| Week Change: 7.3% Year-to-date Change: -3.5% | |
| RLX Links: Profile News Message Board | |
| Charts:- Daily , Weekly | |
| Add RLX to Watchlist: View: Get Complete RLX Trend Analysis ➞ | |
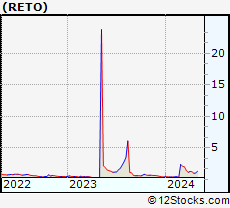 | RETO ReTo Eco-Solutions, Inc. |
| Sector: Industrials | |
| SubSector: General Building Materials | |
| MarketCap: 13.1953 Millions | |
| Recent Price: 0.95 Market Intelligence Score: 53 | |
| Day Percent Change: 1.68% Day Change: 0.02 | |
| Week Change: -0.46% Year-to-date Change: 157.7% | |
| RETO Links: Profile News Message Board | |
| Charts:- Daily , Weekly | |
| Add RETO to Watchlist: View: Get Complete RETO Trend Analysis ➞ | |
 | CNF CNFinance Holdings Limited |
| Sector: Financials | |
| SubSector: Credit Services | |
| MarketCap: 277.408 Millions | |
| Recent Price: 1.85 Market Intelligence Score: 17 | |
| Day Percent Change: 1.65% Day Change: 0.03 | |
| Week Change: 0.54% Year-to-date Change: -16.7% | |
| CNF Links: Profile News Message Board | |
| Charts:- Daily , Weekly | |
| Add CNF to Watchlist: View: Get Complete CNF Trend Analysis ➞ | |
 | AIXI Xiao-I Corporation |
| Sector: Technology | |
| SubSector: Software - Application | |
| MarketCap: 431 Millions | |
| Recent Price: 1.28 Market Intelligence Score: 17 | |
| Day Percent Change: 1.59% Day Change: 0.02 | |
| Week Change: -9.86% Year-to-date Change: -43.1% | |
| AIXI Links: Profile News Message Board | |
| Charts:- Daily , Weekly | |
| Add AIXI to Watchlist: View: Get Complete AIXI Trend Analysis ➞ | |
 | IBN ICICI Bank Limited |
| Sector: Financials | |
| SubSector: Money Center Banks | |
| MarketCap: 31194.1 Millions | |
| Recent Price: 26.60 Market Intelligence Score: 90 | |
| Day Percent Change: 1.57% Day Change: 0.41 | |
| Week Change: 3.58% Year-to-date Change: 11.6% | |
| IBN Links: Profile News Message Board | |
| Charts:- Daily , Weekly | |
| Add IBN to Watchlist: View: Get Complete IBN Trend Analysis ➞ | |
 | HTHT Huazhu Group Limited |
| Sector: Services & Goods | |
| SubSector: Lodging | |
| MarketCap: 9164.46 Millions | |
| Recent Price: 39.74 Market Intelligence Score: 80 | |
| Day Percent Change: 1.48% Day Change: 0.58 | |
| Week Change: 7.73% Year-to-date Change: 18.8% | |
| HTHT Links: Profile News Message Board | |
| Charts:- Daily , Weekly | |
| Add HTHT to Watchlist: View: Get Complete HTHT Trend Analysis ➞ | |
 | DSWL Deswell Industries, Inc. |
| Sector: Consumer Staples | |
| SubSector: Rubber & Plastics | |
| MarketCap: 38.357 Millions | |
| Recent Price: 2.34 Market Intelligence Score: 67 | |
| Day Percent Change: 1.30% Day Change: 0.03 | |
| Week Change: 4% Year-to-date Change: -11.6% | |
| DSWL Links: Profile News Message Board | |
| Charts:- Daily , Weekly | |
| Add DSWL to Watchlist: View: Get Complete DSWL Trend Analysis ➞ | |
 | TME Tencent Music Entertainment Group |
| Sector: Technology | |
| SubSector: Internet Information Providers | |
| MarketCap: 16195 Millions | |
| Recent Price: 12.68 Market Intelligence Score: 78 | |
| Day Percent Change: 1.20% Day Change: 0.15 | |
| Week Change: 11.62% Year-to-date Change: 40.7% | |
| TME Links: Profile News Message Board | |
| Charts:- Daily , Weekly | |
| Add TME to Watchlist: View: Get Complete TME Trend Analysis ➞ | |
| To view more stocks, click on Next / Previous arrows or select different range: 0 - 25 , 25 - 50 , 50 - 75 , 75 - 100 , 100 - 125 , 125 - 150 , 150 - 175 , 175 - 200 , 200 - 225 | ||
| Click To Change The Sort Order: By Market Cap or Company Size Performance: Year-to-date, Week and Day | |
| Select Chart Type: | ||
|
Best Stocks Today 12Stocks.com |
© 2024 12Stocks.com Terms & Conditions Privacy Contact Us
All Information Provided Only For Education And Not To Be Used For Investing or Trading. See Terms & Conditions


One More Thing ... Get Best Stocks Delivered Daily!
Never Ever Miss A Move With Our Top Ten Stocks Lists
Find Best Stocks In Any Market - Bull or Bear Market
Take A Peek At Our Top Ten Stocks Lists: Daily, Weekly, Year-to-Date & Top Trends
Find Best Stocks In Any Market - Bull or Bear Market
Take A Peek At Our Top Ten Stocks Lists: Daily, Weekly, Year-to-Date & Top Trends
Asia Stocks With Best Up Trends [0-bearish to 100-bullish]: Yatsen Holding[100], Kanzhun [100], JD.com [100], Dada Nexus[100], ZTO Express[100], Alibaba [100], Baozun [95], MOGU [93], Full Truck[93], MINISO [93], U Power[93]
Best Asia Stocks Year-to-Date:
U Power[2852.01%], DouYu [791.58%], MicroCloud Hologram[668.35%], China Liberal[520.81%], Yatsen Holding[502.79%], Zhongchao [312.22%], Uxin [172.47%], QuantaSing [103.7%], GigaCloud [97.54%], Cheetah Mobile[88.16%], Yiren Digital[61.54%] Best Asia Stocks This Week:
WiMi Hologram[33.51%], Yatsen Holding[21.99%], Cheetah Mobile[21.19%], iQIYI [17.99%], Aesthetic Medical[17.77%], TAL Education[16.8%], Golden Heaven[15.91%], Hutchison China[15.16%], BeiGene [14.7%], Bilibili [14.67%], TOP Financial[14.04%] Best Asia Stocks Daily:
Boqii Holding[15.69%], MicroCloud Hologram[13.86%], TAL Education[8.89%], MOGU [8.43%], Cheetah Mobile[8.33%], Shengfeng Development[7.69%], Viomi [7.13%], Sify [5.88%], Fangdd Network[5.41%], Secoo Holding[5.19%], 21Vianet [5.06%]