
 Login Sign Up


| |||||
 |  | ||||

| 12Stocks.com Market Intelligence |
Best Asia Stocks
|
|
| Quick Read: Top Asia Stocks By Performances & Trends: Daily, Weekly, Year-to-Date, Market Cap (Size) & Technical Trends | |||
| Best Asia Views: Quick Browse View, Summary & Slide Show | |||
| 12Stocks.com Asia Stocks Performances & Trends Daily | |||||||||
|
|  The overall market intelligence score is 58 (0-bearish to 100-bullish) which puts Asia index in short term neutral trend. The market intelligence score from previous trading session is 23 and an improvement of trend continues.
| ||||||||
Here are the market intelligence trend scores of the most requested Asia stocks at 12Stocks.com (click stock name for detailed review):
|


| Consider signing up for our daily 12Stocks.com "Best Stocks Newsletter". You will never ever miss a big stock move again! |
| 12Stocks.com: Top Performing Asia Index Stocks | ||||||||||||||||||||||||||||||||||||||||||||||||
 The top performing Asia Index stocks year to date are
Now, more recently, over last week, the top performing Asia Index stocks on the move are


|
||||||||||||||||||||||||||||||||||||||||||||||||
| 12Stocks.com: Investing in Asia Index with Stocks | |
|
The following table helps investors and traders sort through current performance and trends (as measured by market intelligence score) of various
stocks in the Asia Index. Quick View: Move mouse or cursor over stock symbol (ticker) to view short-term technical chart and over stock name to view long term chart. Click on  to add stock symbol to your watchlist and to add stock symbol to your watchlist and  to view watchlist. Click on any ticker or stock name for detailed market intelligence report for that stock. to view watchlist. Click on any ticker or stock name for detailed market intelligence report for that stock. |
12Stocks.com Performance of Stocks in Asia Index
| Ticker | Stock Name | Watchlist | Category | Recent Price | Market Intelligence Score | Change % | YTD Change% |
| HTHT | Huazhu |   | Services & Goods | 38.82 | 80 | 2.83 | 16.09% |
| YGMZ | MingZhu Logistics | | Industrials | 0.43 | 25 | 2.76 | -9.27% |
| TAL | TAL Education | | Services & Goods | 12.26 | 90 | 2.59 | -2.93% |
| BABA | Alibaba | | Services & Goods | 72.51 | 82 | 2.59 | -6.45% |
| GDHG | Golden Heaven | | Services & Goods | 0.23 | 20 | 2.51 | -68.08% |
| GDS | GDS | | Technology | 6.75 | 80 | 2.50 | -25.93% |
| SFWL | Shengfeng Development | | Industrials | 1.64 | 10 | 2.50 | -40.36% |
| TCOM | Trip.com | | Services & Goods | 50.56 | 73 | 2.44 | 40.39% |
| NOAH | Noah | | Financials | 12.16 | 78 | 2.44 | -11.95% |
| DOYU | DouYu | | Technology | 8.47 | 88 | 2.23 | 792.11% |
| XPEV | XPeng | | Services & Goods | 7.13 | 35 | 2.22 | -51.10% |
| DSWL | Deswell Industries | | Consumer Staples | 2.30 | 59 | 2.22 | -13.15% |
| ATAT | Atour Lifestyle | | Services & Goods | 17.88 | 68 | 2.17 | 2.05% |
| EDU | New Oriental | | Services & Goods | 89.77 | 90 | 2.12 | 22.50% |
| VIOT | Viomi | | Technology | 0.54 | 10 | 2.08 | -45.90% |
| ITP | IT Tech | | Consumer Staples | 0.24 | 35 | 2.05 | -22.85% |
| JD | JD.com | | Technology | 27.54 | 100 | 2.02 | -4.69% |
| QSG | QuantaSing | | Consumer Staples | 3.35 | 20 | 1.98 | 106.48% |
| FINV | FinVolution | | Financials | 4.85 | 30 | 1.89 | -1.02% |
| YI | 111 | | Services & Goods | 1.08 | 20 | 1.89 | -30.32% |
| NIO | NIO | | Consumer Staples | 4.08 | 17 | 1.88 | -55.07% |
| ZLAB | Zai Lab | | Health Care | 15.27 | 17 | 1.87 | -44.13% |
| QFIN | 360 Finance | | Financials | 18.63 | 53 | 1.86 | 17.76% |
| LX | LexinFintech | | Financials | 1.68 | 17 | 1.82 | -8.70% |
| ASX | ASE | | Technology | 10.36 | 51 | 1.77 | 10.10% |
| To view more stocks, click on Next / Previous arrows or select different range: 0 - 25 , 25 - 50 , 50 - 75 , 75 - 100 , 100 - 125 , 125 - 150 , 150 - 175 , 175 - 200 , 200 - 225 | ||
 | Click To Change The Sort Order: By Market Cap or Company Size Performance: Year-to-date, Week and Day |  |
|
Get the most comprehensive stock market coverage daily at 12Stocks.com ➞ Best Stocks Today ➞ Best Stocks Weekly ➞ Best Stocks Year-to-Date ➞ Best Stocks Trends ➞  Best Stocks Today 12Stocks.com Best Nasdaq Stocks ➞ Best S&P 500 Stocks ➞ Best Tech Stocks ➞ Best Biotech Stocks ➞ |
| Detailed Overview of Asia Stocks |
| Asia Technical Overview, Leaders & Laggards, Top Asia ETF Funds & Detailed Asia Stocks List, Charts, Trends & More |
| Asia: Technical Analysis, Trends & YTD Performance | |
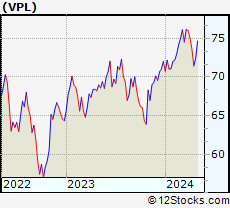
 VPL Weekly Chart |
|
| Long Term Trend: Good | |
| Medium Term Trend: Not Good | |
 VPL Daily Chart |
|
| Short Term Trend: Very Good | |
| Overall Trend Score: 58 | |
| YTD Performance: 0.79% | |
| **Trend Scores & Views Are Only For Educational Purposes And Not For Investing | |
| 12Stocks.com: Investing in Asia Index using Exchange Traded Funds | |
|
The following table shows list of key exchange traded funds (ETF) that
help investors play Asia stock market. For detailed view, check out our ETF Funds section of our website. Quick View: Move mouse or cursor over ETF symbol (ticker) to view short-term technical chart and over ETF name to view long term chart. Click on ticker or stock name for detailed view. Click on to add stock symbol to your watchlist and to view watchlist. |
12Stocks.com List of ETFs that track Asia Index
| Ticker | ETF Name | Watchlist | Recent Price | Market Intelligence Score | Change % | Week % | Year-to-date % |
| VPL | Pacific | | 72.60 | 58 | 0.41 | 1.64 | 0.79% |
| EEMA | Emerging Markets Asia | | 67.18 | 68 | 0.64 | 1.65 | 1.62% |
| AIA | Asia 50 | | 59.77 | 68 | 1.27 | 2.86 | 3.11% |
| AAXJ | All Country Asia | | 66.74 | 75 | 0.59 | 1.91 | 0.26% |
| GMF | Emerging Asia Pacific | | 102.92 | 61 | 0.76 | 1.8 | 1.83% |
| EPP | Pacific ex Japan | | 41.74 | 55 | 0.78 | 2.32 | -3.84% |
| ASEA | Southeast Asia | | 14.94 | 37 | 2.05 | 3.11 | -0.94% |
| DVYA | Asia/Pacific Dividend | | 36.16 | 88 | 0.81 | 2.26 | 1.12% |
| IPAC | Core Pacific | | 60.58 | 58 | 0.44 | 1.65 | 1.79% |
| FXI | China Large-Cap | | 24.80 | 100 | 1.54 | 3.27 | 3.18% |
| EWY | South Korea | | 63.01 | 58 | 0.53 | 2.76 | -3.85% |
| EWT | Taiwan | | 46.34 | 48 | 1.06 | 1.37 | 0.66% |
| EWJ | Japan | | 67.34 | 51 | 0.25 | 1.28 | 4.99% |
| EWH | Hong Kong | | 15.24 | 59 | 1.70 | 3.71 | -12.23% |
| EWS | Singapore | | 18.93 | 100 | 2.08 | 3.93 | 1.2% |
| EWM | Malaysia | | 22.02 | 93 | 0.05 | 1.19 | 3.62% |
| EPHE | Philippines | | 25.29 | 25 | 1.73 | 2.22 | -2.69% |
| EIDO | Indonesia | | 20.99 | 25 | 1.35 | 1.01 | -5.96% |
| THD | Thailand | | 57.87 | 45 | 1.49 | 2.24 | -9.38% |
| VNM | Vietnam | | 12.01 | 10 | -1.23 | 1.35 | -7.04% |
| 12Stocks.com: Charts, Trends, Fundamental Data and Performances of Asia Stocks | |
|
We now take in-depth look at all Asia stocks including charts, multi-period performances and overall trends (as measured by market intelligence score). One can sort Asia stocks (click link to choose) by Daily, Weekly and by Year-to-Date performances. Also, one can sort by size of the company or by market capitalization. |
| Select Your Default Chart Type: | |||||
| |||||
| Click on stock symbol or name for detailed view. Click on to add stock symbol to your watchlist and to view watchlist. Quick View: Move mouse or cursor over "Daily" to quickly view daily technical stock chart and over "Weekly" to view weekly technical stock chart. | |||||

 | HTHT Huazhu Group Limited |
| Sector: Services & Goods | |
| SubSector: Lodging | |
| MarketCap: 9164.46 Millions | |
| Recent Price: 38.82 Market Intelligence Score: 80 | |
| Day Percent Change: 2.83% Day Change: 1.07 | |
| Week Change: 5.23% Year-to-date Change: 16.1% | |
| HTHT Links: Profile News Message Board | |
| Charts:- Daily , Weekly | |
| Add HTHT to Watchlist: View: Get Complete HTHT Trend Analysis ➞ | |
 | YGMZ MingZhu Logistics Holdings Limited |
| Sector: Industrials | |
| SubSector: Trucking | |
| MarketCap: 41627 Millions | |
| Recent Price: 0.43 Market Intelligence Score: 25 | |
| Day Percent Change: 2.76% Day Change: 0.01 | |
| Week Change: -8.77% Year-to-date Change: -9.3% | |
| YGMZ Links: Profile News Message Board | |
| Charts:- Daily , Weekly | |
| Add YGMZ to Watchlist: View: Get Complete YGMZ Trend Analysis ➞ | |
 | TAL TAL Education Group |
| Sector: Services & Goods | |
| SubSector: Education & Training Services | |
| MarketCap: 30103.1 Millions | |
| Recent Price: 12.26 Market Intelligence Score: 90 | |
| Day Percent Change: 2.59% Day Change: 0.31 | |
| Week Change: 7.26% Year-to-date Change: -2.9% | |
| TAL Links: Profile News Message Board | |
| Charts:- Daily , Weekly | |
| Add TAL to Watchlist: View: Get Complete TAL Trend Analysis ➞ | |
 | BABA Alibaba Group Holding Limited |
| Sector: Services & Goods | |
| SubSector: Specialty Retail, Other | |
| MarketCap: 522666 Millions | |
| Recent Price: 72.51 Market Intelligence Score: 82 | |
| Day Percent Change: 2.59% Day Change: 1.83 | |
| Week Change: 4.98% Year-to-date Change: -6.5% | |
| BABA Links: Profile News Message Board | |
| Charts:- Daily , Weekly | |
| Add BABA to Watchlist: View: Get Complete BABA Trend Analysis ➞ | |
 | GDHG Golden Heaven Group Holdings Ltd. |
| Sector: Services & Goods | |
| SubSector: Leisure | |
| MarketCap: 230 Millions | |
| Recent Price: 0.23 Market Intelligence Score: 20 | |
| Day Percent Change: 2.51% Day Change: 0.01 | |
| Week Change: -0.85% Year-to-date Change: -68.1% | |
| GDHG Links: Profile News Message Board | |
| Charts:- Daily , Weekly | |
| Add GDHG to Watchlist: View: Get Complete GDHG Trend Analysis ➞ | |
 | GDS GDS Holdings Limited |
| Sector: Technology | |
| SubSector: Data Storage Devices | |
| MarketCap: 8597.99 Millions | |
| Recent Price: 6.75 Market Intelligence Score: 80 | |
| Day Percent Change: 2.50% Day Change: 0.17 | |
| Week Change: 6.88% Year-to-date Change: -25.9% | |
| GDS Links: Profile News Message Board | |
| Charts:- Daily , Weekly | |
| Add GDS to Watchlist: View: Get Complete GDS Trend Analysis ➞ | |
 | SFWL Shengfeng Development Limited |
| Sector: Industrials | |
| SubSector: Integrated Freight & Logistics | |
| MarketCap: 747 Millions | |
| Recent Price: 1.64 Market Intelligence Score: 10 | |
| Day Percent Change: 2.50% Day Change: 0.04 | |
| Week Change: 0.61% Year-to-date Change: -40.4% | |
| SFWL Links: Profile News Message Board | |
| Charts:- Daily , Weekly | |
| Add SFWL to Watchlist: View: Get Complete SFWL Trend Analysis ➞ | |
 | TCOM Trip.com Group Limited |
| Sector: Services & Goods | |
| SubSector: Lodging | |
| MarketCap: 13449.6 Millions | |
| Recent Price: 50.56 Market Intelligence Score: 73 | |
| Day Percent Change: 2.44% Day Change: 1.20 | |
| Week Change: 5.32% Year-to-date Change: 40.4% | |
| TCOM Links: Profile News Message Board | |
| Charts:- Daily , Weekly | |
| Add TCOM to Watchlist: View: Get Complete TCOM Trend Analysis ➞ | |
 | NOAH Noah Holdings Limited |
| Sector: Financials | |
| SubSector: Asset Management | |
| MarketCap: 1495.33 Millions | |
| Recent Price: 12.16 Market Intelligence Score: 78 | |
| Day Percent Change: 2.44% Day Change: 0.29 | |
| Week Change: 4.65% Year-to-date Change: -12.0% | |
| NOAH Links: Profile News Message Board | |
| Charts:- Daily , Weekly | |
| Add NOAH to Watchlist: View: Get Complete NOAH Trend Analysis ➞ | |
 | DOYU DouYu International Holdings Limited |
| Sector: Technology | |
| SubSector: Internet Information Providers | |
| MarketCap: 2483 Millions | |
| Recent Price: 8.47 Market Intelligence Score: 88 | |
| Day Percent Change: 2.23% Day Change: 0.19 | |
| Week Change: 5.28% Year-to-date Change: 792.1% | |
| DOYU Links: Profile News Message Board | |
| Charts:- Daily , Weekly | |
| Add DOYU to Watchlist: View: Get Complete DOYU Trend Analysis ➞ | |
 | XPEV XPeng Inc. |
| Sector: Services & Goods | |
| SubSector: Auto Manufacturers | |
| MarketCap: 32917 Millions | |
| Recent Price: 7.13 Market Intelligence Score: 35 | |
| Day Percent Change: 2.22% Day Change: 0.15 | |
| Week Change: 1.28% Year-to-date Change: -51.1% | |
| XPEV Links: Profile News Message Board | |
| Charts:- Daily , Weekly | |
| Add XPEV to Watchlist: View: Get Complete XPEV Trend Analysis ➞ | |
 | DSWL Deswell Industries, Inc. |
| Sector: Consumer Staples | |
| SubSector: Rubber & Plastics | |
| MarketCap: 38.357 Millions | |
| Recent Price: 2.30 Market Intelligence Score: 59 | |
| Day Percent Change: 2.22% Day Change: 0.05 | |
| Week Change: 2.22% Year-to-date Change: -13.2% | |
| DSWL Links: Profile News Message Board | |
| Charts:- Daily , Weekly | |
| Add DSWL to Watchlist: View: Get Complete DSWL Trend Analysis ➞ | |
 | ATAT Atour Lifestyle Holdings Limited |
| Sector: Services & Goods | |
| SubSector: Lodging | |
| MarketCap: 2120 Millions | |
| Recent Price: 17.88 Market Intelligence Score: 68 | |
| Day Percent Change: 2.17% Day Change: 0.38 | |
| Week Change: 3.71% Year-to-date Change: 2.1% | |
| ATAT Links: Profile News Message Board | |
| Charts:- Daily , Weekly | |
| Add ATAT to Watchlist: View: Get Complete ATAT Trend Analysis ➞ | |
 | EDU New Oriental Education & Technology Group Inc. |
| Sector: Services & Goods | |
| SubSector: Education & Training Services | |
| MarketCap: 18673.7 Millions | |
| Recent Price: 89.77 Market Intelligence Score: 90 | |
| Day Percent Change: 2.12% Day Change: 1.86 | |
| Week Change: 5.62% Year-to-date Change: 22.5% | |
| EDU Links: Profile News Message Board | |
| Charts:- Daily , Weekly | |
| Add EDU to Watchlist: View: Get Complete EDU Trend Analysis ➞ | |
 | VIOT Viomi Technology Co., Ltd |
| Sector: Technology | |
| SubSector: Electronic Equipment | |
| MarketCap: 357.2 Millions | |
| Recent Price: 0.54 Market Intelligence Score: 10 | |
| Day Percent Change: 2.08% Day Change: 0.01 | |
| Week Change: -0.82% Year-to-date Change: -45.9% | |
| VIOT Links: Profile News Message Board | |
| Charts:- Daily , Weekly | |
| Add VIOT to Watchlist: View: Get Complete VIOT Trend Analysis ➞ | |
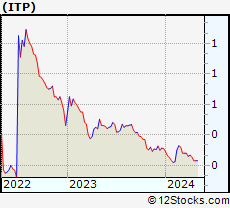 | ITP IT Tech Packaging, Inc. |
| Sector: Consumer Staples | |
| SubSector: Paper & Paper Products | |
| MarketCap: 14.7303 Millions | |
| Recent Price: 0.24 Market Intelligence Score: 35 | |
| Day Percent Change: 2.05% Day Change: 0.00 | |
| Week Change: 3.69% Year-to-date Change: -22.9% | |
| ITP Links: Profile News Message Board | |
| Charts:- Daily , Weekly | |
| Add ITP to Watchlist: View: Get Complete ITP Trend Analysis ➞ | |
 | JD JD.com, Inc. |
| Sector: Technology | |
| SubSector: Internet Information Providers | |
| MarketCap: 59907.3 Millions | |
| Recent Price: 27.54 Market Intelligence Score: 100 | |
| Day Percent Change: 2.02% Day Change: 0.55 | |
| Week Change: 7.94% Year-to-date Change: -4.7% | |
| JD Links: Profile News Message Board | |
| Charts:- Daily , Weekly | |
| Add JD to Watchlist: View: Get Complete JD Trend Analysis ➞ | |
 | QSG QuantaSing Group Limited |
| Sector: Consumer Staples | |
| SubSector: Education & Training Services | |
| MarketCap: 433 Millions | |
| Recent Price: 3.35 Market Intelligence Score: 20 | |
| Day Percent Change: 1.98% Day Change: 0.07 | |
| Week Change: -0.15% Year-to-date Change: 106.5% | |
| QSG Links: Profile News Message Board | |
| Charts:- Daily , Weekly | |
| Add QSG to Watchlist: View: Get Complete QSG Trend Analysis ➞ | |
 | FINV FinVolution Group |
| Sector: Financials | |
| SubSector: Credit Services | |
| MarketCap: 476.208 Millions | |
| Recent Price: 4.85 Market Intelligence Score: 30 | |
| Day Percent Change: 1.89% Day Change: 0.09 | |
| Week Change: 2.32% Year-to-date Change: -1.0% | |
| FINV Links: Profile News Message Board | |
| Charts:- Daily , Weekly | |
| Add FINV to Watchlist: View: Get Complete FINV Trend Analysis ➞ | |
 | YI 111, Inc. |
| Sector: Services & Goods | |
| SubSector: Drug Stores | |
| MarketCap: 520.351 Millions | |
| Recent Price: 1.08 Market Intelligence Score: 20 | |
| Day Percent Change: 1.89% Day Change: 0.02 | |
| Week Change: 5.88% Year-to-date Change: -30.3% | |
| YI Links: Profile News Message Board | |
| Charts:- Daily , Weekly | |
| Add YI to Watchlist: View: Get Complete YI Trend Analysis ➞ | |
 | NIO NIO Limited |
| Sector: Consumer Staples | |
| SubSector: Auto Manufacturers - Major | |
| MarketCap: 2679.71 Millions | |
| Recent Price: 4.08 Market Intelligence Score: 17 | |
| Day Percent Change: 1.88% Day Change: 0.08 | |
| Week Change: 7.24% Year-to-date Change: -55.1% | |
| NIO Links: Profile News Message Board | |
| Charts:- Daily , Weekly | |
| Add NIO to Watchlist: View: Get Complete NIO Trend Analysis ➞ | |
 | ZLAB Zai Lab Limited |
| Sector: Health Care | |
| SubSector: Biotechnology | |
| MarketCap: 3970.35 Millions | |
| Recent Price: 15.27 Market Intelligence Score: 17 | |
| Day Percent Change: 1.87% Day Change: 0.28 | |
| Week Change: 8.45% Year-to-date Change: -44.1% | |
| ZLAB Links: Profile News Message Board | |
| Charts:- Daily , Weekly | |
| Add ZLAB to Watchlist: View: Get Complete ZLAB Trend Analysis ➞ | |
 | QFIN 360 Finance, Inc. |
| Sector: Financials | |
| SubSector: Credit Services | |
| MarketCap: 956.208 Millions | |
| Recent Price: 18.63 Market Intelligence Score: 53 | |
| Day Percent Change: 1.86% Day Change: 0.34 | |
| Week Change: 3.5% Year-to-date Change: 17.8% | |
| QFIN Links: Profile News Message Board | |
| Charts:- Daily , Weekly | |
| Add QFIN to Watchlist: View: Get Complete QFIN Trend Analysis ➞ | |
 | LX LexinFintech Holdings Ltd. |
| Sector: Financials | |
| SubSector: Credit Services | |
| MarketCap: 1674.18 Millions | |
| Recent Price: 1.68 Market Intelligence Score: 17 | |
| Day Percent Change: 1.82% Day Change: 0.03 | |
| Week Change: 3.07% Year-to-date Change: -8.7% | |
| LX Links: Profile News Message Board | |
| Charts:- Daily , Weekly | |
| Add LX to Watchlist: View: Get Complete LX Trend Analysis ➞ | |
 | ASX ASE Technology Holding Co., Ltd. |
| Sector: Technology | |
| SubSector: Semiconductor Equipment & Materials | |
| MarketCap: 8513.18 Millions | |
| Recent Price: 10.36 Market Intelligence Score: 51 | |
| Day Percent Change: 1.77% Day Change: 0.18 | |
| Week Change: 3.08% Year-to-date Change: 10.1% | |
| ASX Links: Profile News Message Board | |
| Charts:- Daily , Weekly | |
| Add ASX to Watchlist: View: Get Complete ASX Trend Analysis ➞ | |
| To view more stocks, click on Next / Previous arrows or select different range: 0 - 25 , 25 - 50 , 50 - 75 , 75 - 100 , 100 - 125 , 125 - 150 , 150 - 175 , 175 - 200 , 200 - 225 | ||
| Click To Change The Sort Order: By Market Cap or Company Size Performance: Year-to-date, Week and Day | |
| Select Chart Type: | ||
|
Best Stocks Today 12Stocks.com |
© 2024 12Stocks.com Terms & Conditions Privacy Contact Us
All Information Provided Only For Education And Not To Be Used For Investing or Trading. See Terms & Conditions


One More Thing ... Get Best Stocks Delivered Daily!
Never Ever Miss A Move With Our Top Ten Stocks Lists
Find Best Stocks In Any Market - Bull or Bear Market
Take A Peek At Our Top Ten Stocks Lists: Daily, Weekly, Year-to-Date & Top Trends
Find Best Stocks In Any Market - Bull or Bear Market
Take A Peek At Our Top Ten Stocks Lists: Daily, Weekly, Year-to-Date & Top Trends
Asia Stocks With Best Up Trends [0-bearish to 100-bullish]: Yatsen Holding[100], MINISO [100], JD.com [100], Full Truck[100], Baozun [95], TAL Education[90], New Oriental[90], ICICI Bank[90], RLX [90], DouYu [88], Yum China[85]
Best Asia Stocks Year-to-Date:
U Power[2902.23%], DouYu [792.11%], MicroCloud Hologram[612.23%], China Liberal[498.43%], Yatsen Holding[449.48%], Zhongchao [365.63%], Uxin [131.81%], QuantaSing [106.48%], GigaCloud [101.37%], Cheetah Mobile[86.4%], Bright Scholar[64%] Best Asia Stocks This Week:
Cheetah Mobile[20.06%], Regencell Bioscience[18.02%], So-Young [13.3%], Pinduoduo [12.64%], iQIYI [12.24%], Hutchison China[11.89%], Yatsen Holding[11.2%], Baozun [10.56%], Tuya [9.55%], Hywin [8.88%], Zai Lab[8.45%] Best Asia Stocks Daily:
Cheetah Mobile[13.94%], 17 Education[11.94%], U Power[10.70%], Hutchison China[8.91%], Cango [7.46%], Zhongchao [6.92%], Uxin [6.91%], Xiao-I [6.77%], iQIYI [6.38%], Aesthetic Medical[6.13%], Dingdong (Cayman)[6.09%]