
 Login Sign Up


| |||||
 |  | ||||

| 12Stocks.com Market Intelligence |
Best Asia Stocks
|
|
| Quick Read: Top Asia Stocks By Performances & Trends: Daily, Weekly, Year-to-Date, Market Cap (Size) & Technical Trends | |||
| Best Asia Views: Quick Browse View, Summary & Slide Show | |||
| 12Stocks.com Asia Stocks Performances & Trends Daily | |||||||||
|
|  The overall market intelligence score is 31 (0-bearish to 100-bullish) which puts Asia index in short term bearish to neutral trend. The market intelligence score from previous trading session is 58 and hence a deterioration of trend.
| ||||||||
Here are the market intelligence trend scores of the most requested Asia stocks at 12Stocks.com (click stock name for detailed review):
|


| Consider signing up for our daily 12Stocks.com "Best Stocks Newsletter". You will never ever miss a big stock move again! |
| 12Stocks.com: Top Performing Asia Index Stocks | ||||||||||||||||||||||||||||||||||||||||||||||||
 The top performing Asia Index stocks year to date are
Now, more recently, over last week, the top performing Asia Index stocks on the move are


|
||||||||||||||||||||||||||||||||||||||||||||||||
| 12Stocks.com: Investing in Asia Index with Stocks | |
|
The following table helps investors and traders sort through current performance and trends (as measured by market intelligence score) of various
stocks in the Asia Index. Quick View: Move mouse or cursor over stock symbol (ticker) to view short-term technical chart and over stock name to view long term chart. Click on  to add stock symbol to your watchlist and to add stock symbol to your watchlist and  to view watchlist. Click on any ticker or stock name for detailed market intelligence report for that stock. to view watchlist. Click on any ticker or stock name for detailed market intelligence report for that stock. |
12Stocks.com Performance of Stocks in Asia Index
| Ticker | Stock Name | Watchlist | Category | Recent Price | Market Intelligence Score | Change % | YTD Change% |
| YSG | Yatsen Holding |   | Services & Goods | 4.41 | 100 | 4.01% | 502.79% |
| BZ | Kanzhun | | Industrials | 19.60 | 100 | 3.29% | 18.61% |
| JD | JD.com | | Technology | 28.59 | 100 | 1.13% | -1.04% |
| DADA | Dada Nexus | | Services & Goods | 2.02 | 100 | 0.75% | -39.31% |
| ZTO | ZTO Express | | Transports | 21.21 | 100 | 0.66% | -0.33% |
| BABA | Alibaba | | Services & Goods | 75.11 | 100 | 0.64% | -3.10% |
| TOUR | Tuniu | | Consumer Staples | 0.83 | 95 | 3.06% | 24.41% |
| BZUN | Baozun | | Services & Goods | 2.59 | 95 | -2.63% | -5.47% |
| MOGU | MOGU | | Services & Goods | 1.93 | 93 | 8.43% | 1.05% |
| YMM | Full Truck | | Technology | 8.37 | 93 | 0.84% | 19.66% |
| ICG | Intchains | | Technology | 9.05 | 93 | -9.44% | -26.45% |
| UCAR | U Power | | Services & Goods | 5.29 | 93 | -5.20% | NA |
| MNSO | MINISO | | Services & Goods | 22.09 | 93 | -2.17% | 8.28% |
| WIMI | WiMi Hologram | | Technology | 0.93 | 93 | -19.01% | 15.70% |
| GURE | Gulf Resources | | Materials | 1.54 | 93 | 4.14% | -6.91% |
| YUMC | Yum China | | Services & Goods | 39.04 | 93 | 0.62% | -7.99% |
| TAL | TAL Education | | Services & Goods | 13.35 | 90 | 8.89% | 5.70% |
| IBN | ICICI Bank | | Financials | 26.60 | 90 | 1.57% | 11.58% |
| XNET | Xunlei | | Technology | 1.55 | 90 | 0.00% | -4.01% |
| LU | Lufax Holding | | Financials | 4.51 | 90 | -0.77% | 47.07% |
| CMCM | Cheetah Mobile | | Technology | 4.29 | 88 | 8.33% | 88.16% |
| NCTY | The9 | | Technology | 6.74 | 88 | 0.30% | -10.01% |
| MTC | Mmtec | | Financials | 2.95 | 88 | -18.40% | 183.65% |
| QD | Qudian | | Technology | 2.43 | 88 | -1.22% | 19.12% |
| DOYU | DouYu | | Technology | 8.47 | 88 | -1.17% | 791.58% |
| To view more stocks, click on Next / Previous arrows or select different range: 0 - 25 , 25 - 50 , 50 - 75 , 75 - 100 , 100 - 125 , 125 - 150 , 150 - 175 , 175 - 200 , 200 - 225 | ||
 | Click To Change The Sort Order: By Market Cap or Company Size Performance: Year-to-date, Week and Day |  |
|
Get the most comprehensive stock market coverage daily at 12Stocks.com ➞ Best Stocks Today ➞ Best Stocks Weekly ➞ Best Stocks Year-to-Date ➞ Best Stocks Trends ➞  Best Stocks Today 12Stocks.com Best Nasdaq Stocks ➞ Best S&P 500 Stocks ➞ Best Tech Stocks ➞ Best Biotech Stocks ➞ |
| Detailed Overview of Asia Stocks |
| Asia Technical Overview, Leaders & Laggards, Top Asia ETF Funds & Detailed Asia Stocks List, Charts, Trends & More |
| Asia: Technical Analysis, Trends & YTD Performance | |
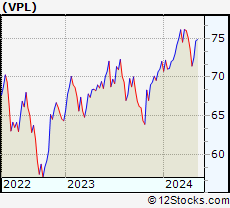
 VPL Weekly Chart |
|
| Long Term Trend: Good | |
| Medium Term Trend: Not Good | |
 VPL Daily Chart |
|
| Short Term Trend: Deteriorating | |
| Overall Trend Score: 31 | |
| YTD Performance: -0.01% | |
| **Trend Scores & Views Are Only For Educational Purposes And Not For Investing | |
| 12Stocks.com: Investing in Asia Index using Exchange Traded Funds | |
|
The following table shows list of key exchange traded funds (ETF) that
help investors play Asia stock market. For detailed view, check out our ETF Funds section of our website. Quick View: Move mouse or cursor over ETF symbol (ticker) to view short-term technical chart and over ETF name to view long term chart. Click on ticker or stock name for detailed view. Click on to add stock symbol to your watchlist and to view watchlist. |
12Stocks.com List of ETFs that track Asia Index
| Ticker | ETF Name | Watchlist | Recent Price | Market Intelligence Score | Change % | Week % | Year-to-date % |
| VPL | Pacific | | 72.02 | 31 | -0.94 | 0.83 | -0.01% |
| EEMA | Emerging Markets Asia | | 68.17 | 68 | 0.50 | 3.15 | 3.12% |
| AIA | Asia 50 | | 60.82 | 61 | 0.26 | 4.66 | 4.92% |
| AAXJ | All Country Asia | | 67.68 | 78 | 0.40 | 3.34 | 1.67% |
| GMF | Emerging Asia Pacific | | 104.07 | 60 | 0.54 | 2.94 | 2.97% |
| EPP | Pacific ex Japan | | 41.81 | 78 | -0.12 | 2.48 | -3.69% |
| ASEA | Southeast Asia | | 14.82 | 63 | -0.34 | 2.28 | -1.73% |
| DVYA | Asia/Pacific Dividend | | 36.13 | 66 | -0.15 | 2.19 | 1.05% |
| IPAC | Core Pacific | | 59.94 | 36 | -1.12 | 0.59 | 0.72% |
| FXI | China Large-Cap | | 25.44 | 100 | 0.67 | 5.96 | 5.87% |
| EWY | South Korea | | 62.90 | 51 | -0.41 | 2.58 | -4.01% |
| EWT | Taiwan | | 46.54 | 56 | 0.02 | 1.82 | 1.11% |
| EWJ | Japan | | 66.56 | 23 | -1.55 | 0.11 | 3.77% |
| EWH | Hong Kong | | 15.71 | 80 | 1.35 | 6.87 | -9.56% |
| EWS | Singapore | | 18.96 | 100 | 0.42 | 4.12 | 1.39% |
| EWM | Malaysia | | 22.05 | 78 | -0.18 | 1.33 | 3.76% |
| EPHE | Philippines | | 25.21 | 25 | 0.00 | 1.9 | -3% |
| EIDO | Indonesia | | 20.86 | 25 | -0.76 | 0.38 | -6.54% |
| THD | Thailand | | 57.59 | 45 | -0.19 | 1.75 | -9.82% |
| VNM | Vietnam | | 12.25 | 25 | 0.33 | 3.38 | -5.19% |
| 12Stocks.com: Charts, Trends, Fundamental Data and Performances of Asia Stocks | |
|
We now take in-depth look at all Asia stocks including charts, multi-period performances and overall trends (as measured by market intelligence score). One can sort Asia stocks (click link to choose) by Daily, Weekly and by Year-to-Date performances. Also, one can sort by size of the company or by market capitalization. |
| Select Your Default Chart Type: | |||||
| |||||
| Click on stock symbol or name for detailed view. Click on to add stock symbol to your watchlist and to view watchlist. Quick View: Move mouse or cursor over "Daily" to quickly view daily technical stock chart and over "Weekly" to view weekly technical stock chart. | |||||

 | YSG Yatsen Holding Limited |
| Sector: Services & Goods | |
| SubSector: Specialty Retail | |
| MarketCap: 11827 Millions | |
| Recent Price: 4.41 Market Intelligence Score: 100 | |
| Day Percent Change: 4.01% Day Change: 0.17 | |
| Week Change: 21.99% Year-to-date Change: 502.8% | |
| YSG Links: Profile News Message Board | |
| Charts:- Daily , Weekly | |
| Add YSG to Watchlist: View: Get Complete YSG Trend Analysis ➞ | |
 | BZ Kanzhun Limited |
| Sector: Industrials | |
| SubSector: Staffing & Employment Services | |
| MarketCap: 6680 Millions | |
| Recent Price: 19.60 Market Intelligence Score: 100 | |
| Day Percent Change: 3.29% Day Change: 0.63 | |
| Week Change: 9.87% Year-to-date Change: 18.6% | |
| BZ Links: Profile News Message Board | |
| Charts:- Daily , Weekly | |
| Add BZ to Watchlist: View: Get Complete BZ Trend Analysis ➞ | |
 | JD JD.com, Inc. |
| Sector: Technology | |
| SubSector: Internet Information Providers | |
| MarketCap: 59907.3 Millions | |
| Recent Price: 28.59 Market Intelligence Score: 100 | |
| Day Percent Change: 1.13% Day Change: 0.32 | |
| Week Change: 12.07% Year-to-date Change: -1.0% | |
| JD Links: Profile News Message Board | |
| Charts:- Daily , Weekly | |
| Add JD to Watchlist: View: Get Complete JD Trend Analysis ➞ | |
 | DADA Dada Nexus Limited |
| Sector: Services & Goods | |
| SubSector: Internet Retail | |
| MarketCap: 98527 Millions | |
| Recent Price: 2.02 Market Intelligence Score: 100 | |
| Day Percent Change: 0.75% Day Change: 0.02 | |
| Week Change: 6.9% Year-to-date Change: -39.3% | |
| DADA Links: Profile News Message Board | |
| Charts:- Daily , Weekly | |
| Add DADA to Watchlist: View: Get Complete DADA Trend Analysis ➞ | |
 | ZTO ZTO Express (Cayman) Inc. |
| Sector: Transports | |
| SubSector: Air Delivery & Freight Services | |
| MarketCap: 20507 Millions | |
| Recent Price: 21.21 Market Intelligence Score: 100 | |
| Day Percent Change: 0.66% Day Change: 0.14 | |
| Week Change: 6.37% Year-to-date Change: -0.3% | |
| ZTO Links: Profile News Message Board | |
| Charts:- Daily , Weekly | |
| Add ZTO to Watchlist: View: Get Complete ZTO Trend Analysis ➞ | |
 | BABA Alibaba Group Holding Limited |
| Sector: Services & Goods | |
| SubSector: Specialty Retail, Other | |
| MarketCap: 522666 Millions | |
| Recent Price: 75.11 Market Intelligence Score: 100 | |
| Day Percent Change: 0.64% Day Change: 0.48 | |
| Week Change: 8.74% Year-to-date Change: -3.1% | |
| BABA Links: Profile News Message Board | |
| Charts:- Daily , Weekly | |
| Add BABA to Watchlist: View: Get Complete BABA Trend Analysis ➞ | |
 | TOUR Tuniu Corporation |
| Sector: Consumer Staples | |
| SubSector: Recreational Goods, Other | |
| MarketCap: 124.459 Millions | |
| Recent Price: 0.83 Market Intelligence Score: 95 | |
| Day Percent Change: 3.06% Day Change: 0.02 | |
| Week Change: 4.35% Year-to-date Change: 24.4% | |
| TOUR Links: Profile News Message Board | |
| Charts:- Daily , Weekly | |
| Add TOUR to Watchlist: View: Get Complete TOUR Trend Analysis ➞ | |
 | BZUN Baozun Inc. |
| Sector: Services & Goods | |
| SubSector: Catalog & Mail Order Houses | |
| MarketCap: 1668.92 Millions | |
| Recent Price: 2.59 Market Intelligence Score: 95 | |
| Day Percent Change: -2.63% Day Change: -0.07 | |
| Week Change: 11.64% Year-to-date Change: -5.5% | |
| BZUN Links: Profile News Message Board | |
| Charts:- Daily , Weekly | |
| Add BZUN to Watchlist: View: Get Complete BZUN Trend Analysis ➞ | |
 | MOGU MOGU Inc. |
| Sector: Services & Goods | |
| SubSector: Specialty Retail, Other | |
| MarketCap: 168.844 Millions | |
| Recent Price: 1.93 Market Intelligence Score: 93 | |
| Day Percent Change: 8.43% Day Change: 0.15 | |
| Week Change: -3.02% Year-to-date Change: 1.1% | |
| MOGU Links: Profile News Message Board | |
| Charts:- Daily , Weekly | |
| Add MOGU to Watchlist: View: Get Complete MOGU Trend Analysis ➞ | |
 | YMM Full Truck Alliance Co. Ltd. |
| Sector: Technology | |
| SubSector: Software - Application | |
| MarketCap: 6960 Millions | |
| Recent Price: 8.37 Market Intelligence Score: 93 | |
| Day Percent Change: 0.84% Day Change: 0.07 | |
| Week Change: 7.72% Year-to-date Change: 19.7% | |
| YMM Links: Profile News Message Board | |
| Charts:- Daily , Weekly | |
| Add YMM to Watchlist: View: Get Complete YMM Trend Analysis ➞ | |
 | ICG Intchains Group Limited |
| Sector: Technology | |
| SubSector: Semiconductors | |
| MarketCap: 450 Millions | |
| Recent Price: 9.05 Market Intelligence Score: 93 | |
| Day Percent Change: -9.44% Day Change: -0.94 | |
| Week Change: 9% Year-to-date Change: -26.5% | |
| ICG Links: Profile News Message Board | |
| Charts:- Daily , Weekly | |
| Add ICG to Watchlist: View: Get Complete ICG Trend Analysis ➞ | |
 | UCAR U Power Limited |
| Sector: Services & Goods | |
| SubSector: Auto & Truck Dealerships | |
| MarketCap: 372 Millions | |
| Recent Price: 5.29 Market Intelligence Score: 93 | |
| Day Percent Change: -5.20% Day Change: -0.29 | |
| Week Change: 2.92% Year-to-date Change: 2,852.0% | |
| UCAR Links: Profile News Message Board | |
| Charts:- Daily , Weekly | |
| Add UCAR to Watchlist: View: Get Complete UCAR Trend Analysis ➞ | |
 | MNSO MINISO Group Holding Limited |
| Sector: Services & Goods | |
| SubSector: Specialty Retail | |
| MarketCap: 69427 Millions | |
| Recent Price: 22.09 Market Intelligence Score: 93 | |
| Day Percent Change: -2.17% Day Change: -0.49 | |
| Week Change: 7.73% Year-to-date Change: 8.3% | |
| MNSO Links: Profile News Message Board | |
| Charts:- Daily , Weekly | |
| Add MNSO to Watchlist: View: Get Complete MNSO Trend Analysis ➞ | |
 | WIMI WiMi Hologram Cloud Inc. |
| Sector: Technology | |
| SubSector: Advertising Agencies | |
| MarketCap: 41837 Millions | |
| Recent Price: 0.93 Market Intelligence Score: 93 | |
| Day Percent Change: -19.01% Day Change: -0.22 | |
| Week Change: 33.51% Year-to-date Change: 15.7% | |
| WIMI Links: Profile News Message Board | |
| Charts:- Daily , Weekly | |
| Add WIMI to Watchlist: View: Get Complete WIMI Trend Analysis ➞ | |
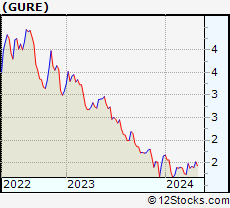 | GURE Gulf Resources, Inc. |
| Sector: Materials | |
| SubSector: Specialty Chemicals | |
| MarketCap: 40.8357 Millions | |
| Recent Price: 1.54 Market Intelligence Score: 93 | |
| Day Percent Change: 4.14% Day Change: 0.06 | |
| Week Change: 10.5% Year-to-date Change: -6.9% | |
| GURE Links: Profile News Message Board | |
| Charts:- Daily , Weekly | |
| Add GURE to Watchlist: View: Get Complete GURE Trend Analysis ➞ | |
 | YUMC Yum China Holdings, Inc. |
| Sector: Services & Goods | |
| SubSector: Restaurants | |
| MarketCap: 16284.5 Millions | |
| Recent Price: 39.04 Market Intelligence Score: 93 | |
| Day Percent Change: 0.62% Day Change: 0.24 | |
| Week Change: 5.23% Year-to-date Change: -8.0% | |
| YUMC Links: Profile News Message Board | |
| Charts:- Daily , Weekly | |
| Add YUMC to Watchlist: View: Get Complete YUMC Trend Analysis ➞ | |
 | TAL TAL Education Group |
| Sector: Services & Goods | |
| SubSector: Education & Training Services | |
| MarketCap: 30103.1 Millions | |
| Recent Price: 13.35 Market Intelligence Score: 90 | |
| Day Percent Change: 8.89% Day Change: 1.09 | |
| Week Change: 16.8% Year-to-date Change: 5.7% | |
| TAL Links: Profile News Message Board | |
| Charts:- Daily , Weekly | |
| Add TAL to Watchlist: View: Get Complete TAL Trend Analysis ➞ | |
 | IBN ICICI Bank Limited |
| Sector: Financials | |
| SubSector: Money Center Banks | |
| MarketCap: 31194.1 Millions | |
| Recent Price: 26.60 Market Intelligence Score: 90 | |
| Day Percent Change: 1.57% Day Change: 0.41 | |
| Week Change: 3.58% Year-to-date Change: 11.6% | |
| IBN Links: Profile News Message Board | |
| Charts:- Daily , Weekly | |
| Add IBN to Watchlist: View: Get Complete IBN Trend Analysis ➞ | |
 | XNET Xunlei Limited |
| Sector: Technology | |
| SubSector: Application Software | |
| MarketCap: 203.662 Millions | |
| Recent Price: 1.55 Market Intelligence Score: 90 | |
| Day Percent Change: 0.00% Day Change: 0.00 | |
| Week Change: 5.07% Year-to-date Change: -4.0% | |
| XNET Links: Profile News Message Board | |
| Charts:- Daily , Weekly | |
| Add XNET to Watchlist: View: Get Complete XNET Trend Analysis ➞ | |
 | LU Lufax Holding Ltd |
| Sector: Financials | |
| SubSector: Credit Services | |
| MarketCap: 33457 Millions | |
| Recent Price: 4.51 Market Intelligence Score: 90 | |
| Day Percent Change: -0.77% Day Change: -0.04 | |
| Week Change: 3.79% Year-to-date Change: 47.1% | |
| LU Links: Profile News Message Board | |
| Charts:- Daily , Weekly | |
| Add LU to Watchlist: View: Get Complete LU Trend Analysis ➞ | |
 | CMCM Cheetah Mobile Inc. |
| Sector: Technology | |
| SubSector: Application Software | |
| MarketCap: 343.362 Millions | |
| Recent Price: 4.29 Market Intelligence Score: 88 | |
| Day Percent Change: 8.33% Day Change: 0.33 | |
| Week Change: 21.19% Year-to-date Change: 88.2% | |
| CMCM Links: Profile News Message Board | |
| Charts:- Daily , Weekly | |
| Add CMCM to Watchlist: View: Get Complete CMCM Trend Analysis ➞ | |
 | NCTY The9 Limited |
| Sector: Technology | |
| SubSector: Multimedia & Graphics Software | |
| MarketCap: 19.7586 Millions | |
| Recent Price: 6.74 Market Intelligence Score: 88 | |
| Day Percent Change: 0.30% Day Change: 0.02 | |
| Week Change: 10.86% Year-to-date Change: -10.0% | |
| NCTY Links: Profile News Message Board | |
| Charts:- Daily , Weekly | |
| Add NCTY to Watchlist: View: Get Complete NCTY Trend Analysis ➞ | |
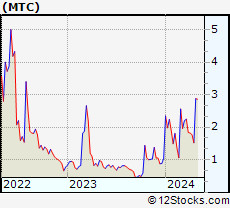 | MTC Mmtec, Inc. |
| Sector: Financials | |
| SubSector: Asset Management | |
| MarketCap: 22.2203 Millions | |
| Recent Price: 2.95 Market Intelligence Score: 88 | |
| Day Percent Change: -18.40% Day Change: -0.67 | |
| Week Change: 94.08% Year-to-date Change: 183.7% | |
| MTC Links: Profile News Message Board | |
| Charts:- Daily , Weekly | |
| Add MTC to Watchlist: View: Get Complete MTC Trend Analysis ➞ | |
 | QD Qudian Inc. |
| Sector: Technology | |
| SubSector: Information Technology Services | |
| MarketCap: 544.968 Millions | |
| Recent Price: 2.43 Market Intelligence Score: 88 | |
| Day Percent Change: -1.22% Day Change: -0.03 | |
| Week Change: 6.58% Year-to-date Change: 19.1% | |
| QD Links: Profile News Message Board | |
| Charts:- Daily , Weekly | |
| Add QD to Watchlist: View: Get Complete QD Trend Analysis ➞ | |
 | DOYU DouYu International Holdings Limited |
| Sector: Technology | |
| SubSector: Internet Information Providers | |
| MarketCap: 2483 Millions | |
| Recent Price: 8.47 Market Intelligence Score: 88 | |
| Day Percent Change: -1.17% Day Change: -0.10 | |
| Week Change: 5.22% Year-to-date Change: 791.6% | |
| DOYU Links: Profile News Message Board | |
| Charts:- Daily , Weekly | |
| Add DOYU to Watchlist: View: Get Complete DOYU Trend Analysis ➞ | |
| To view more stocks, click on Next / Previous arrows or select different range: 0 - 25 , 25 - 50 , 50 - 75 , 75 - 100 , 100 - 125 , 125 - 150 , 150 - 175 , 175 - 200 , 200 - 225 | ||
| Click To Change The Sort Order: By Market Cap or Company Size Performance: Year-to-date, Week and Day | |
| Select Chart Type: | ||
|
Best Stocks Today 12Stocks.com |
© 2024 12Stocks.com Terms & Conditions Privacy Contact Us
All Information Provided Only For Education And Not To Be Used For Investing or Trading. See Terms & Conditions


One More Thing ... Get Best Stocks Delivered Daily!
Never Ever Miss A Move With Our Top Ten Stocks Lists
Find Best Stocks In Any Market - Bull or Bear Market
Take A Peek At Our Top Ten Stocks Lists: Daily, Weekly, Year-to-Date & Top Trends
Find Best Stocks In Any Market - Bull or Bear Market
Take A Peek At Our Top Ten Stocks Lists: Daily, Weekly, Year-to-Date & Top Trends
Asia Stocks With Best Up Trends [0-bearish to 100-bullish]: Yatsen Holding[100], Kanzhun [100], JD.com [100], Dada Nexus[100], ZTO Express[100], Alibaba [100], Baozun [95], MOGU [93], Full Truck[93], MINISO [93], U Power[93]
Best Asia Stocks Year-to-Date:
U Power[2852.01%], DouYu [791.58%], MicroCloud Hologram[668.35%], China Liberal[520.81%], Yatsen Holding[502.79%], Zhongchao [312.22%], Uxin [172.47%], QuantaSing [103.7%], GigaCloud [97.54%], Cheetah Mobile[88.16%], Yiren Digital[61.54%] Best Asia Stocks This Week:
WiMi Hologram[33.51%], Yatsen Holding[21.99%], Cheetah Mobile[21.19%], iQIYI [17.99%], Aesthetic Medical[17.77%], TAL Education[16.8%], Golden Heaven[15.91%], Hutchison China[15.16%], BeiGene [14.7%], Bilibili [14.67%], TOP Financial[14.04%] Best Asia Stocks Daily:
Boqii Holding[15.69%], MicroCloud Hologram[13.86%], TAL Education[8.89%], MOGU [8.43%], Cheetah Mobile[8.33%], Shengfeng Development[7.69%], Viomi [7.13%], Sify [5.88%], Fangdd Network[5.41%], Secoo Holding[5.19%], 21Vianet [5.06%]