
 Login Sign Up


| |||||
 |  | ||||

| 12Stocks.com Market Intelligence |
Best Asia Stocks
|
|
| Quick Read: Top Asia Stocks By Performances & Trends: Daily, Weekly, Year-to-Date, Market Cap (Size) & Technical Trends | |||
| Best Asia Views: Quick Browse View, Summary & Slide Show | |||
| 12Stocks.com Asia Stocks Performances & Trends Daily | |||||||||
|
|  The overall market intelligence score is 51 (0-bearish to 100-bullish) which puts Asia index in short term neutral trend. The market intelligence score from previous trading session is 31 and hence an improvement of trend.
| ||||||||
Here are the market intelligence trend scores of the most requested Asia stocks at 12Stocks.com (click stock name for detailed review):
|


| Consider signing up for our daily 12Stocks.com "Best Stocks Newsletter". You will never ever miss a big stock move again! |
| 12Stocks.com: Top Performing Asia Index Stocks | ||||||||||||||||||||||||||||||||||||||||||||||||
 The top performing Asia Index stocks year to date are
Now, more recently, over last week, the top performing Asia Index stocks on the move are


|
||||||||||||||||||||||||||||||||||||||||||||||||
| 12Stocks.com: Investing in Asia Index with Stocks | |
|
The following table helps investors and traders sort through current performance and trends (as measured by market intelligence score) of various
stocks in the Asia Index. Quick View: Move mouse or cursor over stock symbol (ticker) to view short-term technical chart and over stock name to view long term chart. Click on  to add stock symbol to your watchlist and to add stock symbol to your watchlist and  to view watchlist. Click on any ticker or stock name for detailed market intelligence report for that stock. to view watchlist. Click on any ticker or stock name for detailed market intelligence report for that stock. |
12Stocks.com Performance of Stocks in Asia Index
| Ticker | Stock Name | Watchlist | Category | Recent Price | Market Intelligence Score | Change % | YTD Change% |
| RERE | ATRenew |   | Services & Goods | 1.98 | 75 | 22.98 | 4.76% |
| IMTE | Integrated Media | | Technology | 2.33 | 14 | 17.97 | -12.08% |
| CCM | Concord Medical | | Health Care | 0.59 | 35 | 17.13 | -46.35% |
| ZCMD | Zhongchao | | Health Care | 1.75 | 38 | 15.95 | 377.95% |
| HUIZ | Huize Holding | | Financials | 0.60 | 57 | 14.77 | -33.69% |
| XPEV | XPeng | | Services & Goods | 7.89 | 64 | 12.38 | -45.89% |
| NIU | Niu | | Consumer Staples | 2.25 | 93 | 10.54 | 2.97% |
| WIMI | WiMi Hologram | | Technology | 1.02 | 100 | 10.05 | 27.33% |
| YSG | Yatsen Holding | | Services & Goods | 4.82 | 100 | 9.30 | 558.83% |
| KC | Kingsoft Cloud | | Technology | 3.13 | 95 | 9.04 | -17.17% |
| NIO | NIO | | Consumer Staples | 4.49 | 34 | 8.72 | -50.50% |
| DTSS | Datasea | | Industrials | 8.27 | 53 | 8.67 | NA |
| RCON | Recon | | Energy | 0.09 | 10 | 8.66 | -61.84% |
| FEDU | Four Seasons | | Services & Goods | 9.45 | 7 | 8.62 | -3.08% |
| BEKE | KE | | Financials | 14.83 | 95 | 8.17 | -8.51% |
| BHAT | Fujian Blue | | Technology | 1.20 | 83 | 8.11 | 25.26% |
| TUYA | Tuya | | Technology | 1.74 | 42 | 8.07 | -24.18% |
| GDS | GDS | | Technology | 7.76 | 85 | 7.78 | -14.91% |
| KRKR | 36Kr | | Technology | 0.38 | 42 | 7.69 | -32.70% |
| MNSO | MINISO | | Services & Goods | 23.71 | 100 | 7.33 | 16.23% |
| LI | Li Auto | | Services & Goods | 25.12 | 32 | 7.30 | -32.91% |
| OCFT | OneConnect Financial | | Technology | 1.96 | 42 | 7.16 | -37.78% |
| SFWL | Shengfeng Development | | Industrials | 1.65 | 17 | 7.14 | -40.00% |
| BNR | Burning Rock | | Health Care | 0.88 | 64 | 7.09 | -8.90% |
| BZUN | Baozun | | Services & Goods | 2.77 | 95 | 6.95 | 1.09% |
| To view more stocks, click on Next / Previous arrows or select different range: 0 - 25 , 25 - 50 , 50 - 75 , 75 - 100 , 100 - 125 , 125 - 150 , 150 - 175 , 175 - 200 , 200 - 225 | ||
 | Click To Change The Sort Order: By Market Cap or Company Size Performance: Year-to-date, Week and Day |  |
|
Get the most comprehensive stock market coverage daily at 12Stocks.com ➞ Best Stocks Today ➞ Best Stocks Weekly ➞ Best Stocks Year-to-Date ➞ Best Stocks Trends ➞  Best Stocks Today 12Stocks.com Best Nasdaq Stocks ➞ Best S&P 500 Stocks ➞ Best Tech Stocks ➞ Best Biotech Stocks ➞ |
| Detailed Overview of Asia Stocks |
| Asia Technical Overview, Leaders & Laggards, Top Asia ETF Funds & Detailed Asia Stocks List, Charts, Trends & More |
| Asia: Technical Analysis, Trends & YTD Performance | |
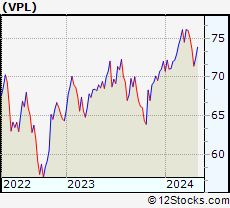
 VPL Weekly Chart |
|
| Long Term Trend: Good | |
| Medium Term Trend: Not Good | |
 VPL Daily Chart |
|
| Short Term Trend: Very Good | |
| Overall Trend Score: 51 | |
| YTD Performance: 0.67% | |
| **Trend Scores & Views Are Only For Educational Purposes And Not For Investing | |
| 12Stocks.com: Investing in Asia Index using Exchange Traded Funds | |
|
The following table shows list of key exchange traded funds (ETF) that
help investors play Asia stock market. For detailed view, check out our ETF Funds section of our website. Quick View: Move mouse or cursor over ETF symbol (ticker) to view short-term technical chart and over ETF name to view long term chart. Click on ticker or stock name for detailed view. Click on to add stock symbol to your watchlist and to view watchlist. |
12Stocks.com List of ETFs that track Asia Index
| Ticker | ETF Name | Watchlist | Recent Price | Market Intelligence Score | Change % | Week % | Year-to-date % |
| VPL | Pacific | | 72.51 | 51 | 0.68 | 1.51 | 0.67% |
| EEMA | Emerging Markets Asia | | 68.75 | 68 | 0.85 | 4.02 | 3.99% |
| AIA | Asia 50 | | 61.86 | 68 | 1.71 | 6.45 | 6.71% |
| AAXJ | All Country Asia | | 68.33 | 85 | 0.96 | 4.34 | 2.64% |
| GMF | Emerging Asia Pacific | | 104.99 | 60 | 0.88 | 3.85 | 3.88% |
| EPP | Pacific ex Japan | | 42.10 | 85 | 0.69 | 3.19 | -3.02% |
| ASEA | Southeast Asia | | 14.73 | 63 | -0.61 | 1.66 | -2.33% |
| DVYA | Asia/Pacific Dividend | | 36.44 | 73 | 0.83 | 3.04 | 1.89% |
| IPAC | Core Pacific | | 60.47 | 43 | 0.88 | 1.48 | 1.61% |
| FXI | China Large-Cap | | 25.87 | 100 | 1.69 | 7.75 | 7.66% |
| EWY | South Korea | | 63.34 | 58 | 0.70 | 3.29 | -3.34% |
| EWT | Taiwan | | 47.10 | 68 | 1.20 | 3.04 | 2.32% |
| EWJ | Japan | | 67.13 | 51 | 0.86 | 0.96 | 4.66% |
| EWH | Hong Kong | | 15.98 | 100 | 1.72 | 8.71 | -8% |
| EWS | Singapore | | 18.95 | 93 | -0.05 | 4.06 | 1.34% |
| EWM | Malaysia | | 22.28 | 93 | 1.04 | 2.39 | 4.85% |
| EPHE | Philippines | | 25.37 | 32 | 0.63 | 2.55 | -2.39% |
| EIDO | Indonesia | | 20.31 | 25 | -2.64 | -2.26 | -9.01% |
| THD | Thailand | | 57.74 | 52 | 0.26 | 2.01 | -9.58% |
| VNM | Vietnam | | 12.30 | 32 | 0.41 | 3.8 | -4.8% |
| 12Stocks.com: Charts, Trends, Fundamental Data and Performances of Asia Stocks | |
|
We now take in-depth look at all Asia stocks including charts, multi-period performances and overall trends (as measured by market intelligence score). One can sort Asia stocks (click link to choose) by Daily, Weekly and by Year-to-Date performances. Also, one can sort by size of the company or by market capitalization. |
| Select Your Default Chart Type: | |||||
| |||||
| Click on stock symbol or name for detailed view. Click on to add stock symbol to your watchlist and to view watchlist. Quick View: Move mouse or cursor over "Daily" to quickly view daily technical stock chart and over "Weekly" to view weekly technical stock chart. | |||||

 | RERE ATRenew Inc. |
| Sector: Services & Goods | |
| SubSector: Internet Retail | |
| MarketCap: 672 Millions | |
| Recent Price: 1.98 Market Intelligence Score: 75 | |
| Day Percent Change: 22.98% Day Change: 0.37 | |
| Week Change: 25.32% Year-to-date Change: 4.8% | |
| RERE Links: Profile News Message Board | |
| Charts:- Daily , Weekly | |
| Add RERE to Watchlist: View: Get Complete RERE Trend Analysis ➞ | |
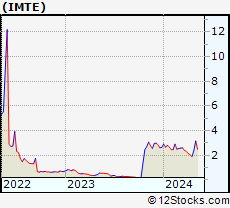 | IMTE Integrated Media Technology Limited |
| Sector: Technology | |
| SubSector: CATV Systems | |
| MarketCap: 9 Millions | |
| Recent Price: 2.33 Market Intelligence Score: 14 | |
| Day Percent Change: 17.97% Day Change: 0.35 | |
| Week Change: 22.63% Year-to-date Change: -12.1% | |
| IMTE Links: Profile News Message Board | |
| Charts:- Daily , Weekly | |
| Add IMTE to Watchlist: View: Get Complete IMTE Trend Analysis ➞ | |
 | CCM Concord Medical Services Holdings Limited |
| Sector: Health Care | |
| SubSector: Hospitals | |
| MarketCap: 138.646 Millions | |
| Recent Price: 0.59 Market Intelligence Score: 35 | |
| Day Percent Change: 17.13% Day Change: 0.09 | |
| Week Change: 7.31% Year-to-date Change: -46.4% | |
| CCM Links: Profile News Message Board | |
| Charts:- Daily , Weekly | |
| Add CCM to Watchlist: View: Get Complete CCM Trend Analysis ➞ | |
 | ZCMD Zhongchao Inc. |
| Sector: Health Care | |
| SubSector: Health Information Services | |
| MarketCap: 41487 Millions | |
| Recent Price: 1.75 Market Intelligence Score: 38 | |
| Day Percent Change: 15.95% Day Change: 0.24 | |
| Week Change: -6.68% Year-to-date Change: 378.0% | |
| ZCMD Links: Profile News Message Board | |
| Charts:- Daily , Weekly | |
| Add ZCMD to Watchlist: View: Get Complete ZCMD Trend Analysis ➞ | |
 | HUIZ Huize Holding Limited |
| Sector: Financials | |
| SubSector: Insurance Brokers | |
| MarketCap: 37157 Millions | |
| Recent Price: 0.60 Market Intelligence Score: 57 | |
| Day Percent Change: 14.77% Day Change: 0.08 | |
| Week Change: -3.27% Year-to-date Change: -33.7% | |
| HUIZ Links: Profile News Message Board | |
| Charts:- Daily , Weekly | |
| Add HUIZ to Watchlist: View: Get Complete HUIZ Trend Analysis ➞ | |
 | XPEV XPeng Inc. |
| Sector: Services & Goods | |
| SubSector: Auto Manufacturers | |
| MarketCap: 32917 Millions | |
| Recent Price: 7.89 Market Intelligence Score: 64 | |
| Day Percent Change: 12.38% Day Change: 0.87 | |
| Week Change: 12.07% Year-to-date Change: -45.9% | |
| XPEV Links: Profile News Message Board | |
| Charts:- Daily , Weekly | |
| Add XPEV to Watchlist: View: Get Complete XPEV Trend Analysis ➞ | |
 | NIU Niu Technologies |
| Sector: Consumer Staples | |
| SubSector: Auto Manufacturers - Major | |
| MarketCap: 543.271 Millions | |
| Recent Price: 2.25 Market Intelligence Score: 93 | |
| Day Percent Change: 10.54% Day Change: 0.21 | |
| Week Change: 16.54% Year-to-date Change: 3.0% | |
| NIU Links: Profile News Message Board | |
| Charts:- Daily , Weekly | |
| Add NIU to Watchlist: View: Get Complete NIU Trend Analysis ➞ | |
 | WIMI WiMi Hologram Cloud Inc. |
| Sector: Technology | |
| SubSector: Advertising Agencies | |
| MarketCap: 41837 Millions | |
| Recent Price: 1.02 Market Intelligence Score: 100 | |
| Day Percent Change: 10.05% Day Change: 0.09 | |
| Week Change: 46.93% Year-to-date Change: 27.3% | |
| WIMI Links: Profile News Message Board | |
| Charts:- Daily , Weekly | |
| Add WIMI to Watchlist: View: Get Complete WIMI Trend Analysis ➞ | |
 | YSG Yatsen Holding Limited |
| Sector: Services & Goods | |
| SubSector: Specialty Retail | |
| MarketCap: 11827 Millions | |
| Recent Price: 4.82 Market Intelligence Score: 100 | |
| Day Percent Change: 9.30% Day Change: 0.41 | |
| Week Change: 33.33% Year-to-date Change: 558.8% | |
| YSG Links: Profile News Message Board | |
| Charts:- Daily , Weekly | |
| Add YSG to Watchlist: View: Get Complete YSG Trend Analysis ➞ | |
 | KC Kingsoft Cloud Holdings Limited |
| Sector: Technology | |
| SubSector: Software Application | |
| MarketCap: 98487 Millions | |
| Recent Price: 3.13 Market Intelligence Score: 95 | |
| Day Percent Change: 9.04% Day Change: 0.26 | |
| Week Change: 17.64% Year-to-date Change: -17.2% | |
| KC Links: Profile News Message Board | |
| Charts:- Daily , Weekly | |
| Add KC to Watchlist: View: Get Complete KC Trend Analysis ➞ | |
 | NIO NIO Limited |
| Sector: Consumer Staples | |
| SubSector: Auto Manufacturers - Major | |
| MarketCap: 2679.71 Millions | |
| Recent Price: 4.49 Market Intelligence Score: 34 | |
| Day Percent Change: 8.72% Day Change: 0.36 | |
| Week Change: 18.16% Year-to-date Change: -50.5% | |
| NIO Links: Profile News Message Board | |
| Charts:- Daily , Weekly | |
| Add NIO to Watchlist: View: Get Complete NIO Trend Analysis ➞ | |
 | DTSS Datasea Inc. |
| Sector: Industrials | |
| SubSector: Conglomerates | |
| MarketCap: 36.8848 Millions | |
| Recent Price: 8.27 Market Intelligence Score: 53 | |
| Day Percent Change: 8.67% Day Change: 0.66 | |
| Week Change: 7.68% Year-to-date Change: 3,464.7% | |
| DTSS Links: Profile News Message Board | |
| Charts:- Daily , Weekly | |
| Add DTSS to Watchlist: View: Get Complete DTSS Trend Analysis ➞ | |
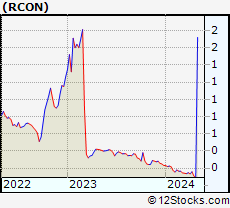 | RCON Recon Technology, Ltd. |
| Sector: Energy | |
| SubSector: Oil & Gas Equipment & Services | |
| MarketCap: 6.85461 Millions | |
| Recent Price: 0.09 Market Intelligence Score: 10 | |
| Day Percent Change: 8.66% Day Change: 0.01 | |
| Week Change: -19.29% Year-to-date Change: -61.8% | |
| RCON Links: Profile News Message Board | |
| Charts:- Daily , Weekly | |
| Add RCON to Watchlist: View: Get Complete RCON Trend Analysis ➞ | |
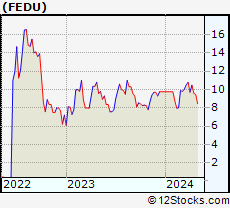 | FEDU Four Seasons Education (Cayman) Inc. |
| Sector: Services & Goods | |
| SubSector: Education & Training Services | |
| MarketCap: 59.5006 Millions | |
| Recent Price: 9.45 Market Intelligence Score: 7 | |
| Day Percent Change: 8.62% Day Change: 0.75 | |
| Week Change: -1.56% Year-to-date Change: -3.1% | |
| FEDU Links: Profile News Message Board | |
| Charts:- Daily , Weekly | |
| Add FEDU to Watchlist: View: Get Complete FEDU Trend Analysis ➞ | |
 | BEKE KE Holdings Inc. |
| Sector: Financials | |
| SubSector: Real Estate Services | |
| MarketCap: 80167 Millions | |
| Recent Price: 14.83 Market Intelligence Score: 95 | |
| Day Percent Change: 8.17% Day Change: 1.12 | |
| Week Change: 17.23% Year-to-date Change: -8.5% | |
| BEKE Links: Profile News Message Board | |
| Charts:- Daily , Weekly | |
| Add BEKE to Watchlist: View: Get Complete BEKE Trend Analysis ➞ | |
 | BHAT Fujian Blue Hat Interactive Entertainment Technology Ltd. |
| Sector: Technology | |
| SubSector: Multimedia & Graphics Software | |
| MarketCap: 28.3586 Millions | |
| Recent Price: 1.20 Market Intelligence Score: 83 | |
| Day Percent Change: 8.11% Day Change: 0.09 | |
| Week Change: 13.21% Year-to-date Change: 25.3% | |
| BHAT Links: Profile News Message Board | |
| Charts:- Daily , Weekly | |
| Add BHAT to Watchlist: View: Get Complete BHAT Trend Analysis ➞ | |
 | TUYA Tuya Inc. |
| Sector: Technology | |
| SubSector: Software - Infrastructure | |
| MarketCap: 1050 Millions | |
| Recent Price: 1.74 Market Intelligence Score: 42 | |
| Day Percent Change: 8.07% Day Change: 0.13 | |
| Week Change: 10.83% Year-to-date Change: -24.2% | |
| TUYA Links: Profile News Message Board | |
| Charts:- Daily , Weekly | |
| Add TUYA to Watchlist: View: Get Complete TUYA Trend Analysis ➞ | |
 | GDS GDS Holdings Limited |
| Sector: Technology | |
| SubSector: Data Storage Devices | |
| MarketCap: 8597.99 Millions | |
| Recent Price: 7.76 Market Intelligence Score: 85 | |
| Day Percent Change: 7.78% Day Change: 0.56 | |
| Week Change: 22.78% Year-to-date Change: -14.9% | |
| GDS Links: Profile News Message Board | |
| Charts:- Daily , Weekly | |
| Add GDS to Watchlist: View: Get Complete GDS Trend Analysis ➞ | |
 | KRKR 36Kr Holdings Inc. |
| Sector: Technology | |
| SubSector: Internet Information Providers | |
| MarketCap: 173.18 Millions | |
| Recent Price: 0.38 Market Intelligence Score: 42 | |
| Day Percent Change: 7.69% Day Change: 0.03 | |
| Week Change: 4.12% Year-to-date Change: -32.7% | |
| KRKR Links: Profile News Message Board | |
| Charts:- Daily , Weekly | |
| Add KRKR to Watchlist: View: Get Complete KRKR Trend Analysis ➞ | |
 | MNSO MINISO Group Holding Limited |
| Sector: Services & Goods | |
| SubSector: Specialty Retail | |
| MarketCap: 69427 Millions | |
| Recent Price: 23.71 Market Intelligence Score: 100 | |
| Day Percent Change: 7.33% Day Change: 1.62 | |
| Week Change: 15.63% Year-to-date Change: 16.2% | |
| MNSO Links: Profile News Message Board | |
| Charts:- Daily , Weekly | |
| Add MNSO to Watchlist: View: Get Complete MNSO Trend Analysis ➞ | |
 | LI Li Auto Inc. |
| Sector: Services & Goods | |
| SubSector: Auto Manufacturers | |
| MarketCap: 29167 Millions | |
| Recent Price: 25.12 Market Intelligence Score: 32 | |
| Day Percent Change: 7.30% Day Change: 1.71 | |
| Week Change: -7.68% Year-to-date Change: -32.9% | |
| LI Links: Profile News Message Board | |
| Charts:- Daily , Weekly | |
| Add LI to Watchlist: View: Get Complete LI Trend Analysis ➞ | |
 | OCFT OneConnect Financial Technology Co., Ltd. |
| Sector: Technology | |
| SubSector: Software Application | |
| MarketCap: 80387 Millions | |
| Recent Price: 1.96 Market Intelligence Score: 42 | |
| Day Percent Change: 7.16% Day Change: 0.13 | |
| Week Change: 3.7% Year-to-date Change: -37.8% | |
| OCFT Links: Profile News Message Board | |
| Charts:- Daily , Weekly | |
| Add OCFT to Watchlist: View: Get Complete OCFT Trend Analysis ➞ | |
 | SFWL Shengfeng Development Limited |
| Sector: Industrials | |
| SubSector: Integrated Freight & Logistics | |
| MarketCap: 747 Millions | |
| Recent Price: 1.65 Market Intelligence Score: 17 | |
| Day Percent Change: 7.14% Day Change: 0.11 | |
| Week Change: 1.23% Year-to-date Change: -40.0% | |
| SFWL Links: Profile News Message Board | |
| Charts:- Daily , Weekly | |
| Add SFWL to Watchlist: View: Get Complete SFWL Trend Analysis ➞ | |
 | BNR Burning Rock Biotech Limited |
| Sector: Health Care | |
| SubSector: Diagnostics & Research | |
| MarketCap: 27887 Millions | |
| Recent Price: 0.88 Market Intelligence Score: 64 | |
| Day Percent Change: 7.09% Day Change: 0.06 | |
| Week Change: 9.88% Year-to-date Change: -8.9% | |
| BNR Links: Profile News Message Board | |
| Charts:- Daily , Weekly | |
| Add BNR to Watchlist: View: Get Complete BNR Trend Analysis ➞ | |
 | BZUN Baozun Inc. |
| Sector: Services & Goods | |
| SubSector: Catalog & Mail Order Houses | |
| MarketCap: 1668.92 Millions | |
| Recent Price: 2.77 Market Intelligence Score: 95 | |
| Day Percent Change: 6.95% Day Change: 0.18 | |
| Week Change: 19.4% Year-to-date Change: 1.1% | |
| BZUN Links: Profile News Message Board | |
| Charts:- Daily , Weekly | |
| Add BZUN to Watchlist: View: Get Complete BZUN Trend Analysis ➞ | |
| To view more stocks, click on Next / Previous arrows or select different range: 0 - 25 , 25 - 50 , 50 - 75 , 75 - 100 , 100 - 125 , 125 - 150 , 150 - 175 , 175 - 200 , 200 - 225 | ||
| Click To Change The Sort Order: By Market Cap or Company Size Performance: Year-to-date, Week and Day | |
| Select Chart Type: | ||
|
Best Stocks Today 12Stocks.com |
© 2024 12Stocks.com Terms & Conditions Privacy Contact Us
All Information Provided Only For Education And Not To Be Used For Investing or Trading. See Terms & Conditions


One More Thing ... Get Best Stocks Delivered Daily!
Never Ever Miss A Move With Our Top Ten Stocks Lists
Find Best Stocks In Any Market - Bull or Bear Market
Take A Peek At Our Top Ten Stocks Lists: Daily, Weekly, Year-to-Date & Top Trends
Find Best Stocks In Any Market - Bull or Bear Market
Take A Peek At Our Top Ten Stocks Lists: Daily, Weekly, Year-to-Date & Top Trends
Asia Stocks With Best Up Trends [0-bearish to 100-bullish]: WiMi Hologram[100], Yatsen Holding[100], MINISO [100], JD.com [100], Full Truck[100], Kanzhun [100], ZTO Express[100], Dada Nexus[100], Alibaba [100], ICICI Bank[100], Kingsoft Cloud[95]
Best Asia Stocks Year-to-Date:
U Power[2779.46%], DouYu [805.26%], MicroCloud Hologram[619.42%], Yatsen Holding[558.83%], China Liberal[526.4%], Zhongchao [377.95%], Uxin [162.48%], QuantaSing [107.1%], GigaCloud [93.17%], Cheetah Mobile[86.84%], Yiren Digital[62.82%] Best Asia Stocks This Week:
WiMi Hologram[46.93%], Yatsen Holding[33.33%], ATRenew [25.32%], GDS [22.78%], iQIYI [22.15%], Cheetah Mobile[20.34%], Bilibili [20.3%], Baozun [19.4%], Golden Heaven[19.11%], JD.com [19.01%], BeiGene [18.38%] Best Asia Stocks Daily:
ATRenew [22.98%], Zhongchao [15.95%], Huize Holding[14.77%], XPeng [12.38%], Niu [10.54%], WiMi Hologram[10.05%], Yatsen Holding[9.30%], Kingsoft Cloud[9.04%], NIO [8.72%], KE [8.17%], Tuya [8.07%]