
 Login Sign Up


| |||||
 |  | ||||

| 12Stocks.com Market Intelligence |
Best Tech Stocks
| In a hurry? Tech Stocks Lists: Performance & Trends, Stock Charts, FANG Stocks
Sort Tech stocks: Daily, Weekly, Year-to-Date, Market Cap & Trends. Filter Tech stocks list by size:All Tech Large Mid-Range Small and MicroCap |
| 12Stocks.com Tech Stocks Performances & Trends Daily | |||||||||
|
|  The overall Smart Investing & Trading Score is 100 (0-bearish to 100-bullish) which puts Technology sector in short term bullish trend. The Smart Investing & Trading Score from previous trading session is 80 and an improvement of trend continues.
| ||||||||
Here are the Smart Investing & Trading Scores of the most requested Technology stocks at 12Stocks.com (click stock name for detailed review):
|


| 12Stocks.com: Investing in Technology sector with Stocks | |
|
The following table helps investors and traders sort through current performance and trends (as measured by Smart Investing & Trading Score) of various
stocks in the Tech sector. Quick View: Move mouse or cursor over stock symbol (ticker) to view short-term technical chart and over stock name to view long term chart. Click on  to add stock symbol to your watchlist and to add stock symbol to your watchlist and  to view watchlist. Click on any ticker or stock name for detailed market intelligence report for that stock. to view watchlist. Click on any ticker or stock name for detailed market intelligence report for that stock. |
12Stocks.com Performance of Stocks in Tech Sector
| Ticker | Stock Name | Watchlist | Category | Recent Price | Smart Investing & Trading Score | Change % | YTD Change% |
| CHT | Chunghwa Telecom |   | Telecom | 39.48 | 48 | 0.20% | 1.05% |
| MCHP | Microchip | | Semiconductor | 91.00 | 26 | -1.95% | 0.91% |
| JD | JD.com | | Internet | 28.84 | 61 | -1.90% | -0.17% |
| VOD | Vodafone | | Wireless | 8.66 | 10 | -1.03% | -0.46% |
| WIT | Wipro | | IT | 5.54 | 59 | -1.34% | -0.63% |
| GDS | GDS | | Data Storage | 9.06 | 95 | -0.88% | -0.66% |
| OKTA | Okta | | Software | 89.90 | 17 | 1.87% | -0.70% |
| QRVO | Qorvo | | Semiconductor | 111.59 | 74 | -1.56% | -0.91% |
| NTES | NetEase | | Internet | 92.30 | 32 | 0.08% | -0.92% |
| SSNC | SS&C | | Software | 60.51 | 0 | -0.36% | -0.98% |
| EA | Electronic Arts | | Software | 135.42 | 68 | -0.33% | -1.02% |
| LBTYA | Liberty Global | | CATV | 17.43 | 76 | -1.16% | -1.94% |
| CDW | CDW | | IT | 222.71 | 30 | -1.06% | -2.03% |
| FTV | Fortive | | Instruments | 71.87 | 28 | -1.51% | -2.39% |
| TTWO | Take-Two Interactive | | Software | 156.78 | 58 | -0.60% | -2.59% |
| JKHY | Jack Henry | | IT | 158.19 | 0 | -0.23% | -3.19% |
| DDOG | Datadog | | Software | 117.51 | 49 | -1.66% | -3.19% |
| FOUR | Shift4 Payments | | Software Infrastructure | 71.94 | 68 | 0.42% | -3.23% |
| FROG | JFrog | | Software | 33.49 | 57 | -1.41% | -3.26% |
| INFY | Infosys | | IT | 17.73 | 63 | -0.42% | -3.51% |
| VEEV | Veeva Systems | | Healthcare Information | 185.77 | 35 | 0.00% | -3.51% |
| BSY | Bentley Systems | | Software | 50.16 | 32 | -0.56% | -3.85% |
| SKM | SK Telecom | | Wireless | 20.50 | 8 | -1.18% | -4.23% |
| INTU | Intuit | | Software | 596.57 | 49 | 0.33% | -4.55% |
| UCL | uCloudlink | | Telecom | 1.75 | 78 | -1.13% | -5.41% |
| For chart view version of above stock list: Chart View ➞ 0 - 25 , 25 - 50 , 50 - 75 , 75 - 100 , 100 - 125 , 125 - 150 , 150 - 175 , 175 - 200 | ||
 | Click To Change The Sort Order: By Market Cap or Company Size Performance: Year-to-date, Week and Day |  |
|
Get the most comprehensive stock market coverage daily at 12Stocks.com ➞ Best Stocks Today ➞ Best Stocks Weekly ➞ Best Stocks Year-to-Date ➞ Best Stocks Trends ➞  Best Stocks Today 12Stocks.com Best Nasdaq Stocks ➞ Best S&P 500 Stocks ➞ Best Tech Stocks ➞ Best Biotech Stocks ➞ |
| Detailed Overview of Tech Stocks |
| Tech Technical Overview, Leaders & Laggards, Top Tech ETF Funds & Detailed Tech Stocks List, Charts, Trends & More |
| Tech Sector: Technical Analysis, Trends & YTD Performance | |
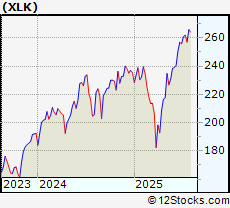
| Technology sector is composed of stocks
from semiconductors, software, web, social media
and services subsectors. Technology sector, as represented by XLK, an exchange-traded fund [ETF] that holds basket of tech stocks (e.g, Intel, Google) is up by 18.11% and is currently outperforming the overall market by 5.91% year-to-date. Below is a quick view of technical charts and trends: |
|
 XLK Weekly Chart |
|
| Long Term Trend: Very Good | |
| Medium Term Trend: Very Good | |
 XLK Daily Chart |
|
| Short Term Trend: Very Good | |
| Overall Trend Score: 100 | |
| YTD Performance: 18.11% | |
| **Trend Scores & Views Are Only For Educational Purposes And Not For Investing | |
| 12Stocks.com: Top Performing Technology Sector Stocks | ||||||||||||||||||||||||||||||||||||||||||||||||
 The top performing Technology sector stocks year to date are
Now, more recently, over last week, the top performing Technology sector stocks on the move are


|
||||||||||||||||||||||||||||||||||||||||||||||||
| 12Stocks.com: Investing in Tech Sector using Exchange Traded Funds | |
|
The following table shows list of key exchange traded funds (ETF) that
help investors track Tech Index. For detailed view, check out our ETF Funds section of our website. Quick View: Move mouse or cursor over ETF symbol (ticker) to view short-term technical chart and over ETF name to view long term chart. Click on ticker or stock name for detailed view. Click on to add stock symbol to your watchlist and to view watchlist. |
12Stocks.com List of ETFs that track Tech Index
| Ticker | ETF Name | Watchlist | Recent Price | Smart Investing & Trading Score | Change % | Week % | Year-to-date % |
| XLK | Technology | | 227.35 | 100 | 0.23 | 5.45 | 18.11% |
| IYW | Technology | | 150.71 | 100 | 0.31 | 5.22 | 22.78% |
| VGT | Information Technology | | 578.29 | 100 | 0.19 | 5.59 | 19.48% |
| IXN | Global Tech | | 82.98 | 95 | -0.10 | 4.81 | 21.71% |
| IGV | Tech-Software | | 82.96 | 42 | 1.36 | 3.38 | 2.26% |
| XSD | Semiconductor | | 252.37 | 93 | -1.23 | 3.27 | 12.27% |
| TQQQ | QQQ | | 73.55 | 100 | 0.60 | 9.58 | 45.07% |
| SQQQ | Short QQQ | | 8.52 | 0 | -0.23 | -8.58 | -36.65% |
| SOXL | Semicondct Bull 3X | | 59.18 | 100 | -2.76 | 14.09 | 88.47% |
| QTEC | First -100-Tech | | 195.65 | 95 | 0.00 | 3.24 | 11.5% |
| SMH | Semiconductor | | 266.62 | 100 | -0.22 | 5.71 | 52.46% |
| 12Stocks.com: Charts, Trends, Fundamental Data and Performances of Tech Stocks | |
|
We now take in-depth look at all Tech stocks including charts, multi-period performances and overall trends (as measured by Smart Investing & Trading Score). One can sort Tech stocks (click link to choose) by Daily, Weekly and by Year-to-Date performances. Also, one can sort by size of the company or by market capitalization. |
| Select Your Default Chart Type: | |||||
| |||||
| Click on stock symbol or name for detailed view. Click on to add stock symbol to your watchlist and to view watchlist. Quick View: Move mouse or cursor over "Daily" to quickly view daily technical stock chart and over "Weekly" to view weekly technical stock chart. | |||||


 | CHT Chunghwa Telecom Co., Ltd. |
| Sector: Technology | |
| SubSector: Telecom Services - Domestic | |
| MarketCap: 28101.3 Millions | |
| Recent Price: 39.48 Smart Investing & Trading Score: 48 | |
| Day Percent Change: 0.20% Day Change: 0.08 | |
| Week Change: 1.44% Year-to-date Change: 1.1% | |
| CHT Links: Profile News Message Board | |
| Charts:- Daily , Weekly | |
| Add CHT to Watchlist: View: Get Complete CHT Trend Analysis ➞ | |
 | MCHP Microchip Technology Incorporated |
| Sector: Technology | |
| SubSector: Semiconductor - Broad Line | |
| MarketCap: 16826.3 Millions | |
| Recent Price: 91.00 Smart Investing & Trading Score: 26 | |
| Day Percent Change: -1.95% Day Change: -1.81 | |
| Week Change: -1.99% Year-to-date Change: 0.9% | |
| MCHP Links: Profile News Message Board | |
| Charts:- Daily , Weekly | |
| Add MCHP to Watchlist: View: Get Complete MCHP Trend Analysis ➞ | |
 | JD JD.com, Inc. |
| Sector: Technology | |
| SubSector: Internet Information Providers | |
| MarketCap: 59907.3 Millions | |
| Recent Price: 28.84 Smart Investing & Trading Score: 61 | |
| Day Percent Change: -1.90% Day Change: -0.56 | |
| Week Change: -1.67% Year-to-date Change: -0.2% | |
| JD Links: Profile News Message Board | |
| Charts:- Daily , Weekly | |
| Add JD to Watchlist: View: Get Complete JD Trend Analysis ➞ | |
 | VOD Vodafone Group Plc |
| Sector: Technology | |
| SubSector: Wireless Communications | |
| MarketCap: 38154.7 Millions | |
| Recent Price: 8.66 Smart Investing & Trading Score: 10 | |
| Day Percent Change: -1.03% Day Change: -0.09 | |
| Week Change: -3.78% Year-to-date Change: -0.5% | |
| VOD Links: Profile News Message Board | |
| Charts:- Daily , Weekly | |
| Add VOD to Watchlist: View: Get Complete VOD Trend Analysis ➞ | |
 | WIT Wipro Limited |
| Sector: Technology | |
| SubSector: Information Technology Services | |
| MarketCap: 15101.3 Millions | |
| Recent Price: 5.54 Smart Investing & Trading Score: 59 | |
| Day Percent Change: -1.34% Day Change: -0.08 | |
| Week Change: -1.51% Year-to-date Change: -0.6% | |
| WIT Links: Profile News Message Board | |
| Charts:- Daily , Weekly | |
| Add WIT to Watchlist: View: Get Complete WIT Trend Analysis ➞ | |
 | GDS GDS Holdings Limited |
| Sector: Technology | |
| SubSector: Data Storage Devices | |
| MarketCap: 8597.99 Millions | |
| Recent Price: 9.06 Smart Investing & Trading Score: 95 | |
| Day Percent Change: -0.88% Day Change: -0.08 | |
| Week Change: 2.72% Year-to-date Change: -0.7% | |
| GDS Links: Profile News Message Board | |
| Charts:- Daily , Weekly | |
| Add GDS to Watchlist: View: Get Complete GDS Trend Analysis ➞ | |
 | OKTA Okta, Inc. |
| Sector: Technology | |
| SubSector: Technical & System Software | |
| MarketCap: 15332.9 Millions | |
| Recent Price: 89.90 Smart Investing & Trading Score: 17 | |
| Day Percent Change: 1.87% Day Change: 1.65 | |
| Week Change: 2.84% Year-to-date Change: -0.7% | |
| OKTA Links: Profile News Message Board | |
| Charts:- Daily , Weekly | |
| Add OKTA to Watchlist: View: Get Complete OKTA Trend Analysis ➞ | |
 | QRVO Qorvo, Inc. |
| Sector: Technology | |
| SubSector: Semiconductor - Broad Line | |
| MarketCap: 9524.32 Millions | |
| Recent Price: 111.59 Smart Investing & Trading Score: 74 | |
| Day Percent Change: -1.56% Day Change: -1.77 | |
| Week Change: 12.16% Year-to-date Change: -0.9% | |
| QRVO Links: Profile News Message Board | |
| Charts:- Daily , Weekly | |
| Add QRVO to Watchlist: View: Get Complete QRVO Trend Analysis ➞ | |
 | NTES NetEase, Inc. |
| Sector: Technology | |
| SubSector: Internet Software & Services | |
| MarketCap: 40105.1 Millions | |
| Recent Price: 92.30 Smart Investing & Trading Score: 32 | |
| Day Percent Change: 0.08% Day Change: 0.07 | |
| Week Change: -1.7% Year-to-date Change: -0.9% | |
| NTES Links: Profile News Message Board | |
| Charts:- Daily , Weekly | |
| Add NTES to Watchlist: View: Get Complete NTES Trend Analysis ➞ | |
 | SSNC SS&C Technologies Holdings, Inc. |
| Sector: Technology | |
| SubSector: Business Software & Services | |
| MarketCap: 9884.08 Millions | |
| Recent Price: 60.51 Smart Investing & Trading Score: 0 | |
| Day Percent Change: -0.36% Day Change: -0.22 | |
| Week Change: -1.83% Year-to-date Change: -1.0% | |
| SSNC Links: Profile News Message Board | |
| Charts:- Daily , Weekly | |
| Add SSNC to Watchlist: View: Get Complete SSNC Trend Analysis ➞ | |
 | EA Electronic Arts Inc. |
| Sector: Technology | |
| SubSector: Multimedia & Graphics Software | |
| MarketCap: 27296.5 Millions | |
| Recent Price: 135.42 Smart Investing & Trading Score: 68 | |
| Day Percent Change: -0.33% Day Change: -0.45 | |
| Week Change: -1.02% Year-to-date Change: -1.0% | |
| EA Links: Profile News Message Board | |
| Charts:- Daily , Weekly | |
| Add EA to Watchlist: View: Get Complete EA Trend Analysis ➞ | |
 | LBTYA Liberty Global plc |
| Sector: Technology | |
| SubSector: CATV Systems | |
| MarketCap: 11723.7 Millions | |
| Recent Price: 17.43 Smart Investing & Trading Score: 76 | |
| Day Percent Change: -1.16% Day Change: -0.20 | |
| Week Change: -3.68% Year-to-date Change: -1.9% | |
| LBTYA Links: Profile News Message Board | |
| Charts:- Daily , Weekly | |
| Add LBTYA to Watchlist: View: Get Complete LBTYA Trend Analysis ➞ | |
 | CDW CDW Corporation |
| Sector: Technology | |
| SubSector: Information Technology Services | |
| MarketCap: 12775 Millions | |
| Recent Price: 222.71 Smart Investing & Trading Score: 30 | |
| Day Percent Change: -1.06% Day Change: -2.39 | |
| Week Change: -0.68% Year-to-date Change: -2.0% | |
| CDW Links: Profile News Message Board | |
| Charts:- Daily , Weekly | |
| Add CDW to Watchlist: View: Get Complete CDW Trend Analysis ➞ | |
 | FTV Fortive Corporation |
| Sector: Technology | |
| SubSector: Scientific & Technical Instruments | |
| MarketCap: 16351.9 Millions | |
| Recent Price: 71.87 Smart Investing & Trading Score: 28 | |
| Day Percent Change: -1.51% Day Change: -1.10 | |
| Week Change: -1.21% Year-to-date Change: -2.4% | |
| FTV Links: Profile News Message Board | |
| Charts:- Daily , Weekly | |
| Add FTV to Watchlist: View: Get Complete FTV Trend Analysis ➞ | |
 | TTWO Take-Two Interactive Software, Inc. |
| Sector: Technology | |
| SubSector: Multimedia & Graphics Software | |
| MarketCap: 12479.6 Millions | |
| Recent Price: 156.78 Smart Investing & Trading Score: 58 | |
| Day Percent Change: -0.60% Day Change: -0.94 | |
| Week Change: -4.85% Year-to-date Change: -2.6% | |
| TTWO Links: Profile News Message Board | |
| Charts:- Daily , Weekly | |
| Add TTWO to Watchlist: View: Get Complete TTWO Trend Analysis ➞ | |
 | JKHY Jack Henry & Associates, Inc. |
| Sector: Technology | |
| SubSector: Information Technology Services | |
| MarketCap: 10695.4 Millions | |
| Recent Price: 158.19 Smart Investing & Trading Score: 0 | |
| Day Percent Change: -0.23% Day Change: -0.36 | |
| Week Change: -4% Year-to-date Change: -3.2% | |
| JKHY Links: Profile News Message Board | |
| Charts:- Daily , Weekly | |
| Add JKHY to Watchlist: View: Get Complete JKHY Trend Analysis ➞ | |
 | DDOG Datadog, Inc. |
| Sector: Technology | |
| SubSector: Application Software | |
| MarketCap: 10653.2 Millions | |
| Recent Price: 117.51 Smart Investing & Trading Score: 49 | |
| Day Percent Change: -1.66% Day Change: -1.98 | |
| Week Change: 7.34% Year-to-date Change: -3.2% | |
| DDOG Links: Profile News Message Board | |
| Charts:- Daily , Weekly | |
| Add DDOG to Watchlist: View: Get Complete DDOG Trend Analysis ➞ | |
 | FOUR Shift4 Payments, Inc. |
| Sector: Technology | |
| SubSector: Software Infrastructure | |
| MarketCap: 49287 Millions | |
| Recent Price: 71.94 Smart Investing & Trading Score: 68 | |
| Day Percent Change: 0.42% Day Change: 0.30 | |
| Week Change: -0.81% Year-to-date Change: -3.2% | |
| FOUR Links: Profile News Message Board | |
| Charts:- Daily , Weekly | |
| Add FOUR to Watchlist: View: Get Complete FOUR Trend Analysis ➞ | |
 | FROG JFrog Ltd. |
| Sector: Technology | |
| SubSector: Software Application | |
| MarketCap: 62287 Millions | |
| Recent Price: 33.49 Smart Investing & Trading Score: 57 | |
| Day Percent Change: -1.41% Day Change: -0.48 | |
| Week Change: 3.11% Year-to-date Change: -3.3% | |
| FROG Links: Profile News Message Board | |
| Charts:- Daily , Weekly | |
| Add FROG to Watchlist: View: Get Complete FROG Trend Analysis ➞ | |
 | INFY Infosys Limited |
| Sector: Technology | |
| SubSector: Information Technology Services | |
| MarketCap: 33819.1 Millions | |
| Recent Price: 17.73 Smart Investing & Trading Score: 63 | |
| Day Percent Change: -0.42% Day Change: -0.07 | |
| Week Change: -1.53% Year-to-date Change: -3.5% | |
| INFY Links: Profile News Message Board | |
| Charts:- Daily , Weekly | |
| Add INFY to Watchlist: View: Get Complete INFY Trend Analysis ➞ | |
 | VEEV Veeva Systems Inc. |
| Sector: Technology | |
| SubSector: Healthcare Information Services | |
| MarketCap: 21492.1 Millions | |
| Recent Price: 185.77 Smart Investing & Trading Score: 35 | |
| Day Percent Change: 0.00% Day Change: 0.00 | |
| Week Change: 1.44% Year-to-date Change: -3.5% | |
| VEEV Links: Profile News Message Board | |
| Charts:- Daily , Weekly | |
| Add VEEV to Watchlist: View: Get Complete VEEV Trend Analysis ➞ | |
 | BSY Bentley Systems, Incorporated |
| Sector: Technology | |
| SubSector: Software Application | |
| MarketCap: 98687 Millions | |
| Recent Price: 50.16 Smart Investing & Trading Score: 32 | |
| Day Percent Change: -0.56% Day Change: -0.28 | |
| Week Change: -1.3% Year-to-date Change: -3.9% | |
| BSY Links: Profile News Message Board | |
| Charts:- Daily , Weekly | |
| Add BSY to Watchlist: View: Get Complete BSY Trend Analysis ➞ | |
 | SKM SK Telecom Co.,Ltd |
| Sector: Technology | |
| SubSector: Wireless Communications | |
| MarketCap: 12332.1 Millions | |
| Recent Price: 20.50 Smart Investing & Trading Score: 8 | |
| Day Percent Change: -1.18% Day Change: -0.24 | |
| Week Change: -2.22% Year-to-date Change: -4.2% | |
| SKM Links: Profile News Message Board | |
| Charts:- Daily , Weekly | |
| Add SKM to Watchlist: View: Get Complete SKM Trend Analysis ➞ | |
 | INTU Intuit Inc. |
| Sector: Technology | |
| SubSector: Application Software | |
| MarketCap: 577035 Millions | |
| Recent Price: 596.57 Smart Investing & Trading Score: 49 | |
| Day Percent Change: 0.33% Day Change: 1.95 | |
| Week Change: 3.95% Year-to-date Change: -4.6% | |
| INTU Links: Profile News Message Board | |
| Charts:- Daily , Weekly | |
| Add INTU to Watchlist: View: Get Complete INTU Trend Analysis ➞ | |
 | UCL uCloudlink Group Inc. |
| Sector: Technology | |
| SubSector: Telecom Services | |
| MarketCap: 35837 Millions | |
| Recent Price: 1.75 Smart Investing & Trading Score: 78 | |
| Day Percent Change: -1.13% Day Change: -0.02 | |
| Week Change: 8.88% Year-to-date Change: -5.4% | |
| UCL Links: Profile News Message Board | |
| Charts:- Daily , Weekly | |
| Add UCL to Watchlist: View: Get Complete UCL Trend Analysis ➞ | |
| For tabular summary view of above stock list: Summary View ➞ 0 - 25 , 25 - 50 , 50 - 75 , 75 - 100 , 100 - 125 , 125 - 150 , 150 - 175 , 175 - 200 | ||
| Click To Change The Sort Order: By Market Cap or Company Size Performance: Year-to-date, Week and Day | |
| Select Chart Type: | ||
|
Best Stocks Today 12Stocks.com |
© 2024 12Stocks.com Terms & Conditions Privacy Contact Us
All Information Provided Only For Education And Not To Be Used For Investing or Trading. See Terms & Conditions


One More Thing ... Get Best Stocks Delivered Daily!
Never Ever Miss A Move With Our Top Ten Stocks Lists
Find Best Stocks In Any Market - Bull or Bear Market
Take A Peek At Our Top Ten Stocks Lists: Daily, Weekly, Year-to-Date & Top Trends
Find Best Stocks In Any Market - Bull or Bear Market
Take A Peek At Our Top Ten Stocks Lists: Daily, Weekly, Year-to-Date & Top Trends
Technology Stocks With Best Up Trends [0-bearish to 100-bullish]: MediaCo Holding[100], Broadcom [100], Vertex [100], Immersion [100], Pure Storage[100], Microsoft [100], Nova Measuring[100], Arista Networks[100], Red Violet[100], Apple [100], Micron [100]
Best Technology Stocks Year-to-Date:
MediaCo Holding[516.2%], 2U [426.83%], MicroCloud Hologram[302.88%], Uxin [222.4%], Super Micro[201.53%], MicroStrategy [136.85%], Cheetah Mobile[127.63%], CuriosityStream [118.48%], SoundHound AI[110.98%], Phoenix New[98.53%], Pure Storage[91.78%] Best Technology Stocks This Week:
2U [2147.66%], MediaCo Holding[147.64%], Kaltura [44.96%], Nerdy [35.03%], Bitdeer [31.71%], Karooooo [23.02%], Broadcom [22.18%], CuriosityStream [16.83%], Skyworks [15.31%], FiscalNote [14.47%], Aerohive Networks[14.29%] Best Technology Stocks Daily:
2U [2748.35%], Adobe [14.59%], MediaCo Holding[11.70%], Grindr [9.65%], Markforged Holding[8.76%], Qudian [8.38%], Cango [6.96%], Nerdy [6.15%], CI&T [5.04%], Kingsoft Cloud[4.21%], R1 RCM[4.12%]