
 Login Sign Up


| |||||
 |  | ||||

| 12Stocks.com Market Intelligence |
Best SmallCap Stocks
|
| In a hurry? Small Cap Stock Lists: Performance Trends Table, Stock Charts
Sort Small Cap stocks: Daily, Weekly, Year-to-Date, Market Cap & Trends. Filter Small Cap stocks list by sector: Show all, Tech, Finance, Energy, Staples, Retail, Industrial, Materials, Utilities and HealthCare Filter Small Cap stocks list by size: All Large Medium Small and MicroCap |
| 12Stocks.com Small Cap Stocks Performances & Trends Daily | |||||||||
|
|  The overall Smart Investing & Trading Score is 76 (0-bearish to 100-bullish) which puts Small Cap index in short term neutral to bullish trend. The Smart Investing & Trading Score from previous trading session is 83 and hence a deterioration of trend.
| ||||||||
Here are the Smart Investing & Trading Scores of the most requested small cap stocks at 12Stocks.com (click stock name for detailed review):
|


| 12Stocks.com: Investing in Smallcap Index with Stocks | |
|
The following table helps investors and traders sort through current performance and trends (as measured by Smart Investing & Trading Score) of various
stocks in the Smallcap Index. Quick View: Move mouse or cursor over stock symbol (ticker) to view short-term technical chart and over stock name to view long term chart. Click on  to add stock symbol to your watchlist and to add stock symbol to your watchlist and  to view watchlist. Click on any ticker or stock name for detailed market intelligence report for that stock. to view watchlist. Click on any ticker or stock name for detailed market intelligence report for that stock. |
12Stocks.com Performance of Stocks in Smallcap Index
| Ticker | Stock Name | Watchlist | Category | Recent Price | Smart Investing & Trading Score | Change % | YTD Change% |
| SMCI | Super Micro |   | Technology | 898.50 | 83 | -0.60% | 216.08% |
| MSTR | MicroStrategy | | Technology | 1656.69 | 95 | -4.08% | 162.29% |
| SOUN | SoundHound AI | | Technology | 5.17 | 52 | -5.66% | 141.59% |
| ZETA | Zeta Global | | Technology | 18.29 | 95 | 3.80% | 107.25% |
| PI | Impinj | | Technology | 167.63 | 71 | -1.17% | 86.19% |
| SMTC | Semtech | | Technology | 40.62 | 95 | 1.02% | 85.39% |
| NN | NextNav | | Technology | 7.53 | 41 | -4.68% | 69.21% |
| VERI | Veritone | | Technology | 3.07 | 36 | -1.92% | 68.68% |
| MTTR | Matterport | | Technology | 4.45 | 51 | -1.22% | 64.63% |
| MAX | MediaAlpha | | Technology | 18.26 | 10 | -3.03% | 64.21% |
| BHE | Benchmark Electronics | | Technology | 42.11 | 90 | 0.36% | 52.35% |
| ONTO | Onto Innovation | | Technology | 230.58 | 61 | 1.26% | 50.80% |
| HEAR | Turtle Beach | | Technology | 16.27 | 66 | 1.18% | 48.58% |
| BAND | Bandwidth | | Technology | 21.48 | 61 | -2.10% | 48.45% |
| QTWO | Q2 | | Technology | 63.53 | 85 | -0.61% | 46.35% |
| QNST | QuinStreet | | Technology | 18.40 | 68 | 0.71% | 43.53% |
| EVBG | Everbridge | | Technology | 34.75 | 63 | -0.09% | 42.95% |
| PUBM | PubMatic | | Technology | 23.10 | 59 | -2.04% | 41.72% |
| ITRI | Itron | | Technology | 107.00 | 51 | -2.41% | 41.70% |
| FORM | FormFactor | | Technology | 58.35 | 90 | 1.39% | 39.89% |
| PSFE | Paysafe | | Technology | 18.02 | 76 | 0.70% | 39.65% |
| CVLT | Commvault Systems | | Technology | 110.70 | 66 | 0.13% | 38.63% |
| DSP | Viant | | Technology | 9.62 | 63 | -3.95% | 38.54% |
| APPF | AppFolio | | Technology | 238.04 | 28 | -2.10% | 37.40% |
| IMMR | Immersion | | Technology | 9.68 | 90 | 2.87% | 37.11% |
| For chart view version of above stock list: Chart View ➞ 0 - 25 , 25 - 50 , 50 - 75 , 75 - 100 , 100 - 125 , 125 - 150 , 150 - 175 , 175 - 200 , 200 - 225 , 225 - 250 , 250 - 275 | ||
 | Click To Change The Sort Order: By Market Cap or Company Size Performance: Year-to-date, Week and Day |  |
| Too many stocks? View smallcap stocks filtered by marketcap & sector |
| Marketcap: All SmallCap Stocks (default-no microcap), Large, Mid-Range, Small |
| Smallcap Sector: Tech, Finance, Energy, Staples, Retail, Industrial, Materials, & Medical |
|
Get the most comprehensive stock market coverage daily at 12Stocks.com ➞ Best Stocks Today ➞ Best Stocks Weekly ➞ Best Stocks Year-to-Date ➞ Best Stocks Trends ➞  Best Stocks Today 12Stocks.com Best Nasdaq Stocks ➞ Best S&P 500 Stocks ➞ Best Tech Stocks ➞ Best Biotech Stocks ➞ |
| Detailed Overview of SmallCap Stocks |
| SmallCap Technical Overview, Leaders & Laggards, Top SmallCap ETF Funds & Detailed SmallCap Stocks List, Charts, Trends & More |
| Smallcap: Technical Analysis, Trends & YTD Performance | |
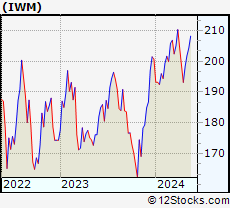
| SmallCap segment as represented by
IWM, an exchange-traded fund [ETF], holds basket of thousands of smallcap stocks from across all major sectors of the US stock market. The smallcap index (contains stocks like Riverbed & Sotheby's) is up by 3.8% and is currently underperforming the overall market by -7.11% year-to-date. Below is a quick view of technical charts and trends: | |
 IWM Weekly Chart |
|
| Long Term Trend: Very Good | |
| Medium Term Trend: Very Good | |
 IWM Daily Chart |
|
| Short Term Trend: Good | |
| Overall Trend Score: 76 | |
| YTD Performance: 3.8% | |
| **Trend Scores & Views Are Only For Educational Purposes And Not For Investing | |
| 12Stocks.com: Top Performing Small Cap Index Stocks | ||||||||||||||||||||||||||||||||||||||||||||||||
 The top performing Small Cap Index stocks year to date are
Now, more recently, over last week, the top performing Small Cap Index stocks on the move are


|
||||||||||||||||||||||||||||||||||||||||||||||||
| 12Stocks.com: Investing in Smallcap Index using Exchange Traded Funds | |
|
The following table shows list of key exchange traded funds (ETF) that
help investors track Smallcap index. The following list also includes leveraged ETF funds that track twice or thrice the daily returns of Smallcap indices. Short or inverse ETF funds move in the opposite direction to the index they track and are useful during market pullbacks or during bear markets. Quick View: Move mouse or cursor over ETF symbol (ticker) to view short-term technical chart and over ETF name to view long term chart. Click on ticker or stock name for detailed view. Click on to add stock symbol to your watchlist and to view watchlist. |
12Stocks.com List of ETFs that track Smallcap Index
| Ticker | ETF Name | Watchlist | Recent Price | Smart Investing & Trading Score | Change % | Week % | Year-to-date % |
| IWM | iShares Russell 2000 | | 208.34 | 76 | -0.10 | 0.12 | 3.8% |
| IJR | iShares Core S&P Small-Cap | | 110.16 | 69 | -0.05 | -0.21 | 1.76% |
| IWN | iShares Russell 2000 Value | | 158.12 | 69 | -0.04 | -0.37 | 1.8% |
| VTWO | Vanguard Russell 2000 ETF | | 84.23 | 56 | -0.14 | 0.14 | 3.86% |
| IWO | iShares Russell 2000 Growth | | 266.77 | 69 | -0.22 | 0.61 | 5.77% |
| IJS | iShares S&P Small-Cap 600 Value | | 101.19 | 48 | -0.01 | -0.67 | -1.82% |
| IJT | iShares S&P Small-Cap 600 Growth | | 131.65 | 73 | -0.08 | 0.24 | 5.2% |
| XSLV | PowerShares S&P SmallCap Low Volatil ETF | | 44.26 | 66 | -0.11 | -0.48 | 0.25% |
| SMLV | SPDR SSGA US Small Cap Low Volatil ETF | | 112.11 | 66 | -0.79 | -1.03 | -0.36% |
| SDD | ProShares UltraShort SmallCap600 | | 17.96 | 27 | 1.30 | 0.68 | -2.53% |
| SAA | ProShares Ultra SmallCap600 | | 24.71 | 61 | -1.55 | -0.78 | -0.96% |
| SBB | ProShares Short SmallCap600 | | 15.83 | 17 | 0.70 | 0.36 | -0.63% |
| 12Stocks.com: Charts, Trends, Fundamental Data and Performances of SmallCap Stocks | |
|
We now take in-depth look at all SmallCap stocks including charts, multi-period performances and overall trends (as measured by Smart Investing & Trading Score). One can sort SmallCap stocks (click link to choose) by Daily, Weekly and by Year-to-Date performances. Also, one can sort by size of the company or by market capitalization. |
| Select Your Default Chart Type: | |||||
| |||||
| Click on stock symbol or name for detailed view. Click on to add stock symbol to your watchlist and to view watchlist. Quick View: Move mouse or cursor over "Daily" to quickly view daily technical stock chart and over "Weekly" to view weekly technical stock chart. | |||||

 | SMCI Super Micro Computer, Inc. |
| Sector: Technology | |
| SubSector: Networking & Communication Devices | |
| MarketCap: 1200.02 Millions | |
| Recent Price: 898.50 Smart Investing & Trading Score: 83 | |
| Day Percent Change: -0.60% Day Change: -5.44 | |
| Week Change: 1.19% Year-to-date Change: 216.1% | |
| SMCI Links: Profile News Message Board | |
| Charts:- Daily , Weekly | |
| Add SMCI to Watchlist: View: Get Complete SMCI Trend Analysis ➞ | |
 | MSTR MicroStrategy Incorporated |
| Sector: Technology | |
| SubSector: Application Software | |
| MarketCap: 1164.52 Millions | |
| Recent Price: 1656.69 Smart Investing & Trading Score: 95 | |
| Day Percent Change: -4.08% Day Change: -70.55 | |
| Week Change: 4.56% Year-to-date Change: 162.3% | |
| MSTR Links: Profile News Message Board | |
| Charts:- Daily , Weekly | |
| Add MSTR to Watchlist: View: Get Complete MSTR Trend Analysis ➞ | |
 | SOUN SoundHound AI, Inc. |
| Sector: Technology | |
| SubSector: Software - Application | |
| MarketCap: 1040 Millions | |
| Recent Price: 5.17 Smart Investing & Trading Score: 52 | |
| Day Percent Change: -5.66% Day Change: -0.31 | |
| Week Change: 2.38% Year-to-date Change: 141.6% | |
| SOUN Links: Profile News Message Board | |
| Charts:- Daily , Weekly | |
| Add SOUN to Watchlist: View: Get Complete SOUN Trend Analysis ➞ | |
 | ZETA Zeta Global Holdings Corp. |
| Sector: Technology | |
| SubSector: Software - Application | |
| MarketCap: 1780 Millions | |
| Recent Price: 18.29 Smart Investing & Trading Score: 95 | |
| Day Percent Change: 3.80% Day Change: 0.67 | |
| Week Change: 4.99% Year-to-date Change: 107.3% | |
| ZETA Links: Profile News Message Board | |
| Charts:- Daily , Weekly | |
| Add ZETA to Watchlist: View: Get Complete ZETA Trend Analysis ➞ | |
 | PI Impinj, Inc. |
| Sector: Technology | |
| SubSector: Communication Equipment | |
| MarketCap: 364.739 Millions | |
| Recent Price: 167.63 Smart Investing & Trading Score: 71 | |
| Day Percent Change: -1.17% Day Change: -1.98 | |
| Week Change: -3.33% Year-to-date Change: 86.2% | |
| PI Links: Profile News Message Board | |
| Charts:- Daily , Weekly | |
| Add PI to Watchlist: View: Get Complete PI Trend Analysis ➞ | |
 | SMTC Semtech Corporation |
| Sector: Technology | |
| SubSector: Semiconductor - Integrated Circuits | |
| MarketCap: 2285 Millions | |
| Recent Price: 40.62 Smart Investing & Trading Score: 95 | |
| Day Percent Change: 1.02% Day Change: 0.41 | |
| Week Change: 1.68% Year-to-date Change: 85.4% | |
| SMTC Links: Profile News Message Board | |
| Charts:- Daily , Weekly | |
| Add SMTC to Watchlist: View: Get Complete SMTC Trend Analysis ➞ | |
 | NN NextNav Inc. |
| Sector: Technology | |
| SubSector: Software - Infrastructure | |
| MarketCap: 314 Millions | |
| Recent Price: 7.53 Smart Investing & Trading Score: 41 | |
| Day Percent Change: -4.68% Day Change: -0.37 | |
| Week Change: -7.04% Year-to-date Change: 69.2% | |
| NN Links: Profile News Message Board | |
| Charts:- Daily , Weekly | |
| Add NN to Watchlist: View: Get Complete NN Trend Analysis ➞ | |
 | VERI Veritone, Inc. |
| Sector: Technology | |
| SubSector: Application Software | |
| MarketCap: 52.1662 Millions | |
| Recent Price: 3.07 Smart Investing & Trading Score: 36 | |
| Day Percent Change: -1.92% Day Change: -0.06 | |
| Week Change: 0.33% Year-to-date Change: 68.7% | |
| VERI Links: Profile News Message Board | |
| Charts:- Daily , Weekly | |
| Add VERI to Watchlist: View: Get Complete VERI Trend Analysis ➞ | |
 | MTTR Matterport, Inc. |
| Sector: Technology | |
| SubSector: Software - Application | |
| MarketCap: 920 Millions | |
| Recent Price: 4.45 Smart Investing & Trading Score: 51 | |
| Day Percent Change: -1.22% Day Change: -0.05 | |
| Week Change: -1% Year-to-date Change: 64.6% | |
| MTTR Links: Profile News Message Board | |
| Charts:- Daily , Weekly | |
| Add MTTR to Watchlist: View: Get Complete MTTR Trend Analysis ➞ | |
 | MAX MediaAlpha, Inc. |
| Sector: Technology | |
| SubSector: Internet Content & Information | |
| MarketCap: 22537 Millions | |
| Recent Price: 18.26 Smart Investing & Trading Score: 10 | |
| Day Percent Change: -3.03% Day Change: -0.57 | |
| Week Change: -0.6% Year-to-date Change: 64.2% | |
| MAX Links: Profile News Message Board | |
| Charts:- Daily , Weekly | |
| Add MAX to Watchlist: View: Get Complete MAX Trend Analysis ➞ | |
 | BHE Benchmark Electronics, Inc. |
| Sector: Technology | |
| SubSector: Printed Circuit Boards | |
| MarketCap: 766.835 Millions | |
| Recent Price: 42.11 Smart Investing & Trading Score: 90 | |
| Day Percent Change: 0.36% Day Change: 0.15 | |
| Week Change: 2.23% Year-to-date Change: 52.4% | |
| BHE Links: Profile News Message Board | |
| Charts:- Daily , Weekly | |
| Add BHE to Watchlist: View: Get Complete BHE Trend Analysis ➞ | |
 | ONTO Onto Innovation Inc. |
| Sector: Technology | |
| SubSector: Semiconductor Equipment & Materials | |
| MarketCap: 1187.18 Millions | |
| Recent Price: 230.58 Smart Investing & Trading Score: 61 | |
| Day Percent Change: 1.26% Day Change: 2.88 | |
| Week Change: 3.17% Year-to-date Change: 50.8% | |
| ONTO Links: Profile News Message Board | |
| Charts:- Daily , Weekly | |
| Add ONTO to Watchlist: View: Get Complete ONTO Trend Analysis ➞ | |
 | HEAR Turtle Beach Corporation |
| Sector: Technology | |
| SubSector: Communication Equipment | |
| MarketCap: 73.0539 Millions | |
| Recent Price: 16.27 Smart Investing & Trading Score: 66 | |
| Day Percent Change: 1.18% Day Change: 0.19 | |
| Week Change: 1.75% Year-to-date Change: 48.6% | |
| HEAR Links: Profile News Message Board | |
| Charts:- Daily , Weekly | |
| Add HEAR to Watchlist: View: Get Complete HEAR Trend Analysis ➞ | |
 | BAND Bandwidth Inc. |
| Sector: Technology | |
| SubSector: Business Software & Services | |
| MarketCap: 1549.38 Millions | |
| Recent Price: 21.48 Smart Investing & Trading Score: 61 | |
| Day Percent Change: -2.10% Day Change: -0.46 | |
| Week Change: -3.46% Year-to-date Change: 48.5% | |
| BAND Links: Profile News Message Board | |
| Charts:- Daily , Weekly | |
| Add BAND to Watchlist: View: Get Complete BAND Trend Analysis ➞ | |
 | QTWO Q2 Holdings, Inc. |
| Sector: Technology | |
| SubSector: Business Software & Services | |
| MarketCap: 2815.88 Millions | |
| Recent Price: 63.53 Smart Investing & Trading Score: 85 | |
| Day Percent Change: -0.61% Day Change: -0.39 | |
| Week Change: 0.35% Year-to-date Change: 46.4% | |
| QTWO Links: Profile News Message Board | |
| Charts:- Daily , Weekly | |
| Add QTWO to Watchlist: View: Get Complete QTWO Trend Analysis ➞ | |
 | QNST QuinStreet, Inc. |
| Sector: Technology | |
| SubSector: Internet Software & Services | |
| MarketCap: 411.791 Millions | |
| Recent Price: 18.40 Smart Investing & Trading Score: 68 | |
| Day Percent Change: 0.71% Day Change: 0.13 | |
| Week Change: 1.66% Year-to-date Change: 43.5% | |
| QNST Links: Profile News Message Board | |
| Charts:- Daily , Weekly | |
| Add QNST to Watchlist: View: Get Complete QNST Trend Analysis ➞ | |
 | EVBG Everbridge, Inc. |
| Sector: Technology | |
| SubSector: Application Software | |
| MarketCap: 3697.92 Millions | |
| Recent Price: 34.75 Smart Investing & Trading Score: 63 | |
| Day Percent Change: -0.09% Day Change: -0.03 | |
| Week Change: -0.34% Year-to-date Change: 43.0% | |
| EVBG Links: Profile News Message Board | |
| Charts:- Daily , Weekly | |
| Add EVBG to Watchlist: View: Get Complete EVBG Trend Analysis ➞ | |
 | PUBM PubMatic, Inc. |
| Sector: Technology | |
| SubSector: Software Application | |
| MarketCap: 56787 Millions | |
| Recent Price: 23.10 Smart Investing & Trading Score: 59 | |
| Day Percent Change: -2.04% Day Change: -0.48 | |
| Week Change: -3.83% Year-to-date Change: 41.7% | |
| PUBM Links: Profile News Message Board | |
| Charts:- Daily , Weekly | |
| Add PUBM to Watchlist: View: Get Complete PUBM Trend Analysis ➞ | |
 | ITRI Itron, Inc. |
| Sector: Technology | |
| SubSector: Scientific & Technical Instruments | |
| MarketCap: 2222.23 Millions | |
| Recent Price: 107.00 Smart Investing & Trading Score: 51 | |
| Day Percent Change: -2.41% Day Change: -2.64 | |
| Week Change: -1.88% Year-to-date Change: 41.7% | |
| ITRI Links: Profile News Message Board | |
| Charts:- Daily , Weekly | |
| Add ITRI to Watchlist: View: Get Complete ITRI Trend Analysis ➞ | |
 | FORM FormFactor, Inc. |
| Sector: Technology | |
| SubSector: Semiconductor - Broad Line | |
| MarketCap: 1426.42 Millions | |
| Recent Price: 58.35 Smart Investing & Trading Score: 90 | |
| Day Percent Change: 1.39% Day Change: 0.80 | |
| Week Change: 4.74% Year-to-date Change: 39.9% | |
| FORM Links: Profile News Message Board | |
| Charts:- Daily , Weekly | |
| Add FORM to Watchlist: View: Get Complete FORM Trend Analysis ➞ | |
 | PSFE Paysafe Limited |
| Sector: Technology | |
| SubSector: Software - Infrastructure | |
| MarketCap: 605 Millions | |
| Recent Price: 18.02 Smart Investing & Trading Score: 76 | |
| Day Percent Change: 0.70% Day Change: 0.13 | |
| Week Change: -0.85% Year-to-date Change: 39.7% | |
| PSFE Links: Profile News Message Board | |
| Charts:- Daily , Weekly | |
| Add PSFE to Watchlist: View: Get Complete PSFE Trend Analysis ➞ | |
 | CVLT Commvault Systems, Inc. |
| Sector: Technology | |
| SubSector: Application Software | |
| MarketCap: 1607.22 Millions | |
| Recent Price: 110.70 Smart Investing & Trading Score: 66 | |
| Day Percent Change: 0.13% Day Change: 0.14 | |
| Week Change: -0.49% Year-to-date Change: 38.6% | |
| CVLT Links: Profile News Message Board | |
| Charts:- Daily , Weekly | |
| Add CVLT to Watchlist: View: Get Complete CVLT Trend Analysis ➞ | |
 | DSP Viant Technology Inc. |
| Sector: Technology | |
| SubSector: Software - Application | |
| MarketCap: 279 Millions | |
| Recent Price: 9.62 Smart Investing & Trading Score: 63 | |
| Day Percent Change: -3.95% Day Change: -0.39 | |
| Week Change: -5.64% Year-to-date Change: 38.5% | |
| DSP Links: Profile News Message Board | |
| Charts:- Daily , Weekly | |
| Add DSP to Watchlist: View: Get Complete DSP Trend Analysis ➞ | |
 | APPF AppFolio, Inc. |
| Sector: Technology | |
| SubSector: Application Software | |
| MarketCap: 3412.02 Millions | |
| Recent Price: 238.04 Smart Investing & Trading Score: 28 | |
| Day Percent Change: -2.10% Day Change: -5.10 | |
| Week Change: -1.06% Year-to-date Change: 37.4% | |
| APPF Links: Profile News Message Board | |
| Charts:- Daily , Weekly | |
| Add APPF to Watchlist: View: Get Complete APPF Trend Analysis ➞ | |
 | IMMR Immersion Corporation |
| Sector: Technology | |
| SubSector: Application Software | |
| MarketCap: 173.462 Millions | |
| Recent Price: 9.68 Smart Investing & Trading Score: 90 | |
| Day Percent Change: 2.87% Day Change: 0.27 | |
| Week Change: 3.64% Year-to-date Change: 37.1% | |
| IMMR Links: Profile News Message Board | |
| Charts:- Daily , Weekly | |
| Add IMMR to Watchlist: View: Get Complete IMMR Trend Analysis ➞ | |
| For tabular summary view of above stock list: Summary View ➞ 0 - 25 , 25 - 50 , 50 - 75 , 75 - 100 , 100 - 125 , 125 - 150 , 150 - 175 , 175 - 200 , 200 - 225 , 225 - 250 , 250 - 275 | ||
| Click To Change The Sort Order: By Market Cap or Company Size Performance: Year-to-date, Week and Day | |
| Select Chart Type: | ||
| Too many stocks? View smallcap stocks filtered by marketcap & sector |
| Marketcap: All SmallCap Stocks (default-no microcap), Large, Mid-Range, Small & MicroCap |
| Sector: Tech, Finance, Energy, Staples, Retail, Industrial, Materials, Utilities & Medical |
|
Best Stocks Today 12Stocks.com |
© 2024 12Stocks.com Terms & Conditions Privacy Contact Us
All Information Provided Only For Education And Not To Be Used For Investing or Trading. See Terms & Conditions


One More Thing ... Get Best Stocks Delivered Daily!
Never Ever Miss A Move With Our Top Ten Stocks Lists
Find Best Stocks In Any Market - Bull or Bear Market
Take A Peek At Our Top Ten Stocks Lists: Daily, Weekly, Year-to-Date & Top Trends
Find Best Stocks In Any Market - Bull or Bear Market
Take A Peek At Our Top Ten Stocks Lists: Daily, Weekly, Year-to-Date & Top Trends
Smallcap Stocks With Best Up Trends [0-bearish to 100-bullish]: Bloom Energy[100], Transcat [100], Third Harmonic[100], Arbutus Biopharma[100], CONSOL Energy[100], Gladstone Land[100], AZZ [100], Select Energy[100], Brink s[100], City Office[100], NuScale Power[100]
Best Smallcap Stocks Year-to-Date:
Janux [333.41%], Viking [244.98%], Longboard [233.55%], Avidity Biosciences[226.22%], Super Micro[216.08%], Novavax [210.73%], Arcutis Bio[193.5%], Stoke [192.21%], Sweetgreen [182.48%], Vera [163.11%], MicroStrategy [162.29%] Best Smallcap Stocks This Week:
Genelux [31.78%], Pulse Biosciences[24.58%], Overseas Shipholding[23.18%], Bloom Energy[22.71%], Scilex Holding[22.22%], GrafTech [20.11%], Powell Industries[18.92%], NuScale Power[18.46%], Dyne [17.81%], PTC [17.45%], Waldencast [16.55%] Best Smallcap Stocks Daily:
Bloom Energy[17.11%], Waldencast [16.55%], RAPT [15.00%], Transcat [14.00%], Presto Automation[13.89%], Powell Industries[13.86%], Pulse Biosciences[13.40%], GrafTech [12.97%], Genelux [11.86%], Relay [11.58%], Citius [10.79%]