
 Login Sign Up


| |||||
 |  | ||||

| 12Stocks.com Market Intelligence |
Best SmallCap Stocks
|
| In a hurry? Small Cap Stock Lists: Performance Trends Table, Stock Charts
Sort Small Cap stocks: Daily, Weekly, Year-to-Date, Market Cap & Trends. Filter Small Cap stocks list by sector: Show all, Tech, Finance, Energy, Staples, Retail, Industrial, Materials, Utilities and HealthCare Filter Small Cap stocks list by size: All Large Medium Small and MicroCap |
| 12Stocks.com Small Cap Stocks Performances & Trends Daily | |||||||||
|
|  The overall Smart Investing & Trading Score is 76 (0-bearish to 100-bullish) which puts Small Cap index in short term neutral to bullish trend. The Smart Investing & Trading Score from previous trading session is 90 and hence a deterioration of trend.
| ||||||||
Here are the Smart Investing & Trading Scores of the most requested small cap stocks at 12Stocks.com (click stock name for detailed review):
|


| 12Stocks.com: Investing in Smallcap Index with Stocks | |
|
The following table helps investors and traders sort through current performance and trends (as measured by Smart Investing & Trading Score) of various
stocks in the Smallcap Index. Quick View: Move mouse or cursor over stock symbol (ticker) to view short-term technical chart and over stock name to view long term chart. Click on  to add stock symbol to your watchlist and to add stock symbol to your watchlist and  to view watchlist. Click on any ticker or stock name for detailed market intelligence report for that stock. to view watchlist. Click on any ticker or stock name for detailed market intelligence report for that stock. |
12Stocks.com Performance of Stocks in Smallcap Index
| Ticker | Stock Name | Watchlist | Category | Recent Price | Smart Investing & Trading Score | Change % | YTD Change% |
| INSE | Inspired Entertainment |   | Services & Goods | 8.82 | 55 | 0.34% | -10.73% |
| ITI | Iteris | | Technology | 4.63 | 50 | 0.22% | -10.96% |
| OPRX | OptimizeRx | | Technology | 12.69 | 62 | -1.25% | -11.32% |
| SNFCA | Security National | | Financials | 7.90 | 74 | 1.54% | -12.22% |
| CHMG | Chemung Financial | | Financials | 43.41 | 66 | -0.21% | -12.83% |
| TZA | Direxion Daily | | Utilities | 17.35 | 17 | -0.17% | -13.03% |
| HQI | HireQuest | | Services & Goods | 13.25 | 74 | 4.25% | -13.68% |
| PLBC | Plumas Bancorp | | Financials | 35.38 | 69 | 0.80% | -14.44% |
| FBIZ | First Business | | Financials | 34.25 | 25 | -0.72% | -14.59% |
| PTSI | P.A.M. Transportation | | Transports | 17.67 | 64 | 0.34% | -14.97% |
| FRBA | First Bank | | Financials | 12.47 | 57 | 0.16% | -15.17% |
| CTXR | Citius | | Health Care | 0.65 | 7 | -2.86% | -15.68% |
| BW | Babcock & Wilcox Enterprises | | Industrials | 1.23 | 64 | 2.50% | -15.75% |
| OCN | Ocwen Financial | | Financials | 25.87 | 50 | -0.15% | -15.90% |
| TUSK | Mammoth Energy | | Energy | 3.75 | 95 | 0.27% | -15.92% |
| XERS | Xeris | | Health Care | 1.98 | 47 | -1.98% | -15.92% |
| FET | Forum Energy | | Energy | 18.61 | 35 | 0.70% | -16.06% |
| PBPB | Potbelly | | Services & Goods | 8.73 | 18 | -0.80% | -16.22% |
| FCCO | First Community | | Financials | 17.95 | 100 | 3.73% | -16.63% |
| MARA | Marathon Patent | | Services & Goods | 19.45 | 49 | -0.51% | -17.20% |
| OVLY | Oak Valley | | Financials | 24.71 | 50 | 1.27% | -17.50% |
| LEU | Centrus Energy | | Materials | 44.72 | 90 | 1.41% | -17.81% |
| SHBI | Shore Bancshares | | Financials | 11.67 | 100 | 2.64% | -18.11% |
| BWFG | Bankwell Financial | | Financials | 24.32 | 64 | 1.67% | -19.42% |
| TLYS | Tilly s | | Services & Goods | 6.07 | 32 | -2.57% | -19.50% |
| For chart view version of above stock list: Chart View ➞ 0 - 25 , 25 - 50 , 50 - 75 , 75 - 100 , 100 - 125 , 125 - 150 , 150 - 175 , 175 - 200 | ||
 | Click To Change The Sort Order: By Market Cap or Company Size Performance: Year-to-date, Week and Day |  |
| Too many stocks? View smallcap stocks filtered by marketcap & sector |
| Marketcap: All SmallCap Stocks (default-no microcap), Large, Mid-Range, Small |
| Smallcap Sector: Tech, Finance, Energy, Staples, Retail, Industrial, Materials, & Medical |
|
Get the most comprehensive stock market coverage daily at 12Stocks.com ➞ Best Stocks Today ➞ Best Stocks Weekly ➞ Best Stocks Year-to-Date ➞ Best Stocks Trends ➞  Best Stocks Today 12Stocks.com Best Nasdaq Stocks ➞ Best S&P 500 Stocks ➞ Best Tech Stocks ➞ Best Biotech Stocks ➞ |
| Detailed Overview of SmallCap Stocks |
| SmallCap Technical Overview, Leaders & Laggards, Top SmallCap ETF Funds & Detailed SmallCap Stocks List, Charts, Trends & More |
| Smallcap: Technical Analysis, Trends & YTD Performance | |
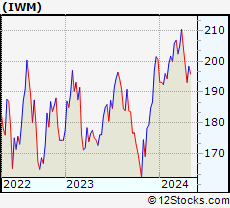
| SmallCap segment as represented by
IWM, an exchange-traded fund [ETF], holds basket of thousands of smallcap stocks from across all major sectors of the US stock market. The smallcap index (contains stocks like Riverbed & Sotheby's) is up by 3.67% and is currently underperforming the overall market by -6.9% year-to-date. Below is a quick view of technical charts and trends: | |
 IWM Weekly Chart |
|
| Long Term Trend: Very Good | |
| Medium Term Trend: Very Good | |
 IWM Daily Chart |
|
| Short Term Trend: Good | |
| Overall Trend Score: 76 | |
| YTD Performance: 3.67% | |
| **Trend Scores & Views Are Only For Educational Purposes And Not For Investing | |
| 12Stocks.com: Top Performing Small Cap Index Stocks | ||||||||||||||||||||||||||||||||||||||||||||||||
 The top performing Small Cap Index stocks year to date are
Now, more recently, over last week, the top performing Small Cap Index stocks on the move are


|
||||||||||||||||||||||||||||||||||||||||||||||||
| 12Stocks.com: Investing in Smallcap Index using Exchange Traded Funds | |
|
The following table shows list of key exchange traded funds (ETF) that
help investors track Smallcap index. The following list also includes leveraged ETF funds that track twice or thrice the daily returns of Smallcap indices. Short or inverse ETF funds move in the opposite direction to the index they track and are useful during market pullbacks or during bear markets. Quick View: Move mouse or cursor over ETF symbol (ticker) to view short-term technical chart and over ETF name to view long term chart. Click on ticker or stock name for detailed view. Click on to add stock symbol to your watchlist and to view watchlist. |
12Stocks.com List of ETFs that track Smallcap Index
| Ticker | ETF Name | Watchlist | Recent Price | Smart Investing & Trading Score | Change % | Week % | Year-to-date % |
| IWM | iShares Russell 2000 | | 208.08 | 76 | 0.07 | 1.85 | 3.67% |
| VTWO | Vanguard Russell 2000 ETF | | 84.11 | 71 | 0.00 | 1.8 | 3.71% |
| IJR | iShares Core S&P Small-Cap | | 110.39 | 68 | -0.22 | 1.29 | 1.98% |
| IWN | iShares Russell 2000 Value | | 158.71 | 76 | -0.07 | 1.61 | 2.18% |
| IWO | iShares Russell 2000 Growth | | 265.15 | 63 | -0.75 | 2.01 | 5.13% |
| IJS | iShares S&P Small-Cap 600 Value | | 101.87 | 76 | -0.15 | 1.34 | -1.16% |
| IJT | iShares S&P Small-Cap 600 Growth | | 131.34 | 71 | 0.04 | 1.14 | 4.95% |
| XSLV | PowerShares S&P SmallCap Low Volatil ETF | | 44.48 | 83 | -0.01 | 0.55 | 0.74% |
| SAA | ProShares Ultra SmallCap600 | | 24.90 | 71 | 0.50 | 2.28 | -0.18% |
| SMLV | SPDR SSGA US Small Cap Low Volatil ETF | | 113.28 | 95 | 0.43 | 1.85 | 0.68% |
| SDD | ProShares UltraShort SmallCap600 | | 17.84 | 35 | 0.96 | -2.41 | -3.19% |
| SBB | ProShares Short SmallCap600 | | 15.77 | 25 | 0.41 | -1.14 | -0.98% |
| 12Stocks.com: Charts, Trends, Fundamental Data and Performances of SmallCap Stocks | |
|
We now take in-depth look at all SmallCap stocks including charts, multi-period performances and overall trends (as measured by Smart Investing & Trading Score). One can sort SmallCap stocks (click link to choose) by Daily, Weekly and by Year-to-Date performances. Also, one can sort by size of the company or by market capitalization. |
| Select Your Default Chart Type: | |||||
| |||||
| Click on stock symbol or name for detailed view. Click on to add stock symbol to your watchlist and to view watchlist. Quick View: Move mouse or cursor over "Daily" to quickly view daily technical stock chart and over "Weekly" to view weekly technical stock chart. | |||||

 | INSE Inspired Entertainment, Inc. |
| Sector: Services & Goods | |
| SubSector: Gaming Activities | |
| MarketCap: 80.9289 Millions | |
| Recent Price: 8.82 Smart Investing & Trading Score: 55 | |
| Day Percent Change: 0.34% Day Change: 0.03 | |
| Week Change: 1.38% Year-to-date Change: -10.7% | |
| INSE Links: Profile News Message Board | |
| Charts:- Daily , Weekly | |
| Add INSE to Watchlist: View: Get Complete INSE Trend Analysis ➞ | |
 | ITI Iteris, Inc. |
| Sector: Technology | |
| SubSector: Communication Equipment | |
| MarketCap: 129.939 Millions | |
| Recent Price: 4.63 Smart Investing & Trading Score: 50 | |
| Day Percent Change: 0.22% Day Change: 0.01 | |
| Week Change: 0.65% Year-to-date Change: -11.0% | |
| ITI Links: Profile News Message Board | |
| Charts:- Daily , Weekly | |
| Add ITI to Watchlist: View: Get Complete ITI Trend Analysis ➞ | |
 | OPRX OptimizeRx Corporation |
| Sector: Technology | |
| SubSector: Healthcare Information Services | |
| MarketCap: 107.155 Millions | |
| Recent Price: 12.69 Smart Investing & Trading Score: 62 | |
| Day Percent Change: -1.25% Day Change: -0.16 | |
| Week Change: 17.39% Year-to-date Change: -11.3% | |
| OPRX Links: Profile News Message Board | |
| Charts:- Daily , Weekly | |
| Add OPRX to Watchlist: View: Get Complete OPRX Trend Analysis ➞ | |
 | SNFCA Security National Financial Corporation |
| Sector: Financials | |
| SubSector: Credit Services | |
| MarketCap: 81.0208 Millions | |
| Recent Price: 7.90 Smart Investing & Trading Score: 74 | |
| Day Percent Change: 1.54% Day Change: 0.12 | |
| Week Change: 17.04% Year-to-date Change: -12.2% | |
| SNFCA Links: Profile News Message Board | |
| Charts:- Daily , Weekly | |
| Add SNFCA to Watchlist: View: Get Complete SNFCA Trend Analysis ➞ | |
 | CHMG Chemung Financial Corporation |
| Sector: Financials | |
| SubSector: Regional - Pacific Banks | |
| MarketCap: 142.229 Millions | |
| Recent Price: 43.41 Smart Investing & Trading Score: 66 | |
| Day Percent Change: -0.21% Day Change: -0.09 | |
| Week Change: 0.25% Year-to-date Change: -12.8% | |
| CHMG Links: Profile News Message Board | |
| Charts:- Daily , Weekly | |
| Add CHMG to Watchlist: View: Get Complete CHMG Trend Analysis ➞ | |
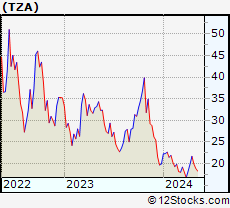 | TZA Direxion Daily Small Cap Bear 3X ETF |
| Sector: Utilities | |
| SubSector: Exchange Traded Fund | |
| MarketCap: 0 Millions | |
| Recent Price: 17.35 Smart Investing & Trading Score: 17 | |
| Day Percent Change: -0.17% Day Change: -0.03 | |
| Week Change: -5.29% Year-to-date Change: -13.0% | |
| TZA Links: Profile News Message Board | |
| Charts:- Daily , Weekly | |
| Add TZA to Watchlist: View: Get Complete TZA Trend Analysis ➞ | |
 | HQI HireQuest, Inc. |
| Sector: Services & Goods | |
| SubSector: Staffing & Outsourcing Services | |
| MarketCap: 77 Millions | |
| Recent Price: 13.25 Smart Investing & Trading Score: 74 | |
| Day Percent Change: 4.25% Day Change: 0.54 | |
| Week Change: 11.34% Year-to-date Change: -13.7% | |
| HQI Links: Profile News Message Board | |
| Charts:- Daily , Weekly | |
| Add HQI to Watchlist: View: Get Complete HQI Trend Analysis ➞ | |
 | PLBC Plumas Bancorp |
| Sector: Financials | |
| SubSector: Regional - Pacific Banks | |
| MarketCap: 85.0829 Millions | |
| Recent Price: 35.38 Smart Investing & Trading Score: 69 | |
| Day Percent Change: 0.80% Day Change: 0.28 | |
| Week Change: 0.51% Year-to-date Change: -14.4% | |
| PLBC Links: Profile News Message Board | |
| Charts:- Daily , Weekly | |
| Add PLBC to Watchlist: View: Get Complete PLBC Trend Analysis ➞ | |
 | FBIZ First Business Financial Services, Inc. |
| Sector: Financials | |
| SubSector: Regional - Midwest Banks | |
| MarketCap: 144.97 Millions | |
| Recent Price: 34.25 Smart Investing & Trading Score: 25 | |
| Day Percent Change: -0.72% Day Change: -0.25 | |
| Week Change: -1.75% Year-to-date Change: -14.6% | |
| FBIZ Links: Profile News Message Board | |
| Charts:- Daily , Weekly | |
| Add FBIZ to Watchlist: View: Get Complete FBIZ Trend Analysis ➞ | |
 | PTSI P.A.M. Transportation Services, Inc. |
| Sector: Transports | |
| SubSector: Trucking | |
| MarketCap: 136.915 Millions | |
| Recent Price: 17.67 Smart Investing & Trading Score: 64 | |
| Day Percent Change: 0.34% Day Change: 0.06 | |
| Week Change: 0.57% Year-to-date Change: -15.0% | |
| PTSI Links: Profile News Message Board | |
| Charts:- Daily , Weekly | |
| Add PTSI to Watchlist: View: Get Complete PTSI Trend Analysis ➞ | |
 | FRBA First Bank |
| Sector: Financials | |
| SubSector: Regional - Mid-Atlantic Banks | |
| MarketCap: 124.859 Millions | |
| Recent Price: 12.47 Smart Investing & Trading Score: 57 | |
| Day Percent Change: 0.16% Day Change: 0.02 | |
| Week Change: 1.46% Year-to-date Change: -15.2% | |
| FRBA Links: Profile News Message Board | |
| Charts:- Daily , Weekly | |
| Add FRBA to Watchlist: View: Get Complete FRBA Trend Analysis ➞ | |
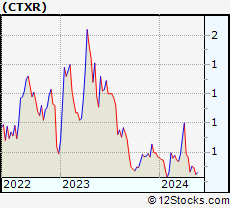 | CTXR Citius Pharmaceuticals, Inc. |
| Sector: Health Care | |
| SubSector: Biotechnology | |
| MarketCap: 17.5785 Millions | |
| Recent Price: 0.65 Smart Investing & Trading Score: 7 | |
| Day Percent Change: -2.86% Day Change: -0.02 | |
| Week Change: -6.66% Year-to-date Change: -15.7% | |
| CTXR Links: Profile News Message Board | |
| Charts:- Daily , Weekly | |
| Add CTXR to Watchlist: View: Get Complete CTXR Trend Analysis ➞ | |
 | BW Babcock & Wilcox Enterprises, Inc. |
| Sector: Industrials | |
| SubSector: Industrial Electrical Equipment | |
| MarketCap: 59.0879 Millions | |
| Recent Price: 1.23 Smart Investing & Trading Score: 64 | |
| Day Percent Change: 2.50% Day Change: 0.03 | |
| Week Change: -4.65% Year-to-date Change: -15.8% | |
| BW Links: Profile News Message Board | |
| Charts:- Daily , Weekly | |
| Add BW to Watchlist: View: Get Complete BW Trend Analysis ➞ | |
 | OCN Ocwen Financial Corporation |
| Sector: Financials | |
| SubSector: Mortgage Investment | |
| MarketCap: 73.7739 Millions | |
| Recent Price: 25.87 Smart Investing & Trading Score: 50 | |
| Day Percent Change: -0.15% Day Change: -0.04 | |
| Week Change: -1.37% Year-to-date Change: -15.9% | |
| OCN Links: Profile News Message Board | |
| Charts:- Daily , Weekly | |
| Add OCN to Watchlist: View: Get Complete OCN Trend Analysis ➞ | |
 | TUSK Mammoth Energy Services, Inc. |
| Sector: Energy | |
| SubSector: Oil & Gas Drilling & Exploration | |
| MarketCap: 59.5139 Millions | |
| Recent Price: 3.75 Smart Investing & Trading Score: 95 | |
| Day Percent Change: 0.27% Day Change: 0.01 | |
| Week Change: 11.28% Year-to-date Change: -15.9% | |
| TUSK Links: Profile News Message Board | |
| Charts:- Daily , Weekly | |
| Add TUSK to Watchlist: View: Get Complete TUSK Trend Analysis ➞ | |
 | XERS Xeris Pharmaceuticals, Inc. |
| Sector: Health Care | |
| SubSector: Biotechnology | |
| MarketCap: 74.5785 Millions | |
| Recent Price: 1.98 Smart Investing & Trading Score: 47 | |
| Day Percent Change: -1.98% Day Change: -0.04 | |
| Week Change: 12.5% Year-to-date Change: -15.9% | |
| XERS Links: Profile News Message Board | |
| Charts:- Daily , Weekly | |
| Add XERS to Watchlist: View: Get Complete XERS Trend Analysis ➞ | |
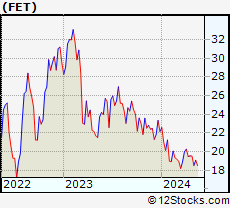 | FET Forum Energy Technologies, Inc. |
| Sector: Energy | |
| SubSector: Oil & Gas Equipment & Services | |
| MarketCap: 26.7461 Millions | |
| Recent Price: 18.61 Smart Investing & Trading Score: 35 | |
| Day Percent Change: 0.70% Day Change: 0.13 | |
| Week Change: -2.46% Year-to-date Change: -16.1% | |
| FET Links: Profile News Message Board | |
| Charts:- Daily , Weekly | |
| Add FET to Watchlist: View: Get Complete FET Trend Analysis ➞ | |
 | PBPB Potbelly Corporation |
| Sector: Services & Goods | |
| SubSector: Specialty Eateries | |
| MarketCap: 58.8 Millions | |
| Recent Price: 8.73 Smart Investing & Trading Score: 18 | |
| Day Percent Change: -0.80% Day Change: -0.07 | |
| Week Change: -0.91% Year-to-date Change: -16.2% | |
| PBPB Links: Profile News Message Board | |
| Charts:- Daily , Weekly | |
| Add PBPB to Watchlist: View: Get Complete PBPB Trend Analysis ➞ | |
 | FCCO First Community Corporation |
| Sector: Financials | |
| SubSector: Regional - Southwest Banks | |
| MarketCap: 123.865 Millions | |
| Recent Price: 17.95 Smart Investing & Trading Score: 100 | |
| Day Percent Change: 3.73% Day Change: 0.64 | |
| Week Change: 11.28% Year-to-date Change: -16.6% | |
| FCCO Links: Profile News Message Board | |
| Charts:- Daily , Weekly | |
| Add FCCO to Watchlist: View: Get Complete FCCO Trend Analysis ➞ | |
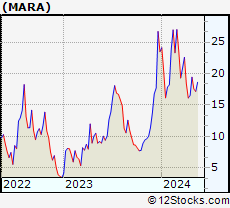 | MARA Marathon Patent Group, Inc. |
| Sector: Services & Goods | |
| SubSector: Business Services | |
| MarketCap: 5.34782 Millions | |
| Recent Price: 19.45 Smart Investing & Trading Score: 49 | |
| Day Percent Change: -0.51% Day Change: -0.10 | |
| Week Change: 13.34% Year-to-date Change: -17.2% | |
| MARA Links: Profile News Message Board | |
| Charts:- Daily , Weekly | |
| Add MARA to Watchlist: View: Get Complete MARA Trend Analysis ➞ | |
 | OVLY Oak Valley Bancorp |
| Sector: Financials | |
| SubSector: Regional - Pacific Banks | |
| MarketCap: 148.429 Millions | |
| Recent Price: 24.71 Smart Investing & Trading Score: 50 | |
| Day Percent Change: 1.27% Day Change: 0.31 | |
| Week Change: 4.04% Year-to-date Change: -17.5% | |
| OVLY Links: Profile News Message Board | |
| Charts:- Daily , Weekly | |
| Add OVLY to Watchlist: View: Get Complete OVLY Trend Analysis ➞ | |
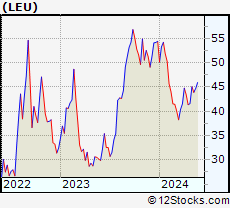 | LEU Centrus Energy Corp. |
| Sector: Materials | |
| SubSector: Industrial Metals & Minerals | |
| MarketCap: 41.191 Millions | |
| Recent Price: 44.72 Smart Investing & Trading Score: 90 | |
| Day Percent Change: 1.41% Day Change: 0.62 | |
| Week Change: 1.89% Year-to-date Change: -17.8% | |
| LEU Links: Profile News Message Board | |
| Charts:- Daily , Weekly | |
| Add LEU to Watchlist: View: Get Complete LEU Trend Analysis ➞ | |
 | SHBI Shore Bancshares, Inc. |
| Sector: Financials | |
| SubSector: Regional - Mid-Atlantic Banks | |
| MarketCap: 131.359 Millions | |
| Recent Price: 11.67 Smart Investing & Trading Score: 100 | |
| Day Percent Change: 2.64% Day Change: 0.30 | |
| Week Change: 4.1% Year-to-date Change: -18.1% | |
| SHBI Links: Profile News Message Board | |
| Charts:- Daily , Weekly | |
| Add SHBI to Watchlist: View: Get Complete SHBI Trend Analysis ➞ | |
 | BWFG Bankwell Financial Group, Inc. |
| Sector: Financials | |
| SubSector: Regional - Northeast Banks | |
| MarketCap: 142.899 Millions | |
| Recent Price: 24.32 Smart Investing & Trading Score: 64 | |
| Day Percent Change: 1.67% Day Change: 0.40 | |
| Week Change: 2.44% Year-to-date Change: -19.4% | |
| BWFG Links: Profile News Message Board | |
| Charts:- Daily , Weekly | |
| Add BWFG to Watchlist: View: Get Complete BWFG Trend Analysis ➞ | |
 | TLYS Tilly s, Inc. |
| Sector: Services & Goods | |
| SubSector: Apparel Stores | |
| MarketCap: 127.408 Millions | |
| Recent Price: 6.07 Smart Investing & Trading Score: 32 | |
| Day Percent Change: -2.57% Day Change: -0.16 | |
| Week Change: 0.5% Year-to-date Change: -19.5% | |
| TLYS Links: Profile News Message Board | |
| Charts:- Daily , Weekly | |
| Add TLYS to Watchlist: View: Get Complete TLYS Trend Analysis ➞ | |
| For tabular summary view of above stock list: Summary View ➞ 0 - 25 , 25 - 50 , 50 - 75 , 75 - 100 , 100 - 125 , 125 - 150 , 150 - 175 , 175 - 200 | ||
| Click To Change The Sort Order: By Market Cap or Company Size Performance: Year-to-date, Week and Day | |
| Select Chart Type: | ||
| Too many stocks? View smallcap stocks filtered by marketcap & sector |
| Marketcap: All SmallCap Stocks (default-no microcap), Large, Mid-Range, Small & MicroCap |
| Sector: Tech, Finance, Energy, Staples, Retail, Industrial, Materials, Utilities & Medical |
|
Best Stocks Today 12Stocks.com |
© 2024 12Stocks.com Terms & Conditions Privacy Contact Us
All Information Provided Only For Education And Not To Be Used For Investing or Trading. See Terms & Conditions


One More Thing ... Get Best Stocks Delivered Daily!
Never Ever Miss A Move With Our Top Ten Stocks Lists
Find Best Stocks In Any Market - Bull or Bear Market
Take A Peek At Our Top Ten Stocks Lists: Daily, Weekly, Year-to-Date & Top Trends
Find Best Stocks In Any Market - Bull or Bear Market
Take A Peek At Our Top Ten Stocks Lists: Daily, Weekly, Year-to-Date & Top Trends
Smallcap Stocks With Best Up Trends [0-bearish to 100-bullish]: CommScope Holding[100], Coeur Mining[100], Hecla Mining[100], MicroStrategy [100], Enovix [100], Rayonier Advanced[100], Nurix [100], Energy Fuels[100], NovaGold Resources[100], Piedmont Lithium[100], Wave Life[100]
Best Smallcap Stocks Year-to-Date:
CareMax [495.88%], Bakkt [413.9%], Janux [338.34%], Viking [260.02%], Alpine Immune[241.23%], Longboard [238.63%], Avidity Biosciences[226.33%], Super Micro[212.35%], Arcutis Bio[184.83%], Sweetgreen [180.97%], Novavax [171.04%] Best Smallcap Stocks This Week:
Vaxxinity [58.82%], Novavax [46.51%], Vicarious Surgical[45.62%], Harrow Health[44.48%], ProKidney [44.31%], Workhorse Group[36.06%], Maxeon Solar[35.94%], Fossil Group[35.44%], Humacyte [34.68%], MicroStrategy [34.23%], Cadiz [33.48%] Best Smallcap Stocks Daily:
Vaxxinity [45.95%], Presto Automation[31.90%], Vicarious Surgical[27.93%], Orchestra BioMed[12.77%], CommScope Holding[11.86%], Coeur Mining[11.57%], Hecla Mining[11.11%], MicroStrategy [10.04%], Tenaya [9.65%], Bakkt [9.25%], Enovix [9.25%]