
 Login Sign Up


| |||||
 |  | ||||

| 12Stocks.com Market Intelligence |
Best SmallCap Stocks
|
| In a hurry? Small Cap Stock Lists: Performance Trends Table, Stock Charts
Sort Small Cap stocks: Daily, Weekly, Year-to-Date, Market Cap & Trends. Filter Small Cap stocks list by sector: Show all, Tech, Finance, Energy, Staples, Retail, Industrial, Materials, Utilities and HealthCare Filter Small Cap stocks list by size: All Large Medium Small and MicroCap |
| 12Stocks.com Small Cap Stocks Performances & Trends Daily | |||||||||
|
|  The overall Smart Investing & Trading Score is 88 (0-bearish to 100-bullish) which puts Small Cap index in short term bullish trend. The Smart Investing & Trading Score from previous trading session is 56 and hence an improvement of trend.
| ||||||||
Here are the Smart Investing & Trading Scores of the most requested small cap stocks at 12Stocks.com (click stock name for detailed review):
|


| 12Stocks.com: Investing in Smallcap Index with Stocks | |
|
The following table helps investors and traders sort through current performance and trends (as measured by Smart Investing & Trading Score) of various
stocks in the Smallcap Index. Quick View: Move mouse or cursor over stock symbol (ticker) to view short-term technical chart and over stock name to view long term chart. Click on  to add stock symbol to your watchlist and to add stock symbol to your watchlist and  to view watchlist. Click on any ticker or stock name for detailed market intelligence report for that stock. to view watchlist. Click on any ticker or stock name for detailed market intelligence report for that stock. |
12Stocks.com Performance of Stocks in Smallcap Index
| Ticker | Stock Name | Watchlist | Category | Recent Price | Smart Investing & Trading Score | Change % | YTD Change% |
| CSTM | Constellium SE |   | Materials | 20.73 | 68 | 0.12% | 3.83% |
| WOR | Worthington Industries | | Materials | 58.60 | 58 | 0.33% | 1.82% |
| ZEUS | Olympic Steel | | Materials | 67.58 | 45 | 1.34% | 1.31% |
| DC | Dakota Gold | | Materials | 2.62 | 66 | 1.95% | 0.77% |
| ARCH | Arch Coal | | Materials | 165.59 | 52 | 0.71% | -0.21% |
| RYAM | Rayonier Advanced | | Materials | 4.04 | 20 | 3.86% | -0.25% |
| VHI | Valhi | | Materials | 15.08 | 68 | 0.53% | -0.72% |
| IOSP | Innospec | | Materials | 121.97 | 51 | 0.70% | -1.03% |
| SXC | SunCoke Energy | | Materials | 10.56 | 51 | -0.14% | -1.72% |
| BTU | Peabody Energy | | Materials | 23.50 | 47 | -0.61% | -3.35% |
| BCPC | Balchem | | Materials | 139.16 | 38 | -0.07% | -6.45% |
| MTRN | Materion | | Materials | 121.56 | 65 | 1.80% | -6.59% |
| WDFC | WD-40 | | Materials | 223.25 | 10 | -1.01% | -6.62% |
| ROCK | Gibraltar Industries | | Materials | 73.56 | 50 | 1.79% | -6.87% |
| FUL | H.B. Fuller | | Materials | 75.25 | 25 | 1.37% | -7.57% |
| FF | FutureFuel | | Materials | 5.62 | 40 | 1.08% | -7.57% |
| GRWG | GrowGeneration | | Materials | 2.31 | 22 | 4.28% | -7.77% |
| ORGN | Origin Materials | | Materials | 0.76 | 61 | 7.46% | -10.43% |
| KWR | Quaker Chemical | | Materials | 190.63 | 45 | 0.21% | -10.68% |
| SCL | Stepan | | Materials | 84.43 | 67 | 0.54% | -10.70% |
| LXU | LSB Industries | | Materials | 8.22 | 95 | 0.18% | -11.65% |
| METCB | Ramaco Resources | | Materials | 11.68 | 28 | 1.26% | -11.89% |
| ASIX | AdvanSix | | Materials | 26.16 | 53 | 0.56% | -12.70% |
| CEIX | CONSOL Energy | | Materials | 87.11 | 64 | 1.61% | -13.35% |
| ACET | Aceto | | Materials | 1.63 | 50 | -2.98% | -13.76% |
| For chart view version of above stock list: Chart View ➞ 0 - 25 , 25 - 50 , 50 - 75 | ||
 | Click To Change The Sort Order: By Market Cap or Company Size Performance: Year-to-date, Week and Day |  |
| Too many stocks? View smallcap stocks filtered by marketcap & sector |
| Marketcap: All SmallCap Stocks (default-no microcap), Large, Mid-Range, Small |
| Smallcap Sector: Tech, Finance, Energy, Staples, Retail, Industrial, Materials, & Medical |
|
Get the most comprehensive stock market coverage daily at 12Stocks.com ➞ Best Stocks Today ➞ Best Stocks Weekly ➞ Best Stocks Year-to-Date ➞ Best Stocks Trends ➞  Best Stocks Today 12Stocks.com Best Nasdaq Stocks ➞ Best S&P 500 Stocks ➞ Best Tech Stocks ➞ Best Biotech Stocks ➞ |
| Detailed Overview of SmallCap Stocks |
| SmallCap Technical Overview, Leaders & Laggards, Top SmallCap ETF Funds & Detailed SmallCap Stocks List, Charts, Trends & More |
| Smallcap: Technical Analysis, Trends & YTD Performance | |
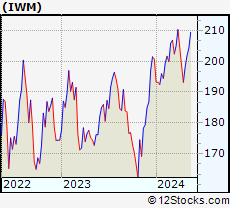
| SmallCap segment as represented by
IWM, an exchange-traded fund [ETF], holds basket of thousands of smallcap stocks from across all major sectors of the US stock market. The smallcap index (contains stocks like Riverbed & Sotheby's) is down by -0.36% and is currently underperforming the overall market by -6.65% year-to-date. Below is a quick view of technical charts and trends: | |
 IWM Weekly Chart |
|
| Long Term Trend: Very Good | |
| Medium Term Trend: Good | |
 IWM Daily Chart |
|
| Short Term Trend: Very Good | |
| Overall Trend Score: 88 | |
| YTD Performance: -0.36% | |
| **Trend Scores & Views Are Only For Educational Purposes And Not For Investing | |
| 12Stocks.com: Top Performing Small Cap Index Stocks | ||||||||||||||||||||||||||||||||||||||||||||||||
 The top performing Small Cap Index stocks year to date are
Now, more recently, over last week, the top performing Small Cap Index stocks on the move are


|
||||||||||||||||||||||||||||||||||||||||||||||||
| 12Stocks.com: Investing in Smallcap Index using Exchange Traded Funds | |
|
The following table shows list of key exchange traded funds (ETF) that
help investors track Smallcap index. The following list also includes leveraged ETF funds that track twice or thrice the daily returns of Smallcap indices. Short or inverse ETF funds move in the opposite direction to the index they track and are useful during market pullbacks or during bear markets. Quick View: Move mouse or cursor over ETF symbol (ticker) to view short-term technical chart and over ETF name to view long term chart. Click on ticker or stock name for detailed view. Click on to add stock symbol to your watchlist and to view watchlist. |
12Stocks.com List of ETFs that track Smallcap Index
| Ticker | ETF Name | Watchlist | Recent Price | Smart Investing & Trading Score | Change % | Week % | Year-to-date % |
| IWM | iShares Russell 2000 | | 199.98 | 88 | 0.80 | 0.8 | -0.36% |
| VTWO | Vanguard Russell 2000 ETF | | 80.77 | 88 | 0.69 | 0.69 | -0.41% |
| IWN | iShares Russell 2000 Value | | 152.09 | 93 | 0.63 | 0.63 | -2.09% |
| IJR | iShares Core S&P Small-Cap | | 106.37 | 93 | 0.68 | 0.68 | -1.74% |
| IWO | iShares Russell 2000 Growth | | 255.17 | 78 | 0.82 | 0.82 | 1.17% |
| IJS | iShares S&P Small-Cap 600 Value | | 97.96 | 70 | 0.79 | 0.79 | -4.96% |
| XSLV | PowerShares S&P SmallCap Low Volatil ETF | | 42.97 | 80 | 0.59 | 0.59 | -2.67% |
| IJT | iShares S&P Small-Cap 600 Growth | | 126.09 | 88 | 0.00 | 0 | 0.76% |
| SAA | ProShares Ultra SmallCap600 | | 23.27 | 88 | 1.00 | 1 | -6.73% |
| SBB | ProShares Short SmallCap600 | | 16.28 | 8 | -0.64 | -0.64 | 2.2% |
| SMLV | SPDR SSGA US Small Cap Low Volatil ETF | | 107.62 | 75 | 0.10 | 0.1 | -4.35% |
| SDD | ProShares UltraShort SmallCap600 | | 19.09 | 15 | -1.34 | -1.34 | 3.6% |
| 12Stocks.com: Charts, Trends, Fundamental Data and Performances of SmallCap Stocks | |
|
We now take in-depth look at all SmallCap stocks including charts, multi-period performances and overall trends (as measured by Smart Investing & Trading Score). One can sort SmallCap stocks (click link to choose) by Daily, Weekly and by Year-to-Date performances. Also, one can sort by size of the company or by market capitalization. |
| Select Your Default Chart Type: | |||||
| |||||
| Click on stock symbol or name for detailed view. Click on to add stock symbol to your watchlist and to view watchlist. Quick View: Move mouse or cursor over "Daily" to quickly view daily technical stock chart and over "Weekly" to view weekly technical stock chart. | |||||

 | CSTM Constellium SE |
| Sector: Materials | |
| SubSector: Aluminum | |
| MarketCap: 646.608 Millions | |
| Recent Price: 20.73 Smart Investing & Trading Score: 68 | |
| Day Percent Change: 0.12% Day Change: 0.03 | |
| Week Change: 0.12% Year-to-date Change: 3.8% | |
| CSTM Links: Profile News Message Board | |
| Charts:- Daily , Weekly | |
| Add CSTM to Watchlist: View: Get Complete CSTM Trend Analysis ➞ | |
 | WOR Worthington Industries, Inc. |
| Sector: Materials | |
| SubSector: Steel & Iron | |
| MarketCap: 1354.48 Millions | |
| Recent Price: 58.60 Smart Investing & Trading Score: 58 | |
| Day Percent Change: 0.33% Day Change: 0.19 | |
| Week Change: 0.33% Year-to-date Change: 1.8% | |
| WOR Links: Profile News Message Board | |
| Charts:- Daily , Weekly | |
| Add WOR to Watchlist: View: Get Complete WOR Trend Analysis ➞ | |
 | ZEUS Olympic Steel, Inc. |
| Sector: Materials | |
| SubSector: Steel & Iron | |
| MarketCap: 118.888 Millions | |
| Recent Price: 67.58 Smart Investing & Trading Score: 45 | |
| Day Percent Change: 1.34% Day Change: 0.89 | |
| Week Change: 1.34% Year-to-date Change: 1.3% | |
| ZEUS Links: Profile News Message Board | |
| Charts:- Daily , Weekly | |
| Add ZEUS to Watchlist: View: Get Complete ZEUS Trend Analysis ➞ | |
 | DC Dakota Gold Corp. |
| Sector: Materials | |
| SubSector: Gold | |
| MarketCap: 218 Millions | |
| Recent Price: 2.62 Smart Investing & Trading Score: 66 | |
| Day Percent Change: 1.95% Day Change: 0.05 | |
| Week Change: 1.95% Year-to-date Change: 0.8% | |
| DC Links: Profile News Message Board | |
| Charts:- Daily , Weekly | |
| Add DC to Watchlist: View: Get Complete DC Trend Analysis ➞ | |
 | ARCH Arch Coal, Inc. |
| Sector: Materials | |
| SubSector: Industrial Metals & Minerals | |
| MarketCap: 547.21 Millions | |
| Recent Price: 165.59 Smart Investing & Trading Score: 52 | |
| Day Percent Change: 0.71% Day Change: 1.17 | |
| Week Change: 0.71% Year-to-date Change: -0.2% | |
| ARCH Links: Profile News Message Board | |
| Charts:- Daily , Weekly | |
| Add ARCH to Watchlist: View: Get Complete ARCH Trend Analysis ➞ | |
 | RYAM Rayonier Advanced Materials Inc. |
| Sector: Materials | |
| SubSector: Chemicals - Major Diversified | |
| MarketCap: 116.736 Millions | |
| Recent Price: 4.04 Smart Investing & Trading Score: 20 | |
| Day Percent Change: 3.86% Day Change: 0.15 | |
| Week Change: 3.86% Year-to-date Change: -0.3% | |
| RYAM Links: Profile News Message Board | |
| Charts:- Daily , Weekly | |
| Add RYAM to Watchlist: View: Get Complete RYAM Trend Analysis ➞ | |
 | VHI Valhi, Inc. |
| Sector: Materials | |
| SubSector: Chemicals - Major Diversified | |
| MarketCap: 394.336 Millions | |
| Recent Price: 15.08 Smart Investing & Trading Score: 68 | |
| Day Percent Change: 0.53% Day Change: 0.08 | |
| Week Change: 0.53% Year-to-date Change: -0.7% | |
| VHI Links: Profile News Message Board | |
| Charts:- Daily , Weekly | |
| Add VHI to Watchlist: View: Get Complete VHI Trend Analysis ➞ | |
 | IOSP Innospec Inc. |
| Sector: Materials | |
| SubSector: Specialty Chemicals | |
| MarketCap: 1665.57 Millions | |
| Recent Price: 121.97 Smart Investing & Trading Score: 51 | |
| Day Percent Change: 0.70% Day Change: 0.85 | |
| Week Change: 0.7% Year-to-date Change: -1.0% | |
| IOSP Links: Profile News Message Board | |
| Charts:- Daily , Weekly | |
| Add IOSP to Watchlist: View: Get Complete IOSP Trend Analysis ➞ | |
 | SXC SunCoke Energy, Inc. |
| Sector: Materials | |
| SubSector: Nonmetallic Mineral Mining | |
| MarketCap: 306.5 Millions | |
| Recent Price: 10.56 Smart Investing & Trading Score: 51 | |
| Day Percent Change: -0.14% Day Change: -0.02 | |
| Week Change: -0.14% Year-to-date Change: -1.7% | |
| SXC Links: Profile News Message Board | |
| Charts:- Daily , Weekly | |
| Add SXC to Watchlist: View: Get Complete SXC Trend Analysis ➞ | |
 | BTU Peabody Energy Corporation |
| Sector: Materials | |
| SubSector: Industrial Metals & Minerals | |
| MarketCap: 355.11 Millions | |
| Recent Price: 23.50 Smart Investing & Trading Score: 47 | |
| Day Percent Change: -0.61% Day Change: -0.14 | |
| Week Change: -0.61% Year-to-date Change: -3.4% | |
| BTU Links: Profile News Message Board | |
| Charts:- Daily , Weekly | |
| Add BTU to Watchlist: View: Get Complete BTU Trend Analysis ➞ | |
 | BCPC Balchem Corporation |
| Sector: Materials | |
| SubSector: Specialty Chemicals | |
| MarketCap: 3330.17 Millions | |
| Recent Price: 139.16 Smart Investing & Trading Score: 38 | |
| Day Percent Change: -0.07% Day Change: -0.10 | |
| Week Change: -0.07% Year-to-date Change: -6.5% | |
| BCPC Links: Profile News Message Board | |
| Charts:- Daily , Weekly | |
| Add BCPC to Watchlist: View: Get Complete BCPC Trend Analysis ➞ | |
 | MTRN Materion Corporation |
| Sector: Materials | |
| SubSector: Industrial Metals & Minerals | |
| MarketCap: 703.71 Millions | |
| Recent Price: 121.56 Smart Investing & Trading Score: 65 | |
| Day Percent Change: 1.80% Day Change: 2.16 | |
| Week Change: 1.8% Year-to-date Change: -6.6% | |
| MTRN Links: Profile News Message Board | |
| Charts:- Daily , Weekly | |
| Add MTRN to Watchlist: View: Get Complete MTRN Trend Analysis ➞ | |
 | WDFC WD-40 Company |
| Sector: Materials | |
| SubSector: Specialty Chemicals | |
| MarketCap: 2900.57 Millions | |
| Recent Price: 223.25 Smart Investing & Trading Score: 10 | |
| Day Percent Change: -1.01% Day Change: -2.27 | |
| Week Change: -1.01% Year-to-date Change: -6.6% | |
| WDFC Links: Profile News Message Board | |
| Charts:- Daily , Weekly | |
| Add WDFC to Watchlist: View: Get Complete WDFC Trend Analysis ➞ | |
 | ROCK Gibraltar Industries, Inc. |
| Sector: Materials | |
| SubSector: Steel & Iron | |
| MarketCap: 1341.08 Millions | |
| Recent Price: 73.56 Smart Investing & Trading Score: 50 | |
| Day Percent Change: 1.79% Day Change: 1.30 | |
| Week Change: 1.79% Year-to-date Change: -6.9% | |
| ROCK Links: Profile News Message Board | |
| Charts:- Daily , Weekly | |
| Add ROCK to Watchlist: View: Get Complete ROCK Trend Analysis ➞ | |
 | FUL H.B. Fuller Company |
| Sector: Materials | |
| SubSector: Specialty Chemicals | |
| MarketCap: 1655.67 Millions | |
| Recent Price: 75.25 Smart Investing & Trading Score: 25 | |
| Day Percent Change: 1.37% Day Change: 1.02 | |
| Week Change: 1.37% Year-to-date Change: -7.6% | |
| FUL Links: Profile News Message Board | |
| Charts:- Daily , Weekly | |
| Add FUL to Watchlist: View: Get Complete FUL Trend Analysis ➞ | |
 | FF FutureFuel Corp. |
| Sector: Materials | |
| SubSector: Chemicals - Major Diversified | |
| MarketCap: 450.736 Millions | |
| Recent Price: 5.62 Smart Investing & Trading Score: 40 | |
| Day Percent Change: 1.08% Day Change: 0.06 | |
| Week Change: 1.08% Year-to-date Change: -7.6% | |
| FF Links: Profile News Message Board | |
| Charts:- Daily , Weekly | |
| Add FF to Watchlist: View: Get Complete FF Trend Analysis ➞ | |
 | GRWG GrowGeneration Corp. |
| Sector: Materials | |
| SubSector: Agricultural Chemicals | |
| MarketCap: 118.429 Millions | |
| Recent Price: 2.31 Smart Investing & Trading Score: 22 | |
| Day Percent Change: 4.28% Day Change: 0.09 | |
| Week Change: 4.28% Year-to-date Change: -7.8% | |
| GRWG Links: Profile News Message Board | |
| Charts:- Daily , Weekly | |
| Add GRWG to Watchlist: View: Get Complete GRWG Trend Analysis ➞ | |
 | ORGN Origin Materials, Inc. |
| Sector: Materials | |
| SubSector: Chemicals | |
| MarketCap: 586 Millions | |
| Recent Price: 0.76 Smart Investing & Trading Score: 61 | |
| Day Percent Change: 7.46% Day Change: 0.05 | |
| Week Change: 7.46% Year-to-date Change: -10.4% | |
| ORGN Links: Profile News Message Board | |
| Charts:- Daily , Weekly | |
| Add ORGN to Watchlist: View: Get Complete ORGN Trend Analysis ➞ | |
 | KWR Quaker Chemical Corporation |
| Sector: Materials | |
| SubSector: Specialty Chemicals | |
| MarketCap: 2411.67 Millions | |
| Recent Price: 190.63 Smart Investing & Trading Score: 45 | |
| Day Percent Change: 0.21% Day Change: 0.40 | |
| Week Change: 0.21% Year-to-date Change: -10.7% | |
| KWR Links: Profile News Message Board | |
| Charts:- Daily , Weekly | |
| Add KWR to Watchlist: View: Get Complete KWR Trend Analysis ➞ | |
 | SCL Stepan Company |
| Sector: Materials | |
| SubSector: Specialty Chemicals | |
| MarketCap: 1812.97 Millions | |
| Recent Price: 84.43 Smart Investing & Trading Score: 67 | |
| Day Percent Change: 0.54% Day Change: 0.45 | |
| Week Change: 0.54% Year-to-date Change: -10.7% | |
| SCL Links: Profile News Message Board | |
| Charts:- Daily , Weekly | |
| Add SCL to Watchlist: View: Get Complete SCL Trend Analysis ➞ | |
 | LXU LSB Industries, Inc. |
| Sector: Materials | |
| SubSector: Chemicals - Major Diversified | |
| MarketCap: 51.7736 Millions | |
| Recent Price: 8.22 Smart Investing & Trading Score: 95 | |
| Day Percent Change: 0.18% Day Change: 0.01 | |
| Week Change: 0.18% Year-to-date Change: -11.7% | |
| LXU Links: Profile News Message Board | |
| Charts:- Daily , Weekly | |
| Add LXU to Watchlist: View: Get Complete LXU Trend Analysis ➞ | |
 | METCB Ramaco Resources, Inc. |
| Sector: Materials | |
| SubSector: Coking Coal | |
| MarketCap: 469 Millions | |
| Recent Price: 11.68 Smart Investing & Trading Score: 28 | |
| Day Percent Change: 1.26% Day Change: 0.15 | |
| Week Change: 1.26% Year-to-date Change: -11.9% | |
| METCB Links: Profile News Message Board | |
| Charts:- Daily , Weekly | |
| Add METCB to Watchlist: View: Get Complete METCB Trend Analysis ➞ | |
 | ASIX AdvanSix Inc. |
| Sector: Materials | |
| SubSector: Chemicals - Major Diversified | |
| MarketCap: 394.136 Millions | |
| Recent Price: 26.16 Smart Investing & Trading Score: 53 | |
| Day Percent Change: 0.56% Day Change: 0.14 | |
| Week Change: 0.56% Year-to-date Change: -12.7% | |
| ASIX Links: Profile News Message Board | |
| Charts:- Daily , Weekly | |
| Add ASIX to Watchlist: View: Get Complete ASIX Trend Analysis ➞ | |
 | CEIX CONSOL Energy Inc. |
| Sector: Materials | |
| SubSector: Industrial Metals & Minerals | |
| MarketCap: 196.81 Millions | |
| Recent Price: 87.11 Smart Investing & Trading Score: 64 | |
| Day Percent Change: 1.61% Day Change: 1.38 | |
| Week Change: 1.61% Year-to-date Change: -13.4% | |
| CEIX Links: Profile News Message Board | |
| Charts:- Daily , Weekly | |
| Add CEIX to Watchlist: View: Get Complete CEIX Trend Analysis ➞ | |
 | ACET Aceto Corporation |
| Sector: Materials | |
| SubSector: Chemicals - Major Diversified | |
| MarketCap: 453.16 Millions | |
| Recent Price: 1.63 Smart Investing & Trading Score: 50 | |
| Day Percent Change: -2.98% Day Change: -0.05 | |
| Week Change: -2.98% Year-to-date Change: -13.8% | |
| ACET Links: Profile News Message Board | |
| Charts:- Daily , Weekly | |
| Add ACET to Watchlist: View: Get Complete ACET Trend Analysis ➞ | |
| For tabular summary view of above stock list: Summary View ➞ 0 - 25 , 25 - 50 , 50 - 75 | ||
| Click To Change The Sort Order: By Market Cap or Company Size Performance: Year-to-date, Week and Day | |
| Select Chart Type: | ||
| Too many stocks? View smallcap stocks filtered by marketcap & sector |
| Marketcap: All SmallCap Stocks (default-no microcap), Large, Mid-Range, Small & MicroCap |
| Sector: Tech, Finance, Energy, Staples, Retail, Industrial, Materials, Utilities & Medical |
|
Best Stocks Today 12Stocks.com |
© 2024 12Stocks.com Terms & Conditions Privacy Contact Us
All Information Provided Only For Education And Not To Be Used For Investing or Trading. See Terms & Conditions


One More Thing ... Get Best Stocks Delivered Daily!
Never Ever Miss A Move With Our Top Ten Stocks Lists
Find Best Stocks In Any Market - Bull or Bear Market
Take A Peek At Our Top Ten Stocks Lists: Daily, Weekly, Year-to-Date & Top Trends
Find Best Stocks In Any Market - Bull or Bear Market
Take A Peek At Our Top Ten Stocks Lists: Daily, Weekly, Year-to-Date & Top Trends
Smallcap Stocks With Best Up Trends [0-bearish to 100-bullish]: Bakkt [100], Deciphera [100], Phibro Animal[100], Heartland Financial[100], Sight Sciences[100], PTC [100], TPI Composites[100], Cullinan Oncology[100], Fulton Financial[100], Xencor [100], Richardson Electronics[100]
Best Smallcap Stocks Year-to-Date:
Janux [413.54%], Bakkt [355.16%], Viking [305.7%], Alpine Immune[239.57%], Longboard [237.23%], Super Micro[213.88%], Avidity Biosciences[175.17%], Arcutis Bio[170.43%], Cullinan Oncology[169.84%], Vera [164.02%], Hippo [137.76%] Best Smallcap Stocks This Week:
Deciphera [71.95%], Phibro Animal[28.32%], Vaxxinity [20.15%], Heartland Financial[18.56%], Janux [16.28%], Acrivon [16.08%], Velo3D [14.96%], MultiPlan [14.93%], Amprius [14.37%], Codexis [13.72%], ESS Tech[13.67%] Best Smallcap Stocks Daily:
Bakkt [2439.40%], Deciphera [71.95%], Phibro Animal[28.32%], Vaxxinity [20.15%], Heartland Financial[18.56%], Janux [16.28%], Acrivon [16.08%], Velo3D [14.96%], MultiPlan [14.93%], Amprius [14.37%], Codexis [13.72%]