
 Login Sign Up


| |||||
 |  | ||||

| 12Stocks.com Market Intelligence |
Best SmallCap Stocks
|
| In a hurry? Small Cap Stock Lists: Performance Trends Table, Stock Charts
Sort Small Cap stocks: Daily, Weekly, Year-to-Date, Market Cap & Trends. Filter Small Cap stocks list by sector: Show all, Tech, Finance, Energy, Staples, Retail, Industrial, Materials, Utilities and HealthCare Filter Small Cap stocks list by size: All Large Medium Small and MicroCap |
| 12Stocks.com Small Cap Stocks Performances & Trends Daily | |||||||||
|
|  The overall Smart Investing & Trading Score is 76 (0-bearish to 100-bullish) which puts Small Cap index in short term neutral to bullish trend. The Smart Investing & Trading Score from previous trading session is 90 and hence a deterioration of trend.
| ||||||||
Here are the Smart Investing & Trading Scores of the most requested small cap stocks at 12Stocks.com (click stock name for detailed review):
|


| 12Stocks.com: Investing in Smallcap Index with Stocks | |
|
The following table helps investors and traders sort through current performance and trends (as measured by Smart Investing & Trading Score) of various
stocks in the Smallcap Index. Quick View: Move mouse or cursor over stock symbol (ticker) to view short-term technical chart and over stock name to view long term chart. Click on  to add stock symbol to your watchlist and to add stock symbol to your watchlist and  to view watchlist. Click on any ticker or stock name for detailed market intelligence report for that stock. to view watchlist. Click on any ticker or stock name for detailed market intelligence report for that stock. |
12Stocks.com Performance of Stocks in Smallcap Index
| Ticker | Stock Name | Watchlist | Category | Recent Price | Smart Investing & Trading Score | Change % | Weekly Change% |
| ALVR | AlloVir |   | Health Care | 0.78 | 59 | 3.19% | -1.29% |
| HPP | Hudson Pacific | | Financials | 5.36 | 17 | -4.63% | -1.29% |
| SBRA | Sabra Health | | Financials | 14.34 | 48 | -0.97% | -1.31% |
| FORM | FormFactor | | Technology | 55.70 | 90 | 2.13% | -1.33% |
| CENT | Central Garden | | Consumer Staples | 46.05 | 68 | 0.70% | -1.37% |
| SUM | Summit Materials | | Industrials | 40.04 | 15 | -0.22% | -1.40% |
| FCFS | FirstCash | | Financials | 117.52 | 66 | 0.24% | -1.42% |
| EAF | GrafTech | | Industrials | 1.74 | 56 | -2.25% | -1.42% |
| STRA | Strategic Education | | Services & Goods | 119.02 | 41 | -0.68% | -1.43% |
| DORM | Dorman Products | | Consumer Staples | 91.09 | 40 | -1.16% | -1.46% |
| LGND | Ligand | | Health Care | 85.95 | 83 | 1.09% | -1.52% |
| COKE | Coca-Cola Consolidated | | Consumer Staples | 937.50 | 68 | 0.54% | -1.53% |
| FSS | Federal Signal | | Industrials | 86.37 | 71 | 0.00% | -1.53% |
| RELY | Remitly Global | | Technology | 14.11 | 71 | -0.63% | -1.54% |
| ATSG | Air Transport | | Transports | 14.62 | 76 | -0.14% | -1.55% |
| APLE | Apple Hospitality | | Financials | 14.61 | 30 | -0.75% | -1.55% |
| ALX | Alexander s | | Financials | 219.67 | 65 | 0.70% | -1.56% |
| ACA | Arcosa | | Industrials | 86.57 | 68 | -0.29% | -1.60% |
| PSN | Parsons | | Industrials | 76.51 | 18 | -0.05% | -1.61% |
| STEP | StepStone Group | | Financials | 37.34 | 53 | -0.27% | -1.66% |
| SAGE | Sage | | Health Care | 11.70 | 28 | -2.58% | -1.68% |
| SMPL | Simply Good | | Consumer Staples | 37.50 | 68 | 0.00% | -1.69% |
| BPMC | Blueprint Medicines | | Health Care | 104.90 | 68 | -1.63% | -1.69% |
| NGVT | Ingevity | | Materials | 53.55 | 68 | -2.72% | -1.71% |
| CARG | CarGurus | | Services & Goods | 23.79 | 63 | -0.04% | -1.76% |
| For chart view version of above stock list: Chart View ➞ 0 - 25 , 25 - 50 , 50 - 75 , 75 - 100 , 100 - 125 , 125 - 150 , 150 - 175 , 175 - 200 , 200 - 225 , 225 - 250 , 250 - 275 , 275 - 300 , 300 - 325 , 325 - 350 , 350 - 375 , 375 - 400 , 400 - 425 , 425 - 450 , 450 - 475 , 475 - 500 , 500 - 525 , 525 - 550 , 550 - 575 , 575 - 600 , 600 - 625 , 625 - 650 , 650 - 675 , 675 - 700 | ||
 | Click To Change The Sort Order: By Market Cap or Company Size Performance: Year-to-date, Week and Day |  |
| Too many stocks? View smallcap stocks filtered by marketcap & sector |
| Marketcap: All SmallCap Stocks (default-no microcap), Large, Mid-Range, Small |
| Smallcap Sector: Tech, Finance, Energy, Staples, Retail, Industrial, Materials, & Medical |
|
Get the most comprehensive stock market coverage daily at 12Stocks.com ➞ Best Stocks Today ➞ Best Stocks Weekly ➞ Best Stocks Year-to-Date ➞ Best Stocks Trends ➞  Best Stocks Today 12Stocks.com Best Nasdaq Stocks ➞ Best S&P 500 Stocks ➞ Best Tech Stocks ➞ Best Biotech Stocks ➞ |
| Detailed Overview of SmallCap Stocks |
| SmallCap Technical Overview, Leaders & Laggards, Top SmallCap ETF Funds & Detailed SmallCap Stocks List, Charts, Trends & More |
| Smallcap: Technical Analysis, Trends & YTD Performance | |
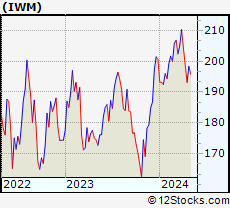
| SmallCap segment as represented by
IWM, an exchange-traded fund [ETF], holds basket of thousands of smallcap stocks from across all major sectors of the US stock market. The smallcap index (contains stocks like Riverbed & Sotheby's) is up by 3.67% and is currently underperforming the overall market by -6.9% year-to-date. Below is a quick view of technical charts and trends: | |
 IWM Weekly Chart |
|
| Long Term Trend: Very Good | |
| Medium Term Trend: Very Good | |
 IWM Daily Chart |
|
| Short Term Trend: Good | |
| Overall Trend Score: 76 | |
| YTD Performance: 3.67% | |
| **Trend Scores & Views Are Only For Educational Purposes And Not For Investing | |
| 12Stocks.com: Top Performing Small Cap Index Stocks | ||||||||||||||||||||||||||||||||||||||||||||||||
 The top performing Small Cap Index stocks year to date are
Now, more recently, over last week, the top performing Small Cap Index stocks on the move are


|
||||||||||||||||||||||||||||||||||||||||||||||||
| 12Stocks.com: Investing in Smallcap Index using Exchange Traded Funds | |
|
The following table shows list of key exchange traded funds (ETF) that
help investors track Smallcap index. The following list also includes leveraged ETF funds that track twice or thrice the daily returns of Smallcap indices. Short or inverse ETF funds move in the opposite direction to the index they track and are useful during market pullbacks or during bear markets. Quick View: Move mouse or cursor over ETF symbol (ticker) to view short-term technical chart and over ETF name to view long term chart. Click on ticker or stock name for detailed view. Click on to add stock symbol to your watchlist and to view watchlist. |
12Stocks.com List of ETFs that track Smallcap Index
| Ticker | ETF Name | Watchlist | Recent Price | Smart Investing & Trading Score | Change % | Week % | Year-to-date % |
| IWM | iShares Russell 2000 | | 208.08 | 76 | 0.07 | 1.85 | 3.67% |
| VTWO | Vanguard Russell 2000 ETF | | 83.99 | 78 | -0.14 | 1.65 | 3.56% |
| IJR | iShares Core S&P Small-Cap | | 110.44 | 76 | -0.17 | 1.34 | 2.03% |
| IWN | iShares Russell 2000 Value | | 158.65 | 76 | -0.11 | 1.57 | 2.13% |
| IJS | iShares S&P Small-Cap 600 Value | | 101.83 | 76 | -0.19 | 1.3 | -1.2% |
| IWO | iShares Russell 2000 Growth | | 265.60 | 70 | -0.58 | 2.19 | 5.3% |
| IJT | iShares S&P Small-Cap 600 Growth | | 131.17 | 71 | -0.09 | 1.01 | 4.82% |
| XSLV | PowerShares S&P SmallCap Low Volatil ETF | | 44.48 | 83 | 0.00 | 0.56 | 0.74% |
| SAA | ProShares Ultra SmallCap600 | | 25.01 | 71 | 0.93 | 2.71 | 0.24% |
| SMLV | SPDR SSGA US Small Cap Low Volatil ETF | | 113.28 | 90 | 0.43 | 1.85 | 0.68% |
| SDD | ProShares UltraShort SmallCap600 | | 17.84 | 27 | 0.96 | -2.41 | -3.18% |
| SBB | ProShares Short SmallCap600 | | 15.71 | 18 | 0.01 | -1.52 | -1.37% |
| 12Stocks.com: Charts, Trends, Fundamental Data and Performances of SmallCap Stocks | |
|
We now take in-depth look at all SmallCap stocks including charts, multi-period performances and overall trends (as measured by Smart Investing & Trading Score). One can sort SmallCap stocks (click link to choose) by Daily, Weekly and by Year-to-Date performances. Also, one can sort by size of the company or by market capitalization. |
| Select Your Default Chart Type: | |||||
| |||||
| Click on stock symbol or name for detailed view. Click on to add stock symbol to your watchlist and to view watchlist. Quick View: Move mouse or cursor over "Daily" to quickly view daily technical stock chart and over "Weekly" to view weekly technical stock chart. | |||||

 | ALVR AlloVir, Inc. |
| Sector: Health Care | |
| SubSector: Biotechnology | |
| MarketCap: 25787 Millions | |
| Recent Price: 0.78 Smart Investing & Trading Score: 59 | |
| Day Percent Change: 3.19% Day Change: 0.02 | |
| Week Change: -1.29% Year-to-date Change: 14.1% | |
| ALVR Links: Profile News Message Board | |
| Charts:- Daily , Weekly | |
| Add ALVR to Watchlist: View: Get Complete ALVR Trend Analysis ➞ | |
 | HPP Hudson Pacific Properties, Inc. |
| Sector: Financials | |
| SubSector: REIT - Office | |
| MarketCap: 3267.16 Millions | |
| Recent Price: 5.36 Smart Investing & Trading Score: 17 | |
| Day Percent Change: -4.63% Day Change: -0.26 | |
| Week Change: -1.29% Year-to-date Change: -42.4% | |
| HPP Links: Profile News Message Board | |
| Charts:- Daily , Weekly | |
| Add HPP to Watchlist: View: Get Complete HPP Trend Analysis ➞ | |
 | SBRA Sabra Health Care REIT, Inc. |
| Sector: Financials | |
| SubSector: REIT - Healthcare Facilities | |
| MarketCap: 2576.54 Millions | |
| Recent Price: 14.34 Smart Investing & Trading Score: 48 | |
| Day Percent Change: -0.97% Day Change: -0.14 | |
| Week Change: -1.31% Year-to-date Change: 0.5% | |
| SBRA Links: Profile News Message Board | |
| Charts:- Daily , Weekly | |
| Add SBRA to Watchlist: View: Get Complete SBRA Trend Analysis ➞ | |
 | FORM FormFactor, Inc. |
| Sector: Technology | |
| SubSector: Semiconductor - Broad Line | |
| MarketCap: 1426.42 Millions | |
| Recent Price: 55.70 Smart Investing & Trading Score: 90 | |
| Day Percent Change: 2.13% Day Change: 1.16 | |
| Week Change: -1.33% Year-to-date Change: 33.5% | |
| FORM Links: Profile News Message Board | |
| Charts:- Daily , Weekly | |
| Add FORM to Watchlist: View: Get Complete FORM Trend Analysis ➞ | |
 | CENT Central Garden & Pet Company |
| Sector: Consumer Staples | |
| SubSector: Food - Major Diversified | |
| MarketCap: 1396.43 Millions | |
| Recent Price: 46.05 Smart Investing & Trading Score: 68 | |
| Day Percent Change: 0.70% Day Change: 0.32 | |
| Week Change: -1.37% Year-to-date Change: -8.1% | |
| CENT Links: Profile News Message Board | |
| Charts:- Daily , Weekly | |
| Add CENT to Watchlist: View: Get Complete CENT Trend Analysis ➞ | |
 | SUM Summit Materials, Inc. |
| Sector: Industrials | |
| SubSector: General Building Materials | |
| MarketCap: 1138.23 Millions | |
| Recent Price: 40.04 Smart Investing & Trading Score: 15 | |
| Day Percent Change: -0.22% Day Change: -0.09 | |
| Week Change: -1.4% Year-to-date Change: 4.1% | |
| SUM Links: Profile News Message Board | |
| Charts:- Daily , Weekly | |
| Add SUM to Watchlist: View: Get Complete SUM Trend Analysis ➞ | |
 | FCFS FirstCash, Inc. |
| Sector: Financials | |
| SubSector: Credit Services | |
| MarketCap: 2795.48 Millions | |
| Recent Price: 117.52 Smart Investing & Trading Score: 66 | |
| Day Percent Change: 0.24% Day Change: 0.28 | |
| Week Change: -1.42% Year-to-date Change: 8.4% | |
| FCFS Links: Profile News Message Board | |
| Charts:- Daily , Weekly | |
| Add FCFS to Watchlist: View: Get Complete FCFS Trend Analysis ➞ | |
 | EAF GrafTech International Ltd. |
| Sector: Industrials | |
| SubSector: Diversified Machinery | |
| MarketCap: 2084.36 Millions | |
| Recent Price: 1.74 Smart Investing & Trading Score: 56 | |
| Day Percent Change: -2.25% Day Change: -0.04 | |
| Week Change: -1.42% Year-to-date Change: -20.6% | |
| EAF Links: Profile News Message Board | |
| Charts:- Daily , Weekly | |
| Add EAF to Watchlist: View: Get Complete EAF Trend Analysis ➞ | |
 | STRA Strategic Education, Inc. |
| Sector: Services & Goods | |
| SubSector: Education & Training Services | |
| MarketCap: 2621.56 Millions | |
| Recent Price: 119.02 Smart Investing & Trading Score: 41 | |
| Day Percent Change: -0.68% Day Change: -0.82 | |
| Week Change: -1.43% Year-to-date Change: 28.9% | |
| STRA Links: Profile News Message Board | |
| Charts:- Daily , Weekly | |
| Add STRA to Watchlist: View: Get Complete STRA Trend Analysis ➞ | |
 | DORM Dorman Products, Inc. |
| Sector: Consumer Staples | |
| SubSector: Auto Parts | |
| MarketCap: 2028.79 Millions | |
| Recent Price: 91.09 Smart Investing & Trading Score: 40 | |
| Day Percent Change: -1.16% Day Change: -1.07 | |
| Week Change: -1.46% Year-to-date Change: 9.2% | |
| DORM Links: Profile News Message Board | |
| Charts:- Daily , Weekly | |
| Add DORM to Watchlist: View: Get Complete DORM Trend Analysis ➞ | |
 | LGND Ligand Pharmaceuticals Incorporated |
| Sector: Health Care | |
| SubSector: Biotechnology | |
| MarketCap: 1344.45 Millions | |
| Recent Price: 85.95 Smart Investing & Trading Score: 83 | |
| Day Percent Change: 1.09% Day Change: 0.93 | |
| Week Change: -1.52% Year-to-date Change: 20.3% | |
| LGND Links: Profile News Message Board | |
| Charts:- Daily , Weekly | |
| Add LGND to Watchlist: View: Get Complete LGND Trend Analysis ➞ | |
 | COKE Coca-Cola Consolidated, Inc. |
| Sector: Consumer Staples | |
| SubSector: Beverages - Soft Drinks | |
| MarketCap: 1392.2 Millions | |
| Recent Price: 937.50 Smart Investing & Trading Score: 68 | |
| Day Percent Change: 0.54% Day Change: 5.08 | |
| Week Change: -1.53% Year-to-date Change: 1.0% | |
| COKE Links: Profile News Message Board | |
| Charts:- Daily , Weekly | |
| Add COKE to Watchlist: View: Get Complete COKE Trend Analysis ➞ | |
 | FSS Federal Signal Corporation |
| Sector: Industrials | |
| SubSector: Pollution & Treatment Controls | |
| MarketCap: 1694.05 Millions | |
| Recent Price: 86.37 Smart Investing & Trading Score: 71 | |
| Day Percent Change: 0.00% Day Change: 0.00 | |
| Week Change: -1.53% Year-to-date Change: 12.6% | |
| FSS Links: Profile News Message Board | |
| Charts:- Daily , Weekly | |
| Add FSS to Watchlist: View: Get Complete FSS Trend Analysis ➞ | |
 | RELY Remitly Global, Inc. |
| Sector: Technology | |
| SubSector: Software - Infrastructure | |
| MarketCap: 3320 Millions | |
| Recent Price: 14.11 Smart Investing & Trading Score: 71 | |
| Day Percent Change: -0.63% Day Change: -0.09 | |
| Week Change: -1.54% Year-to-date Change: -27.3% | |
| RELY Links: Profile News Message Board | |
| Charts:- Daily , Weekly | |
| Add RELY to Watchlist: View: Get Complete RELY Trend Analysis ➞ | |
 | ATSG Air Transport Services Group, Inc. |
| Sector: Transports | |
| SubSector: Air Delivery & Freight Services | |
| MarketCap: 1111.68 Millions | |
| Recent Price: 14.62 Smart Investing & Trading Score: 76 | |
| Day Percent Change: -0.14% Day Change: -0.02 | |
| Week Change: -1.55% Year-to-date Change: -17.0% | |
| ATSG Links: Profile News Message Board | |
| Charts:- Daily , Weekly | |
| Add ATSG to Watchlist: View: Get Complete ATSG Trend Analysis ➞ | |
 | APLE Apple Hospitality REIT, Inc. |
| Sector: Financials | |
| SubSector: REIT - Hotel/Motel | |
| MarketCap: 1515.74 Millions | |
| Recent Price: 14.61 Smart Investing & Trading Score: 30 | |
| Day Percent Change: -0.75% Day Change: -0.11 | |
| Week Change: -1.55% Year-to-date Change: -12.0% | |
| APLE Links: Profile News Message Board | |
| Charts:- Daily , Weekly | |
| Add APLE to Watchlist: View: Get Complete APLE Trend Analysis ➞ | |
 | ALX Alexander s, Inc. |
| Sector: Financials | |
| SubSector: REIT - Retail | |
| MarketCap: 1251.54 Millions | |
| Recent Price: 219.67 Smart Investing & Trading Score: 65 | |
| Day Percent Change: 0.70% Day Change: 1.53 | |
| Week Change: -1.56% Year-to-date Change: 2.9% | |
| ALX Links: Profile News Message Board | |
| Charts:- Daily , Weekly | |
| Add ALX to Watchlist: View: Get Complete ALX Trend Analysis ➞ | |
 | ACA Arcosa, Inc. |
| Sector: Industrials | |
| SubSector: Farm & Construction Machinery | |
| MarketCap: 1692.57 Millions | |
| Recent Price: 86.57 Smart Investing & Trading Score: 68 | |
| Day Percent Change: -0.29% Day Change: -0.25 | |
| Week Change: -1.6% Year-to-date Change: 4.8% | |
| ACA Links: Profile News Message Board | |
| Charts:- Daily , Weekly | |
| Add ACA to Watchlist: View: Get Complete ACA Trend Analysis ➞ | |
 | PSN Parsons Corporation |
| Sector: Industrials | |
| SubSector: Diversified Machinery | |
| MarketCap: 3021.16 Millions | |
| Recent Price: 76.51 Smart Investing & Trading Score: 18 | |
| Day Percent Change: -0.05% Day Change: -0.04 | |
| Week Change: -1.61% Year-to-date Change: 22.0% | |
| PSN Links: Profile News Message Board | |
| Charts:- Daily , Weekly | |
| Add PSN to Watchlist: View: Get Complete PSN Trend Analysis ➞ | |
 | STEP StepStone Group Inc. |
| Sector: Financials | |
| SubSector: Asset Management | |
| MarketCap: 30757 Millions | |
| Recent Price: 37.34 Smart Investing & Trading Score: 53 | |
| Day Percent Change: -0.27% Day Change: -0.10 | |
| Week Change: -1.66% Year-to-date Change: 17.3% | |
| STEP Links: Profile News Message Board | |
| Charts:- Daily , Weekly | |
| Add STEP to Watchlist: View: Get Complete STEP Trend Analysis ➞ | |
 | SAGE Sage Therapeutics, Inc. |
| Sector: Health Care | |
| SubSector: Biotechnology | |
| MarketCap: 1683.75 Millions | |
| Recent Price: 11.70 Smart Investing & Trading Score: 28 | |
| Day Percent Change: -2.58% Day Change: -0.31 | |
| Week Change: -1.68% Year-to-date Change: -46.0% | |
| SAGE Links: Profile News Message Board | |
| Charts:- Daily , Weekly | |
| Add SAGE to Watchlist: View: Get Complete SAGE Trend Analysis ➞ | |
 | SMPL The Simply Good Foods Company |
| Sector: Consumer Staples | |
| SubSector: Food - Major Diversified | |
| MarketCap: 1501.63 Millions | |
| Recent Price: 37.50 Smart Investing & Trading Score: 68 | |
| Day Percent Change: 0.00% Day Change: 0.00 | |
| Week Change: -1.69% Year-to-date Change: -5.3% | |
| SMPL Links: Profile News Message Board | |
| Charts:- Daily , Weekly | |
| Add SMPL to Watchlist: View: Get Complete SMPL Trend Analysis ➞ | |
 | BPMC Blueprint Medicines Corporation |
| Sector: Health Care | |
| SubSector: Biotechnology | |
| MarketCap: 3113.55 Millions | |
| Recent Price: 104.90 Smart Investing & Trading Score: 68 | |
| Day Percent Change: -1.63% Day Change: -1.74 | |
| Week Change: -1.69% Year-to-date Change: 13.7% | |
| BPMC Links: Profile News Message Board | |
| Charts:- Daily , Weekly | |
| Add BPMC to Watchlist: View: Get Complete BPMC Trend Analysis ➞ | |
 | NGVT Ingevity Corporation |
| Sector: Materials | |
| SubSector: Specialty Chemicals | |
| MarketCap: 1325.47 Millions | |
| Recent Price: 53.55 Smart Investing & Trading Score: 68 | |
| Day Percent Change: -2.72% Day Change: -1.50 | |
| Week Change: -1.71% Year-to-date Change: 13.4% | |
| NGVT Links: Profile News Message Board | |
| Charts:- Daily , Weekly | |
| Add NGVT to Watchlist: View: Get Complete NGVT Trend Analysis ➞ | |
 | CARG CarGurus, Inc. |
| Sector: Services & Goods | |
| SubSector: Auto Dealerships | |
| MarketCap: 2099.31 Millions | |
| Recent Price: 23.79 Smart Investing & Trading Score: 63 | |
| Day Percent Change: -0.04% Day Change: -0.01 | |
| Week Change: -1.76% Year-to-date Change: -1.5% | |
| CARG Links: Profile News Message Board | |
| Charts:- Daily , Weekly | |
| Add CARG to Watchlist: View: Get Complete CARG Trend Analysis ➞ | |
| For tabular summary view of above stock list: Summary View ➞ 0 - 25 , 25 - 50 , 50 - 75 , 75 - 100 , 100 - 125 , 125 - 150 , 150 - 175 , 175 - 200 , 200 - 225 , 225 - 250 , 250 - 275 , 275 - 300 , 300 - 325 , 325 - 350 , 350 - 375 , 375 - 400 , 400 - 425 , 425 - 450 , 450 - 475 , 475 - 500 , 500 - 525 , 525 - 550 , 550 - 575 , 575 - 600 , 600 - 625 , 625 - 650 , 650 - 675 , 675 - 700 | ||
| Click To Change The Sort Order: By Market Cap or Company Size Performance: Year-to-date, Week and Day | |
| Select Chart Type: | ||
| Too many stocks? View smallcap stocks filtered by marketcap & sector |
| Marketcap: All SmallCap Stocks (default-no microcap), Large, Mid-Range, Small & MicroCap |
| Sector: Tech, Finance, Energy, Staples, Retail, Industrial, Materials, Utilities & Medical |
|
Best Stocks Today 12Stocks.com |
© 2024 12Stocks.com Terms & Conditions Privacy Contact Us
All Information Provided Only For Education And Not To Be Used For Investing or Trading. See Terms & Conditions


One More Thing ... Get Best Stocks Delivered Daily!
Never Ever Miss A Move With Our Top Ten Stocks Lists
Find Best Stocks In Any Market - Bull or Bear Market
Take A Peek At Our Top Ten Stocks Lists: Daily, Weekly, Year-to-Date & Top Trends
Find Best Stocks In Any Market - Bull or Bear Market
Take A Peek At Our Top Ten Stocks Lists: Daily, Weekly, Year-to-Date & Top Trends
Smallcap Stocks With Best Up Trends [0-bearish to 100-bullish]: CommScope Holding[100], Coeur Mining[100], Hecla Mining[100], MicroStrategy [100], Rayonier Advanced[100], Energy Fuels[100], NovaGold Resources[100], Piedmont Lithium[100], LSB Industries[100], Fossil Group[100], Gannett Co[100]
Best Smallcap Stocks Year-to-Date:
CareMax [502.06%], Bakkt [413.9%], Janux [339.65%], Viking [266.74%], Alpine Immune[241.31%], Longboard [238.63%], Avidity Biosciences[226.44%], Super Micro[212.65%], Arcutis Bio[184.52%], Sweetgreen [180.97%], Novavax [170.73%] Best Smallcap Stocks This Week:
Novavax [46.34%], Vicarious Surgical[45.62%], Harrow Health[44.83%], ProKidney [44.13%], Maxeon Solar[36.18%], Workhorse Group[36.06%], Fossil Group[34.93%], Humacyte [34.68%], MicroStrategy [34.18%], Cadiz [32.62%], MacroGenics [31.87%] Best Smallcap Stocks Daily:
Presto Automation[30.67%], Vicarious Surgical[27.93%], Orchestra BioMed[14.07%], CommScope Holding[12.29%], Coeur Mining[11.57%], Hecla Mining[11.11%], MicroStrategy [10.00%], Tenaya [9.53%], Enovix [9.30%], Bakkt [9.25%], Sharecare [9.12%]