
 Login Sign Up


| |||||
 |  | ||||

| 12Stocks.com Market Intelligence |
Best SmallCap Stocks
|
| In a hurry? Small Cap Stock Lists: Performance Trends Table, Stock Charts
Sort Small Cap stocks: Daily, Weekly, Year-to-Date, Market Cap & Trends. Filter Small Cap stocks list by sector: Show all, Tech, Finance, Energy, Staples, Retail, Industrial, Materials, Utilities and HealthCare Filter Small Cap stocks list by size: All Large Medium Small and MicroCap |
| 12Stocks.com Small Cap Stocks Performances & Trends Daily | |||||||||
|
|  The overall Smart Investing & Trading Score is 82 (0-bearish to 100-bullish) which puts Small Cap index in short term bullish trend. The Smart Investing & Trading Score from previous trading session is 69 and hence an improvement of trend.
| ||||||||
Here are the Smart Investing & Trading Scores of the most requested small cap stocks at 12Stocks.com (click stock name for detailed review):
|


| 12Stocks.com: Investing in Smallcap Index with Stocks | |
|
The following table helps investors and traders sort through current performance and trends (as measured by Smart Investing & Trading Score) of various
stocks in the Smallcap Index. Quick View: Move mouse or cursor over stock symbol (ticker) to view short-term technical chart and over stock name to view long term chart. Click on  to add stock symbol to your watchlist and to add stock symbol to your watchlist and  to view watchlist. Click on any ticker or stock name for detailed market intelligence report for that stock. to view watchlist. Click on any ticker or stock name for detailed market intelligence report for that stock. |
12Stocks.com Performance of Stocks in Smallcap Index
| Ticker | Stock Name | Watchlist | Category | Recent Price | Smart Investing & Trading Score | Change % | Weekly Change% |
| INMD | InMode |   | Health Care | 18.66 | 74 | 5.78% | 5.78% |
| BTMD | biote | | Health Care | 6.06 | 100 | 5.67% | 5.67% |
| OSCR | Oscar Health | | Health Care | 18.95 | 95 | 5.39% | 5.39% |
| LFST | LifeStance Health | | Health Care | 6.92 | 69 | 5.33% | 5.33% |
| ITOS | iTeos | | Health Care | 12.23 | 100 | 5.02% | 5.02% |
| ARDX | Ardelyx | | Health Care | 9.15 | 74 | 4.99% | 4.99% |
| SVRA | Savara | | Health Care | 4.94 | 42 | 4.99% | 4.99% |
| DH | Definitive Healthcare | | Health Care | 7.36 | 62 | 4.99% | 4.99% |
| PROK | ProKidney | | Health Care | 2.24 | 88 | 4.92% | 4.92% |
| KOD | Kodiak Sciences | | Health Care | 3.96 | 69 | 4.91% | 4.91% |
| MGNX | MacroGenics | | Health Care | 16.43 | 24 | 4.82% | 4.82% |
| OBIO | Orchestra BioMed | | Health Care | 5.18 | 74 | 4.65% | 4.65% |
| ALHC | Alignment Healthcare | | Health Care | 6.79 | 100 | 4.54% | 4.54% |
| MLYS | Mineralys | | Health Care | 13.74 | 74 | 4.45% | 4.45% |
| SGRY | Surgery Partners | | Health Care | 25.62 | 64 | 4.44% | 4.44% |
| LXRX | Lexicon | | Health Care | 1.81 | 57 | 4.31% | 4.31% |
| ZURA | Zura Bio | | Health Care | 4.70 | 95 | 4.21% | 4.21% |
| ALXO | ALX Oncology | | Health Care | 16.00 | 63 | 4.17% | 4.17% |
| TNGX | Tango | | Health Care | 7.89 | 59 | 4.16% | 4.16% |
| CARA | Cara | | Health Care | 0.81 | 69 | 4.09% | 4.09% |
| IRTC | iRhythm | | Health Care | 106.78 | 0 | 3.99% | 3.99% |
| ETNB | 89bio | | Health Care | 9.59 | 64 | 3.96% | 3.96% |
| PETS | PetMed Express | | Health Care | 4.21 | 52 | 3.95% | 3.95% |
| FATE | Fate | | Health Care | 4.22 | 23 | 3.94% | 3.94% |
| XFOR | X4 | | Health Care | 1.20 | 63 | 3.91% | 3.91% |
| For chart view version of above stock list: Chart View ➞ 0 - 25 , 25 - 50 , 50 - 75 , 75 - 100 , 100 - 125 , 125 - 150 , 150 - 175 , 175 - 200 , 200 - 225 , 225 - 250 , 250 - 275 , 275 - 300 , 300 - 325 , 325 - 350 | ||
 | Click To Change The Sort Order: By Market Cap or Company Size Performance: Year-to-date, Week and Day |  |
| Too many stocks? View smallcap stocks filtered by marketcap & sector |
| Marketcap: All SmallCap Stocks (default-no microcap), Large, Mid-Range, Small |
| Smallcap Sector: Tech, Finance, Energy, Staples, Retail, Industrial, Materials, & Medical |
|
Get the most comprehensive stock market coverage daily at 12Stocks.com ➞ Best Stocks Today ➞ Best Stocks Weekly ➞ Best Stocks Year-to-Date ➞ Best Stocks Trends ➞  Best Stocks Today 12Stocks.com Best Nasdaq Stocks ➞ Best S&P 500 Stocks ➞ Best Tech Stocks ➞ Best Biotech Stocks ➞ |
| Detailed Overview of SmallCap Stocks |
| SmallCap Technical Overview, Leaders & Laggards, Top SmallCap ETF Funds & Detailed SmallCap Stocks List, Charts, Trends & More |
| Smallcap: Technical Analysis, Trends & YTD Performance | |
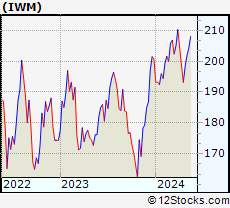
| SmallCap segment as represented by
IWM, an exchange-traded fund [ETF], holds basket of thousands of smallcap stocks from across all major sectors of the US stock market. The smallcap index (contains stocks like Riverbed & Sotheby's) is up by 1.89% and is currently underperforming the overall market by -6.13% year-to-date. Below is a quick view of technical charts and trends: | |
 IWM Weekly Chart |
|
| Long Term Trend: Very Good | |
| Medium Term Trend: Very Good | |
 IWM Daily Chart |
|
| Short Term Trend: Very Good | |
| Overall Trend Score: 82 | |
| YTD Performance: 1.89% | |
| **Trend Scores & Views Are Only For Educational Purposes And Not For Investing | |
| 12Stocks.com: Top Performing Small Cap Index Stocks | ||||||||||||||||||||||||||||||||||||||||||||||||
 The top performing Small Cap Index stocks year to date are
Now, more recently, over last week, the top performing Small Cap Index stocks on the move are


|
||||||||||||||||||||||||||||||||||||||||||||||||
| 12Stocks.com: Investing in Smallcap Index using Exchange Traded Funds | |
|
The following table shows list of key exchange traded funds (ETF) that
help investors track Smallcap index. The following list also includes leveraged ETF funds that track twice or thrice the daily returns of Smallcap indices. Short or inverse ETF funds move in the opposite direction to the index they track and are useful during market pullbacks or during bear markets. Quick View: Move mouse or cursor over ETF symbol (ticker) to view short-term technical chart and over ETF name to view long term chart. Click on ticker or stock name for detailed view. Click on to add stock symbol to your watchlist and to view watchlist. |
12Stocks.com List of ETFs that track Smallcap Index
| Ticker | ETF Name | Watchlist | Recent Price | Smart Investing & Trading Score | Change % | Week % | Year-to-date % |
| IWM | iShares Russell 2000 | | 204.51 | 82 | 1.29 | 1.29 | 1.89% |
| IJR | iShares Core S&P Small-Cap | | 108.26 | 47 | 1.05 | 1.05 | 0.01% |
| VTWO | Vanguard Russell 2000 ETF | | 82.59 | 82 | 1.20 | 1.2 | 1.84% |
| IWN | iShares Russell 2000 Value | | 155.65 | 65 | 0.93 | 0.93 | 0.21% |
| IWO | iShares Russell 2000 Growth | | 261.01 | 29 | 1.61 | 1.61 | 3.49% |
| IJS | iShares S&P Small-Cap 600 Value | | 99.75 | 69 | 1.04 | 1.04 | -3.22% |
| IJT | iShares S&P Small-Cap 600 Growth | | 129.04 | 95 | 1.00 | 1 | 3.12% |
| XSLV | PowerShares S&P SmallCap Low Volatil ETF | | 43.52 | 87 | 0.69 | 0.69 | -1.43% |
| SAA | ProShares Ultra SmallCap600 | | 24.10 | 82 | 2.16 | 2.16 | -3.41% |
| SDD | ProShares UltraShort SmallCap600 | | 18.42 | 10 | -2.26 | -2.26 | -0.04% |
| SBB | ProShares Short SmallCap600 | | 16.05 | 13 | -0.67 | -0.67 | 0.76% |
| SMLV | SPDR SSGA US Small Cap Low Volatil ETF | | 110.59 | 87 | 0.83 | 0.83 | -1.72% |
| 12Stocks.com: Charts, Trends, Fundamental Data and Performances of SmallCap Stocks | |
|
We now take in-depth look at all SmallCap stocks including charts, multi-period performances and overall trends (as measured by Smart Investing & Trading Score). One can sort SmallCap stocks (click link to choose) by Daily, Weekly and by Year-to-Date performances. Also, one can sort by size of the company or by market capitalization. |
| Select Your Default Chart Type: | |||||
| |||||
| Click on stock symbol or name for detailed view. Click on to add stock symbol to your watchlist and to view watchlist. Quick View: Move mouse or cursor over "Daily" to quickly view daily technical stock chart and over "Weekly" to view weekly technical stock chart. | |||||

 | INMD InMode Ltd. |
| Sector: Health Care | |
| SubSector: Medical Appliances & Equipment | |
| MarketCap: 689.08 Millions | |
| Recent Price: 18.66 Smart Investing & Trading Score: 74 | |
| Day Percent Change: 5.78% Day Change: 1.02 | |
| Week Change: 5.78% Year-to-date Change: -16.1% | |
| INMD Links: Profile News Message Board | |
| Charts:- Daily , Weekly | |
| Add INMD to Watchlist: View: Get Complete INMD Trend Analysis ➞ | |
 | BTMD biote Corp. |
| Sector: Health Care | |
| SubSector: Medical Care Facilities | |
| MarketCap: 468 Millions | |
| Recent Price: 6.06 Smart Investing & Trading Score: 100 | |
| Day Percent Change: 5.67% Day Change: 0.32 | |
| Week Change: 5.67% Year-to-date Change: 22.2% | |
| BTMD Links: Profile News Message Board | |
| Charts:- Daily , Weekly | |
| Add BTMD to Watchlist: View: Get Complete BTMD Trend Analysis ➞ | |
 | OSCR Oscar Health, Inc. |
| Sector: Health Care | |
| SubSector: Healthcare Plans | |
| MarketCap: 1790 Millions | |
| Recent Price: 18.95 Smart Investing & Trading Score: 95 | |
| Day Percent Change: 5.39% Day Change: 0.97 | |
| Week Change: 5.39% Year-to-date Change: 108.1% | |
| OSCR Links: Profile News Message Board | |
| Charts:- Daily , Weekly | |
| Add OSCR to Watchlist: View: Get Complete OSCR Trend Analysis ➞ | |
 | LFST LifeStance Health Group, Inc. |
| Sector: Health Care | |
| SubSector: Medical Care Facilities | |
| MarketCap: 3460 Millions | |
| Recent Price: 6.92 Smart Investing & Trading Score: 69 | |
| Day Percent Change: 5.33% Day Change: 0.35 | |
| Week Change: 5.33% Year-to-date Change: -12.6% | |
| LFST Links: Profile News Message Board | |
| Charts:- Daily , Weekly | |
| Add LFST to Watchlist: View: Get Complete LFST Trend Analysis ➞ | |
 | ITOS iTeos Therapeutics, Inc. |
| Sector: Health Care | |
| SubSector: Biotechnology | |
| MarketCap: 10487 Millions | |
| Recent Price: 12.23 Smart Investing & Trading Score: 100 | |
| Day Percent Change: 5.02% Day Change: 0.59 | |
| Week Change: 5.02% Year-to-date Change: 11.8% | |
| ITOS Links: Profile News Message Board | |
| Charts:- Daily , Weekly | |
| Add ITOS to Watchlist: View: Get Complete ITOS Trend Analysis ➞ | |
 | ARDX Ardelyx, Inc. |
| Sector: Health Care | |
| SubSector: Biotechnology | |
| MarketCap: 541.985 Millions | |
| Recent Price: 9.15 Smart Investing & Trading Score: 74 | |
| Day Percent Change: 4.99% Day Change: 0.43 | |
| Week Change: 4.99% Year-to-date Change: 47.7% | |
| ARDX Links: Profile News Message Board | |
| Charts:- Daily , Weekly | |
| Add ARDX to Watchlist: View: Get Complete ARDX Trend Analysis ➞ | |
 | SVRA Savara Inc. |
| Sector: Health Care | |
| SubSector: Biotechnology | |
| MarketCap: 80.3785 Millions | |
| Recent Price: 4.94 Smart Investing & Trading Score: 42 | |
| Day Percent Change: 4.99% Day Change: 0.24 | |
| Week Change: 4.99% Year-to-date Change: 5.1% | |
| SVRA Links: Profile News Message Board | |
| Charts:- Daily , Weekly | |
| Add SVRA to Watchlist: View: Get Complete SVRA Trend Analysis ➞ | |
 | DH Definitive Healthcare Corp. |
| Sector: Health Care | |
| SubSector: Health Information Services | |
| MarketCap: 1690 Millions | |
| Recent Price: 7.36 Smart Investing & Trading Score: 62 | |
| Day Percent Change: 4.99% Day Change: 0.35 | |
| Week Change: 4.99% Year-to-date Change: -26.9% | |
| DH Links: Profile News Message Board | |
| Charts:- Daily , Weekly | |
| Add DH to Watchlist: View: Get Complete DH Trend Analysis ➞ | |
 | PROK ProKidney Corp. |
| Sector: Health Care | |
| SubSector: Biotechnology | |
| MarketCap: 2470 Millions | |
| Recent Price: 2.24 Smart Investing & Trading Score: 88 | |
| Day Percent Change: 4.92% Day Change: 0.11 | |
| Week Change: 4.92% Year-to-date Change: 28.4% | |
| PROK Links: Profile News Message Board | |
| Charts:- Daily , Weekly | |
| Add PROK to Watchlist: View: Get Complete PROK Trend Analysis ➞ | |
 | KOD Kodiak Sciences Inc. |
| Sector: Health Care | |
| SubSector: Biotechnology | |
| MarketCap: 2132.15 Millions | |
| Recent Price: 3.96 Smart Investing & Trading Score: 69 | |
| Day Percent Change: 4.91% Day Change: 0.19 | |
| Week Change: 4.91% Year-to-date Change: 30.1% | |
| KOD Links: Profile News Message Board | |
| Charts:- Daily , Weekly | |
| Add KOD to Watchlist: View: Get Complete KOD Trend Analysis ➞ | |
 | MGNX MacroGenics, Inc. |
| Sector: Health Care | |
| SubSector: Biotechnology | |
| MarketCap: 262.785 Millions | |
| Recent Price: 16.43 Smart Investing & Trading Score: 24 | |
| Day Percent Change: 4.82% Day Change: 0.76 | |
| Week Change: 4.82% Year-to-date Change: 70.7% | |
| MGNX Links: Profile News Message Board | |
| Charts:- Daily , Weekly | |
| Add MGNX to Watchlist: View: Get Complete MGNX Trend Analysis ➞ | |
 | OBIO Orchestra BioMed Holdings, Inc. |
| Sector: Health Care | |
| SubSector: Biotechnology | |
| MarketCap: 271 Millions | |
| Recent Price: 5.18 Smart Investing & Trading Score: 74 | |
| Day Percent Change: 4.65% Day Change: 0.23 | |
| Week Change: 4.65% Year-to-date Change: -43.1% | |
| OBIO Links: Profile News Message Board | |
| Charts:- Daily , Weekly | |
| Add OBIO to Watchlist: View: Get Complete OBIO Trend Analysis ➞ | |
 | ALHC Alignment Healthcare, Inc. |
| Sector: Health Care | |
| SubSector: Healthcare Plans | |
| MarketCap: 1100 Millions | |
| Recent Price: 6.79 Smart Investing & Trading Score: 100 | |
| Day Percent Change: 4.54% Day Change: 0.29 | |
| Week Change: 4.54% Year-to-date Change: -23.3% | |
| ALHC Links: Profile News Message Board | |
| Charts:- Daily , Weekly | |
| Add ALHC to Watchlist: View: Get Complete ALHC Trend Analysis ➞ | |
 | MLYS Mineralys Therapeutics, Inc. |
| Sector: Health Care | |
| SubSector: Biotechnology | |
| MarketCap: 719 Millions | |
| Recent Price: 13.74 Smart Investing & Trading Score: 74 | |
| Day Percent Change: 4.45% Day Change: 0.59 | |
| Week Change: 4.45% Year-to-date Change: 57.6% | |
| MLYS Links: Profile News Message Board | |
| Charts:- Daily , Weekly | |
| Add MLYS to Watchlist: View: Get Complete MLYS Trend Analysis ➞ | |
 | SGRY Surgery Partners, Inc. |
| Sector: Health Care | |
| SubSector: Hospitals | |
| MarketCap: 328.446 Millions | |
| Recent Price: 25.62 Smart Investing & Trading Score: 64 | |
| Day Percent Change: 4.44% Day Change: 1.09 | |
| Week Change: 4.44% Year-to-date Change: -19.9% | |
| SGRY Links: Profile News Message Board | |
| Charts:- Daily , Weekly | |
| Add SGRY to Watchlist: View: Get Complete SGRY Trend Analysis ➞ | |
 | LXRX Lexicon Pharmaceuticals, Inc. |
| Sector: Health Care | |
| SubSector: Biotechnology | |
| MarketCap: 251.185 Millions | |
| Recent Price: 1.81 Smart Investing & Trading Score: 57 | |
| Day Percent Change: 4.31% Day Change: 0.07 | |
| Week Change: 4.31% Year-to-date Change: 18.6% | |
| LXRX Links: Profile News Message Board | |
| Charts:- Daily , Weekly | |
| Add LXRX to Watchlist: View: Get Complete LXRX Trend Analysis ➞ | |
 | ZURA Zura Bio Limited |
| Sector: Health Care | |
| SubSector: Biotechnology | |
| MarketCap: 242 Millions | |
| Recent Price: 4.70 Smart Investing & Trading Score: 95 | |
| Day Percent Change: 4.21% Day Change: 0.19 | |
| Week Change: 4.21% Year-to-date Change: 0.3% | |
| ZURA Links: Profile News Message Board | |
| Charts:- Daily , Weekly | |
| Add ZURA to Watchlist: View: Get Complete ZURA Trend Analysis ➞ | |
 | ALXO ALX Oncology Holdings Inc. |
| Sector: Health Care | |
| SubSector: Biotechnology | |
| MarketCap: 41787 Millions | |
| Recent Price: 16.00 Smart Investing & Trading Score: 63 | |
| Day Percent Change: 4.17% Day Change: 0.64 | |
| Week Change: 4.17% Year-to-date Change: 7.5% | |
| ALXO Links: Profile News Message Board | |
| Charts:- Daily , Weekly | |
| Add ALXO to Watchlist: View: Get Complete ALXO Trend Analysis ➞ | |
 | TNGX Tango Therapeutics, Inc. |
| Sector: Health Care | |
| SubSector: Biotechnology | |
| MarketCap: 302 Millions | |
| Recent Price: 7.89 Smart Investing & Trading Score: 59 | |
| Day Percent Change: 4.16% Day Change: 0.31 | |
| Week Change: 4.16% Year-to-date Change: -20.3% | |
| TNGX Links: Profile News Message Board | |
| Charts:- Daily , Weekly | |
| Add TNGX to Watchlist: View: Get Complete TNGX Trend Analysis ➞ | |
 | CARA Cara Therapeutics, Inc. |
| Sector: Health Care | |
| SubSector: Biotechnology | |
| MarketCap: 597.985 Millions | |
| Recent Price: 0.81 Smart Investing & Trading Score: 69 | |
| Day Percent Change: 4.09% Day Change: 0.03 | |
| Week Change: 4.09% Year-to-date Change: 9.0% | |
| CARA Links: Profile News Message Board | |
| Charts:- Daily , Weekly | |
| Add CARA to Watchlist: View: Get Complete CARA Trend Analysis ➞ | |
 | IRTC iRhythm Technologies, Inc. |
| Sector: Health Care | |
| SubSector: Medical Instruments & Supplies | |
| MarketCap: 2167.9 Millions | |
| Recent Price: 106.78 Smart Investing & Trading Score: 0 | |
| Day Percent Change: 3.99% Day Change: 4.10 | |
| Week Change: 3.99% Year-to-date Change: -0.2% | |
| IRTC Links: Profile News Message Board | |
| Charts:- Daily , Weekly | |
| Add IRTC to Watchlist: View: Get Complete IRTC Trend Analysis ➞ | |
 | ETNB 89bio, Inc. |
| Sector: Health Care | |
| SubSector: Biotechnology | |
| MarketCap: 517.485 Millions | |
| Recent Price: 9.59 Smart Investing & Trading Score: 64 | |
| Day Percent Change: 3.96% Day Change: 0.37 | |
| Week Change: 3.96% Year-to-date Change: -14.2% | |
| ETNB Links: Profile News Message Board | |
| Charts:- Daily , Weekly | |
| Add ETNB to Watchlist: View: Get Complete ETNB Trend Analysis ➞ | |
 | PETS PetMed Express, Inc. |
| Sector: Health Care | |
| SubSector: Drug Delivery | |
| MarketCap: 528.23 Millions | |
| Recent Price: 4.21 Smart Investing & Trading Score: 52 | |
| Day Percent Change: 3.95% Day Change: 0.16 | |
| Week Change: 3.95% Year-to-date Change: -44.3% | |
| PETS Links: Profile News Message Board | |
| Charts:- Daily , Weekly | |
| Add PETS to Watchlist: View: Get Complete PETS Trend Analysis ➞ | |
 | FATE Fate Therapeutics, Inc. |
| Sector: Health Care | |
| SubSector: Biotechnology | |
| MarketCap: 2022.45 Millions | |
| Recent Price: 4.22 Smart Investing & Trading Score: 23 | |
| Day Percent Change: 3.94% Day Change: 0.16 | |
| Week Change: 3.94% Year-to-date Change: 12.8% | |
| FATE Links: Profile News Message Board | |
| Charts:- Daily , Weekly | |
| Add FATE to Watchlist: View: Get Complete FATE Trend Analysis ➞ | |
 | XFOR X4 Pharmaceuticals, Inc. |
| Sector: Health Care | |
| SubSector: Biotechnology | |
| MarketCap: 143.385 Millions | |
| Recent Price: 1.20 Smart Investing & Trading Score: 63 | |
| Day Percent Change: 3.91% Day Change: 0.05 | |
| Week Change: 3.91% Year-to-date Change: 42.5% | |
| XFOR Links: Profile News Message Board | |
| Charts:- Daily , Weekly | |
| Add XFOR to Watchlist: View: Get Complete XFOR Trend Analysis ➞ | |
| For tabular summary view of above stock list: Summary View ➞ 0 - 25 , 25 - 50 , 50 - 75 , 75 - 100 , 100 - 125 , 125 - 150 , 150 - 175 , 175 - 200 , 200 - 225 , 225 - 250 , 250 - 275 , 275 - 300 , 300 - 325 , 325 - 350 | ||
| Click To Change The Sort Order: By Market Cap or Company Size Performance: Year-to-date, Week and Day | |
| Select Chart Type: | ||
| Too many stocks? View smallcap stocks filtered by marketcap & sector |
| Marketcap: All SmallCap Stocks (default-no microcap), Large, Mid-Range, Small & MicroCap |
| Sector: Tech, Finance, Energy, Staples, Retail, Industrial, Materials, Utilities & Medical |
|
Best Stocks Today 12Stocks.com |
© 2024 12Stocks.com Terms & Conditions Privacy Contact Us
All Information Provided Only For Education And Not To Be Used For Investing or Trading. See Terms & Conditions


One More Thing ... Get Best Stocks Delivered Daily!
Never Ever Miss A Move With Our Top Ten Stocks Lists
Find Best Stocks In Any Market - Bull or Bear Market
Take A Peek At Our Top Ten Stocks Lists: Daily, Weekly, Year-to-Date & Top Trends
Find Best Stocks In Any Market - Bull or Bear Market
Take A Peek At Our Top Ten Stocks Lists: Daily, Weekly, Year-to-Date & Top Trends
Smallcap Stocks With Best Up Trends [0-bearish to 100-bullish]: Perficient [100], Outset Medical[100], Dakota Gold[100], PMV [100], Twist Bioscience[100], SilverBow Resources[100], Regional Management[100], TPI Composites[100], AeroVironment [100], Solid Power[100], Wolverine World[100]
Best Smallcap Stocks Year-to-Date:
CareMax [511.34%], Janux [479.25%], Viking [320.15%], Alpine Immune[239.29%], Longboard [237.32%], Bakkt [197.53%], Vera [194.15%], Super Micro[192.28%], Avidity Biosciences[189.6%], Cullinan Oncology[178.76%], Y-mAbs [153.23%] Best Smallcap Stocks This Week:
Perficient [52.24%], P3 Health[25.16%], Outset Medical[23%], Lineage Cell[22.64%], SoundHound AI[19.54%], DASAN Zhone[19.25%], Workhorse Group[19.13%], BioCryst [18.65%], Marathon Patent[18.09%], Aceto [17.24%], Assertio [16.99%] Best Smallcap Stocks Daily:
Perficient [52.24%], P3 Health[25.16%], Outset Medical[23.00%], Lineage Cell[22.64%], SoundHound AI[19.54%], DASAN Zhone[19.25%], Workhorse Group[19.13%], BioCryst [18.65%], Marathon Patent[18.09%], Aceto [17.24%], Assertio [16.99%]