
 Login Sign Up


| |||||
 |  | ||||

| 12Stocks.com Market Intelligence |
Best SmallCap Stocks
|
| In a hurry? Small Cap Stock Lists: Performance Trends Table, Stock Charts
Sort Small Cap stocks: Daily, Weekly, Year-to-Date, Market Cap & Trends. Filter Small Cap stocks list by sector: Show all, Tech, Finance, Energy, Staples, Retail, Industrial, Materials, Utilities and HealthCare Filter Small Cap stocks list by size: All Large Medium Small and MicroCap |
| 12Stocks.com Small Cap Stocks Performances & Trends Daily | |||||||||
|
|  The overall Smart Investing & Trading Score is 90 (0-bearish to 100-bullish) which puts Small Cap index in short term bullish trend. The Smart Investing & Trading Score from previous trading session is 100 and hence a deterioration of trend.
| ||||||||
Here are the Smart Investing & Trading Scores of the most requested small cap stocks at 12Stocks.com (click stock name for detailed review):
|


| 12Stocks.com: Investing in Smallcap Index with Stocks | |
|
The following table helps investors and traders sort through current performance and trends (as measured by Smart Investing & Trading Score) of various
stocks in the Smallcap Index. Quick View: Move mouse or cursor over stock symbol (ticker) to view short-term technical chart and over stock name to view long term chart. Click on  to add stock symbol to your watchlist and to add stock symbol to your watchlist and  to view watchlist. Click on any ticker or stock name for detailed market intelligence report for that stock. to view watchlist. Click on any ticker or stock name for detailed market intelligence report for that stock. |
12Stocks.com Performance of Stocks in Smallcap Index
| Ticker | Stock Name | Watchlist | Category | Recent Price | Smart Investing & Trading Score | Change % | YTD Change% |
| GEF | Greif |   | Consumer Staples | 64.28 | 68 | 0.36 | -2.00% |
| STKL | SunOpta | | Consumer Staples | 5.62 | 17 | 0.36 | 2.74% |
| NC | NACCO Industries | | Consumer Staples | 31.79 | 57 | 0.35 | -12.90% |
| ENR | Energizer | | Consumer Staples | 30.95 | 95 | 0.32 | -2.30% |
| WNC | Wabash National | | Consumer Staples | 23.22 | 25 | 0.30 | -9.37% |
| DOLE | Dole | | Consumer Staples | 12.75 | 100 | 0.24 | 3.36% |
| ADNT | Adient | | Consumer Staples | 29.64 | 35 | 0.24 | -18.48% |
| REVG | REV Group | | Consumer Staples | 26.02 | 90 | 0.08 | 43.20% |
| JOUT | Johnson Outdoors | | Consumer Staples | 37.59 | 10 | 0.05 | -29.63% |
| COCO | Vita Coco | | Consumer Staples | 26.26 | 50 | 0.00 | 1.98% |
| AXL | American Axle | | Consumer Staples | 7.90 | 95 | 0.00 | -10.33% |
| SKIN | Beauty Health | | Consumer Staples | 2.77 | 35 | 0.00 | -12.48% |
| EPC | Edgewell Personal | | Consumer Staples | 40.42 | 76 | -0.02 | 10.35% |
| FIZZ | National Beverage | | Consumer Staples | 47.42 | 42 | -0.08 | -4.63% |
| UFPT | UFP | | Consumer Staples | 261.42 | 78 | -0.10 | 51.95% |
| VRA | Vera Bradley | | Consumer Staples | 7.76 | 77 | -0.13 | 0.78% |
| LMNR | Limoneira | | Consumer Staples | 21.22 | 63 | -0.19 | 2.86% |
| HELE | Helen of Troy | | Consumer Staples | 108.08 | 57 | -0.20 | -10.54% |
| SCS | Steelcase | | Consumer Staples | 13.58 | 64 | -0.22 | 0.44% |
| ESCA | Escalade | | Consumer Staples | 13.67 | 44 | -0.36 | -31.96% |
| UDMY | Udemy | | Consumer Staples | 9.89 | 35 | -0.40 | -33.53% |
| LANC | Lancaster Colony | | Consumer Staples | 192.57 | 22 | -0.42 | 15.73% |
| PRMW | Primo Water | | Consumer Staples | 21.24 | 76 | -0.56 | 41.13% |
| DORM | Dorman Products | | Consumer Staples | 92.16 | 32 | -0.58 | 10.49% |
| WEYS | Weyco Group | | Consumer Staples | 29.81 | 64 | -0.60 | -4.94% |
| For chart view version of above stock list: Chart View ➞ 0 - 25 , 25 - 50 , 50 - 75 , 75 - 100 , 100 - 125 | ||
 | Click To Change The Sort Order: By Market Cap or Company Size Performance: Year-to-date, Week and Day |  |
| Too many stocks? View smallcap stocks filtered by marketcap & sector |
| Marketcap: All SmallCap Stocks (default-no microcap), Large, Mid-Range, Small |
| Smallcap Sector: Tech, Finance, Energy, Staples, Retail, Industrial, Materials, & Medical |
|
Get the most comprehensive stock market coverage daily at 12Stocks.com ➞ Best Stocks Today ➞ Best Stocks Weekly ➞ Best Stocks Year-to-Date ➞ Best Stocks Trends ➞  Best Stocks Today 12Stocks.com Best Nasdaq Stocks ➞ Best S&P 500 Stocks ➞ Best Tech Stocks ➞ Best Biotech Stocks ➞ |
| Detailed Overview of SmallCap Stocks |
| SmallCap Technical Overview, Leaders & Laggards, Top SmallCap ETF Funds & Detailed SmallCap Stocks List, Charts, Trends & More |
| Smallcap: Technical Analysis, Trends & YTD Performance | |
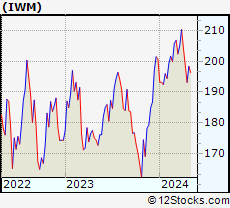
| SmallCap segment as represented by
IWM, an exchange-traded fund [ETF], holds basket of thousands of smallcap stocks from across all major sectors of the US stock market. The smallcap index (contains stocks like Riverbed & Sotheby's) is up by 3.6% and is currently underperforming the overall market by -6.82% year-to-date. Below is a quick view of technical charts and trends: | |
 IWM Weekly Chart |
|
| Long Term Trend: Very Good | |
| Medium Term Trend: Very Good | |
 IWM Daily Chart |
|
| Short Term Trend: Good | |
| Overall Trend Score: 90 | |
| YTD Performance: 3.6% | |
| **Trend Scores & Views Are Only For Educational Purposes And Not For Investing | |
| 12Stocks.com: Top Performing Small Cap Index Stocks | ||||||||||||||||||||||||||||||||||||||||||||||||
 The top performing Small Cap Index stocks year to date are
Now, more recently, over last week, the top performing Small Cap Index stocks on the move are


|
||||||||||||||||||||||||||||||||||||||||||||||||
| 12Stocks.com: Investing in Smallcap Index using Exchange Traded Funds | |
|
The following table shows list of key exchange traded funds (ETF) that
help investors track Smallcap index. The following list also includes leveraged ETF funds that track twice or thrice the daily returns of Smallcap indices. Short or inverse ETF funds move in the opposite direction to the index they track and are useful during market pullbacks or during bear markets. Quick View: Move mouse or cursor over ETF symbol (ticker) to view short-term technical chart and over ETF name to view long term chart. Click on ticker or stock name for detailed view. Click on to add stock symbol to your watchlist and to view watchlist. |
12Stocks.com List of ETFs that track Smallcap Index
| Ticker | ETF Name | Watchlist | Recent Price | Smart Investing & Trading Score | Change % | Week % | Year-to-date % |
| IWM | iShares Russell 2000 | | 207.93 | 90 | -0.72 | 1.77 | 3.6% |
| VTWO | Vanguard Russell 2000 ETF | | 84.11 | 85 | -0.61 | 1.8 | 3.71% |
| IJR | iShares Core S&P Small-Cap | | 110.63 | 83 | -0.14 | 1.51 | 2.2% |
| IWN | iShares Russell 2000 Value | | 158.82 | 88 | 0.06 | 1.68 | 2.25% |
| IJT | iShares S&P Small-Cap 600 Growth | | 131.29 | 78 | -0.69 | 1.1 | 4.91% |
| IJS | iShares S&P Small-Cap 600 Value | | 102.02 | 83 | -0.11 | 1.49 | -1.02% |
| IWO | iShares Russell 2000 Growth | | 267.15 | 95 | 0.21 | 2.78 | 5.92% |
| XSLV | PowerShares S&P SmallCap Low Volatil ETF | | 44.48 | 76 | -0.02 | 0.57 | 0.75% |
| SBB | ProShares Short SmallCap600 | | 15.71 | 17 | 0.32 | -1.54 | -1.38% |
| SAA | ProShares Ultra SmallCap600 | | 24.78 | 71 | -1.69 | 1.77 | -0.68% |
| SMLV | SPDR SSGA US Small Cap Low Volatil ETF | | 112.79 | 95 | 0.22 | 1.41 | 0.24% |
| SDD | ProShares UltraShort SmallCap600 | | 17.67 | 27 | 0.00 | -3.34 | -4.11% |
| 12Stocks.com: Charts, Trends, Fundamental Data and Performances of SmallCap Stocks | |
|
We now take in-depth look at all SmallCap stocks including charts, multi-period performances and overall trends (as measured by Smart Investing & Trading Score). One can sort SmallCap stocks (click link to choose) by Daily, Weekly and by Year-to-Date performances. Also, one can sort by size of the company or by market capitalization. |
| Select Your Default Chart Type: | |||||
| |||||
| Click on stock symbol or name for detailed view. Click on to add stock symbol to your watchlist and to view watchlist. Quick View: Move mouse or cursor over "Daily" to quickly view daily technical stock chart and over "Weekly" to view weekly technical stock chart. | |||||

 | GEF Greif, Inc. |
| Sector: Consumer Staples | |
| SubSector: Packaging & Containers | |
| MarketCap: 1563.03 Millions | |
| Recent Price: 64.28 Smart Investing & Trading Score: 68 | |
| Day Percent Change: 0.36% Day Change: 0.23 | |
| Week Change: 0.34% Year-to-date Change: -2.0% | |
| GEF Links: Profile News Message Board | |
| Charts:- Daily , Weekly | |
| Add GEF to Watchlist: View: Get Complete GEF Trend Analysis ➞ | |
 | STKL SunOpta Inc. |
| Sector: Consumer Staples | |
| SubSector: Processed & Packaged Goods | |
| MarketCap: 174.548 Millions | |
| Recent Price: 5.62 Smart Investing & Trading Score: 17 | |
| Day Percent Change: 0.36% Day Change: 0.02 | |
| Week Change: -3.77% Year-to-date Change: 2.7% | |
| STKL Links: Profile News Message Board | |
| Charts:- Daily , Weekly | |
| Add STKL to Watchlist: View: Get Complete STKL Trend Analysis ➞ | |
 | NC NACCO Industries, Inc. |
| Sector: Consumer Staples | |
| SubSector: Home Furnishings & Fixtures | |
| MarketCap: 179.835 Millions | |
| Recent Price: 31.79 Smart Investing & Trading Score: 57 | |
| Day Percent Change: 0.35% Day Change: 0.11 | |
| Week Change: -0.25% Year-to-date Change: -12.9% | |
| NC Links: Profile News Message Board | |
| Charts:- Daily , Weekly | |
| Add NC to Watchlist: View: Get Complete NC Trend Analysis ➞ | |
 | ENR Energizer Holdings, Inc. |
| Sector: Consumer Staples | |
| SubSector: Personal Products | |
| MarketCap: 2469.55 Millions | |
| Recent Price: 30.95 Smart Investing & Trading Score: 95 | |
| Day Percent Change: 0.32% Day Change: 0.10 | |
| Week Change: 2.96% Year-to-date Change: -2.3% | |
| ENR Links: Profile News Message Board | |
| Charts:- Daily , Weekly | |
| Add ENR to Watchlist: View: Get Complete ENR Trend Analysis ➞ | |
 | WNC Wabash National Corporation |
| Sector: Consumer Staples | |
| SubSector: Trucks & Other Vehicles | |
| MarketCap: 482.597 Millions | |
| Recent Price: 23.22 Smart Investing & Trading Score: 25 | |
| Day Percent Change: 0.30% Day Change: 0.07 | |
| Week Change: -0.26% Year-to-date Change: -9.4% | |
| WNC Links: Profile News Message Board | |
| Charts:- Daily , Weekly | |
| Add WNC to Watchlist: View: Get Complete WNC Trend Analysis ➞ | |
 | DOLE Dole plc |
| Sector: Consumer Staples | |
| SubSector: Farm Products | |
| MarketCap: 1300 Millions | |
| Recent Price: 12.75 Smart Investing & Trading Score: 100 | |
| Day Percent Change: 0.24% Day Change: 0.03 | |
| Week Change: 3.57% Year-to-date Change: 3.4% | |
| DOLE Links: Profile News Message Board | |
| Charts:- Daily , Weekly | |
| Add DOLE to Watchlist: View: Get Complete DOLE Trend Analysis ➞ | |
 | ADNT Adient plc |
| Sector: Consumer Staples | |
| SubSector: Auto Parts | |
| MarketCap: 1003.39 Millions | |
| Recent Price: 29.64 Smart Investing & Trading Score: 35 | |
| Day Percent Change: 0.24% Day Change: 0.07 | |
| Week Change: 2.53% Year-to-date Change: -18.5% | |
| ADNT Links: Profile News Message Board | |
| Charts:- Daily , Weekly | |
| Add ADNT to Watchlist: View: Get Complete ADNT Trend Analysis ➞ | |
 | REVG REV Group, Inc. |
| Sector: Consumer Staples | |
| SubSector: Trucks & Other Vehicles | |
| MarketCap: 398.597 Millions | |
| Recent Price: 26.02 Smart Investing & Trading Score: 90 | |
| Day Percent Change: 0.08% Day Change: 0.02 | |
| Week Change: -2% Year-to-date Change: 43.2% | |
| REVG Links: Profile News Message Board | |
| Charts:- Daily , Weekly | |
| Add REVG to Watchlist: View: Get Complete REVG Trend Analysis ➞ | |
 | JOUT Johnson Outdoors Inc. |
| Sector: Consumer Staples | |
| SubSector: Sporting Goods | |
| MarketCap: 572.844 Millions | |
| Recent Price: 37.59 Smart Investing & Trading Score: 10 | |
| Day Percent Change: 0.05% Day Change: 0.02 | |
| Week Change: -0.24% Year-to-date Change: -29.6% | |
| JOUT Links: Profile News Message Board | |
| Charts:- Daily , Weekly | |
| Add JOUT to Watchlist: View: Get Complete JOUT Trend Analysis ➞ | |
 | COCO The Vita Coco Company, Inc. |
| Sector: Consumer Staples | |
| SubSector: Beverages - Non-Alcoholic | |
| MarketCap: 1510 Millions | |
| Recent Price: 26.26 Smart Investing & Trading Score: 50 | |
| Day Percent Change: 0.00% Day Change: 0.00 | |
| Week Change: -1.46% Year-to-date Change: 2.0% | |
| COCO Links: Profile News Message Board | |
| Charts:- Daily , Weekly | |
| Add COCO to Watchlist: View: Get Complete COCO Trend Analysis ➞ | |
 | AXL American Axle & Manufacturing Holdings, Inc. |
| Sector: Consumer Staples | |
| SubSector: Auto Parts | |
| MarketCap: 407.139 Millions | |
| Recent Price: 7.90 Smart Investing & Trading Score: 95 | |
| Day Percent Change: 0.00% Day Change: 0.00 | |
| Week Change: 3.67% Year-to-date Change: -10.3% | |
| AXL Links: Profile News Message Board | |
| Charts:- Daily , Weekly | |
| Add AXL to Watchlist: View: Get Complete AXL Trend Analysis ➞ | |
 | SKIN The Beauty Health Company |
| Sector: Consumer Staples | |
| SubSector: Household & Personal Products | |
| MarketCap: 1070 Millions | |
| Recent Price: 2.77 Smart Investing & Trading Score: 35 | |
| Day Percent Change: 0.00% Day Change: 0.00 | |
| Week Change: 1.09% Year-to-date Change: -12.5% | |
| SKIN Links: Profile News Message Board | |
| Charts:- Daily , Weekly | |
| Add SKIN to Watchlist: View: Get Complete SKIN Trend Analysis ➞ | |
 | EPC Edgewell Personal Care Company |
| Sector: Consumer Staples | |
| SubSector: Personal Products | |
| MarketCap: 1605.95 Millions | |
| Recent Price: 40.42 Smart Investing & Trading Score: 76 | |
| Day Percent Change: -0.02% Day Change: -0.01 | |
| Week Change: 1.13% Year-to-date Change: 10.4% | |
| EPC Links: Profile News Message Board | |
| Charts:- Daily , Weekly | |
| Add EPC to Watchlist: View: Get Complete EPC Trend Analysis ➞ | |
 | FIZZ National Beverage Corp. |
| Sector: Consumer Staples | |
| SubSector: Beverages - Soft Drinks | |
| MarketCap: 2031.4 Millions | |
| Recent Price: 47.42 Smart Investing & Trading Score: 42 | |
| Day Percent Change: -0.08% Day Change: -0.04 | |
| Week Change: -1.45% Year-to-date Change: -4.6% | |
| FIZZ Links: Profile News Message Board | |
| Charts:- Daily , Weekly | |
| Add FIZZ to Watchlist: View: Get Complete FIZZ Trend Analysis ➞ | |
 | UFPT UFP Technologies, Inc. |
| Sector: Consumer Staples | |
| SubSector: Packaging & Containers | |
| MarketCap: 284.053 Millions | |
| Recent Price: 261.42 Smart Investing & Trading Score: 78 | |
| Day Percent Change: -0.10% Day Change: -0.27 | |
| Week Change: 0.38% Year-to-date Change: 52.0% | |
| UFPT Links: Profile News Message Board | |
| Charts:- Daily , Weekly | |
| Add UFPT to Watchlist: View: Get Complete UFPT Trend Analysis ➞ | |
 | VRA Vera Bradley, Inc. |
| Sector: Consumer Staples | |
| SubSector: Textile - Apparel Footwear & Accessories | |
| MarketCap: 151.17 Millions | |
| Recent Price: 7.76 Smart Investing & Trading Score: 77 | |
| Day Percent Change: -0.13% Day Change: -0.01 | |
| Week Change: 3.74% Year-to-date Change: 0.8% | |
| VRA Links: Profile News Message Board | |
| Charts:- Daily , Weekly | |
| Add VRA to Watchlist: View: Get Complete VRA Trend Analysis ➞ | |
 | LMNR Limoneira Company |
| Sector: Consumer Staples | |
| SubSector: Farm Products | |
| MarketCap: 324.987 Millions | |
| Recent Price: 21.22 Smart Investing & Trading Score: 63 | |
| Day Percent Change: -0.19% Day Change: -0.04 | |
| Week Change: -0.05% Year-to-date Change: 2.9% | |
| LMNR Links: Profile News Message Board | |
| Charts:- Daily , Weekly | |
| Add LMNR to Watchlist: View: Get Complete LMNR Trend Analysis ➞ | |
 | HELE Helen of Troy Limited |
| Sector: Consumer Staples | |
| SubSector: Housewares & Accessories | |
| MarketCap: 3199.53 Millions | |
| Recent Price: 108.08 Smart Investing & Trading Score: 57 | |
| Day Percent Change: -0.20% Day Change: -0.22 | |
| Week Change: 5.55% Year-to-date Change: -10.5% | |
| HELE Links: Profile News Message Board | |
| Charts:- Daily , Weekly | |
| Add HELE to Watchlist: View: Get Complete HELE Trend Analysis ➞ | |
 | SCS Steelcase Inc. |
| Sector: Consumer Staples | |
| SubSector: Business Equipment | |
| MarketCap: 1310.77 Millions | |
| Recent Price: 13.58 Smart Investing & Trading Score: 64 | |
| Day Percent Change: -0.22% Day Change: -0.03 | |
| Week Change: 3.27% Year-to-date Change: 0.4% | |
| SCS Links: Profile News Message Board | |
| Charts:- Daily , Weekly | |
| Add SCS to Watchlist: View: Get Complete SCS Trend Analysis ➞ | |
 | ESCA Escalade, Incorporated |
| Sector: Consumer Staples | |
| SubSector: Sporting Goods | |
| MarketCap: 87.8144 Millions | |
| Recent Price: 13.67 Smart Investing & Trading Score: 44 | |
| Day Percent Change: -0.36% Day Change: -0.05 | |
| Week Change: 0.44% Year-to-date Change: -32.0% | |
| ESCA Links: Profile News Message Board | |
| Charts:- Daily , Weekly | |
| Add ESCA to Watchlist: View: Get Complete ESCA Trend Analysis ➞ | |
 | UDMY Udemy, Inc. |
| Sector: Consumer Staples | |
| SubSector: Education & Training Services | |
| MarketCap: 1570 Millions | |
| Recent Price: 9.89 Smart Investing & Trading Score: 35 | |
| Day Percent Change: -0.40% Day Change: -0.04 | |
| Week Change: 0.2% Year-to-date Change: -33.5% | |
| UDMY Links: Profile News Message Board | |
| Charts:- Daily , Weekly | |
| Add UDMY to Watchlist: View: Get Complete UDMY Trend Analysis ➞ | |
 | LANC Lancaster Colony Corporation |
| Sector: Consumer Staples | |
| SubSector: Food - Major Diversified | |
| MarketCap: 4060.83 Millions | |
| Recent Price: 192.57 Smart Investing & Trading Score: 22 | |
| Day Percent Change: -0.42% Day Change: -0.82 | |
| Week Change: -2.53% Year-to-date Change: 15.7% | |
| LANC Links: Profile News Message Board | |
| Charts:- Daily , Weekly | |
| Add LANC to Watchlist: View: Get Complete LANC Trend Analysis ➞ | |
 | PRMW Primo Water Corporation |
| Sector: Consumer Staples | |
| SubSector: Beverages - Soft Drinks | |
| MarketCap: 1479.7 Millions | |
| Recent Price: 21.24 Smart Investing & Trading Score: 76 | |
| Day Percent Change: -0.56% Day Change: -0.12 | |
| Week Change: 0.28% Year-to-date Change: 41.1% | |
| PRMW Links: Profile News Message Board | |
| Charts:- Daily , Weekly | |
| Add PRMW to Watchlist: View: Get Complete PRMW Trend Analysis ➞ | |
 | DORM Dorman Products, Inc. |
| Sector: Consumer Staples | |
| SubSector: Auto Parts | |
| MarketCap: 2028.79 Millions | |
| Recent Price: 92.16 Smart Investing & Trading Score: 32 | |
| Day Percent Change: -0.58% Day Change: -0.54 | |
| Week Change: -0.3% Year-to-date Change: 10.5% | |
| DORM Links: Profile News Message Board | |
| Charts:- Daily , Weekly | |
| Add DORM to Watchlist: View: Get Complete DORM Trend Analysis ➞ | |
 | WEYS Weyco Group, Inc. |
| Sector: Consumer Staples | |
| SubSector: Textile - Apparel Footwear & Accessories | |
| MarketCap: 198.87 Millions | |
| Recent Price: 29.81 Smart Investing & Trading Score: 64 | |
| Day Percent Change: -0.60% Day Change: -0.18 | |
| Week Change: 4.23% Year-to-date Change: -4.9% | |
| WEYS Links: Profile News Message Board | |
| Charts:- Daily , Weekly | |
| Add WEYS to Watchlist: View: Get Complete WEYS Trend Analysis ➞ | |
| For tabular summary view of above stock list: Summary View ➞ 0 - 25 , 25 - 50 , 50 - 75 , 75 - 100 , 100 - 125 | ||
| Click To Change The Sort Order: By Market Cap or Company Size Performance: Year-to-date, Week and Day | |
| Select Chart Type: | ||
| Too many stocks? View smallcap stocks filtered by marketcap & sector |
| Marketcap: All SmallCap Stocks (default-no microcap), Large, Mid-Range, Small & MicroCap |
| Sector: Tech, Finance, Energy, Staples, Retail, Industrial, Materials, Utilities & Medical |
|
Best Stocks Today 12Stocks.com |
© 2024 12Stocks.com Terms & Conditions Privacy Contact Us
All Information Provided Only For Education And Not To Be Used For Investing or Trading. See Terms & Conditions


One More Thing ... Get Best Stocks Delivered Daily!
Never Ever Miss A Move With Our Top Ten Stocks Lists
Find Best Stocks In Any Market - Bull or Bear Market
Take A Peek At Our Top Ten Stocks Lists: Daily, Weekly, Year-to-Date & Top Trends
Find Best Stocks In Any Market - Bull or Bear Market
Take A Peek At Our Top Ten Stocks Lists: Daily, Weekly, Year-to-Date & Top Trends
Smallcap Stocks With Best Up Trends [0-bearish to 100-bullish]: Trupanion [100], Zura Bio[100], SilverBow Resources[100], Novavax [100], Third Harmonic[100], Hawkins [100], BRP Group[100], Kura Sushi[100], Aurinia [100], Heron [100], Cadiz [100]
Best Smallcap Stocks Year-to-Date:
CareMax [471.13%], Bakkt [370.4%], Janux [342.16%], Viking [304.73%], Alpine Immune[241.18%], Longboard [235.68%], Super Micro[218.16%], Avidity Biosciences[217.7%], Novavax [200%], Arcutis Bio[182.35%], Sweetgreen [181.24%] Best Smallcap Stocks This Week:
Novavax [62.16%], MacroGenics [54.68%], Maxeon Solar[49.31%], SunPower [43.04%], Harrow Health[39.31%], Workhorse Group[39.06%], Humacyte [36.6%], ProKidney [34.88%], Allbirds [33.47%], Cadiz [28.76%], Fossil Group[28.72%] Best Smallcap Stocks Daily:
Maxeon Solar[26.56%], Allakos [22.36%], Ventyx Biosciences[18.85%], Trupanion [15.85%], Zura Bio[15.61%], Beyond Air[15.42%], SilverBow Resources[13.20%], Children s[13.09%], Comtech Tele[12.92%], Aceto [12.14%], Novavax [11.63%]